
|
|||||
|
 | |
| |
| |
| |
| |
| |
|
Gene: MEX3D |
Gene summary for MEX3D |
| Gene information | Species | Human | Gene symbol | MEX3D | Gene ID | 399664 |
| Gene name | mex-3 RNA binding family member D | |
| Gene Alias | MEX-3D | |
| Cytomap | 19p13.3 | |
| Gene Type | protein-coding | GO ID | GO:0006139 | UniProtAcc | Q86XN8 |
Top |
Malignant transformation analysis |
| Identification of the aberrant gene expression in precancerous and cancerous lesions by comparing the gene expression of stem-like cells in diseased tissues with normal stem cells |
| Entrez ID | Symbol | Replicates | Species | Organ | Tissue | Adj P-value | Log2FC | Malignancy |
| 399664 | MEX3D | HCC2_Meng | Human | Liver | HCC | 1.34e-09 | 3.87e-02 | 0.0107 |
| 399664 | MEX3D | HCC1 | Human | Liver | HCC | 1.49e-04 | 2.44e+00 | 0.5336 |
| 399664 | MEX3D | S027 | Human | Liver | HCC | 5.11e-07 | 4.75e-01 | 0.2446 |
| 399664 | MEX3D | S028 | Human | Liver | HCC | 3.51e-13 | 5.17e-01 | 0.2503 |
| 399664 | MEX3D | S029 | Human | Liver | HCC | 1.58e-02 | 1.27e-01 | 0.2581 |
| 399664 | MEX3D | male-WTA | Human | Thyroid | PTC | 1.50e-16 | 1.35e-01 | 0.1037 |
| 399664 | MEX3D | PTC04 | Human | Thyroid | PTC | 4.27e-04 | 9.69e-02 | 0.1927 |
| 399664 | MEX3D | PTC05 | Human | Thyroid | PTC | 2.60e-15 | 5.34e-01 | 0.2065 |
| 399664 | MEX3D | PTC06 | Human | Thyroid | PTC | 4.53e-23 | 5.37e-01 | 0.2057 |
| 399664 | MEX3D | PTC07 | Human | Thyroid | PTC | 1.33e-25 | 2.77e-01 | 0.2044 |
| 399664 | MEX3D | ATC12 | Human | Thyroid | ATC | 3.79e-07 | 9.82e-02 | 0.34 |
| 399664 | MEX3D | ATC13 | Human | Thyroid | ATC | 9.19e-13 | 2.10e-01 | 0.34 |
| 399664 | MEX3D | ATC2 | Human | Thyroid | ATC | 9.66e-08 | 5.59e-01 | 0.34 |
| 399664 | MEX3D | ATC4 | Human | Thyroid | ATC | 2.20e-05 | 1.36e-01 | 0.34 |
| 399664 | MEX3D | ATC5 | Human | Thyroid | ATC | 4.37e-15 | 2.37e-01 | 0.34 |
| Page: 1 |
| Tissue | Expression Dynamics | Abbreviation |
| Liver | 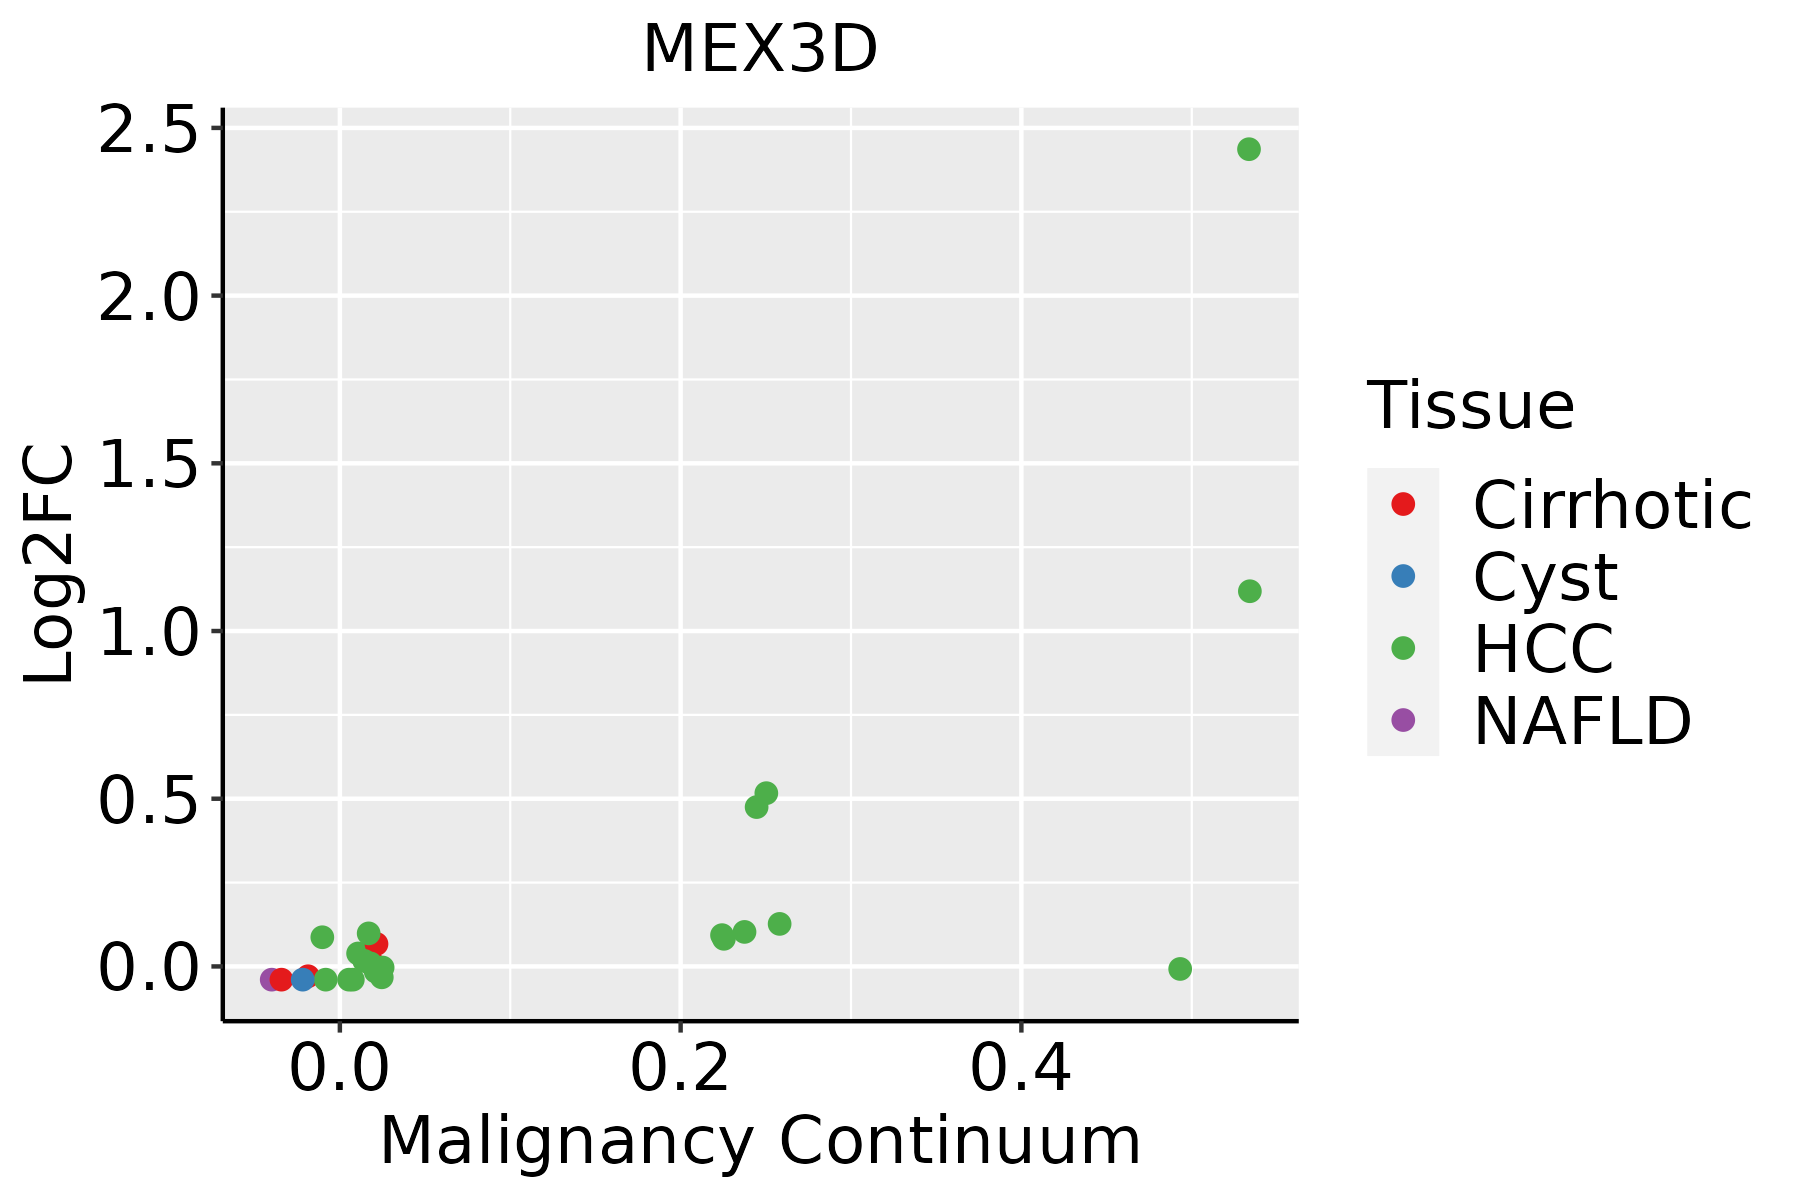 | HCC: Hepatocellular carcinoma |
| NAFLD: Non-alcoholic fatty liver disease | ||
| Thyroid | 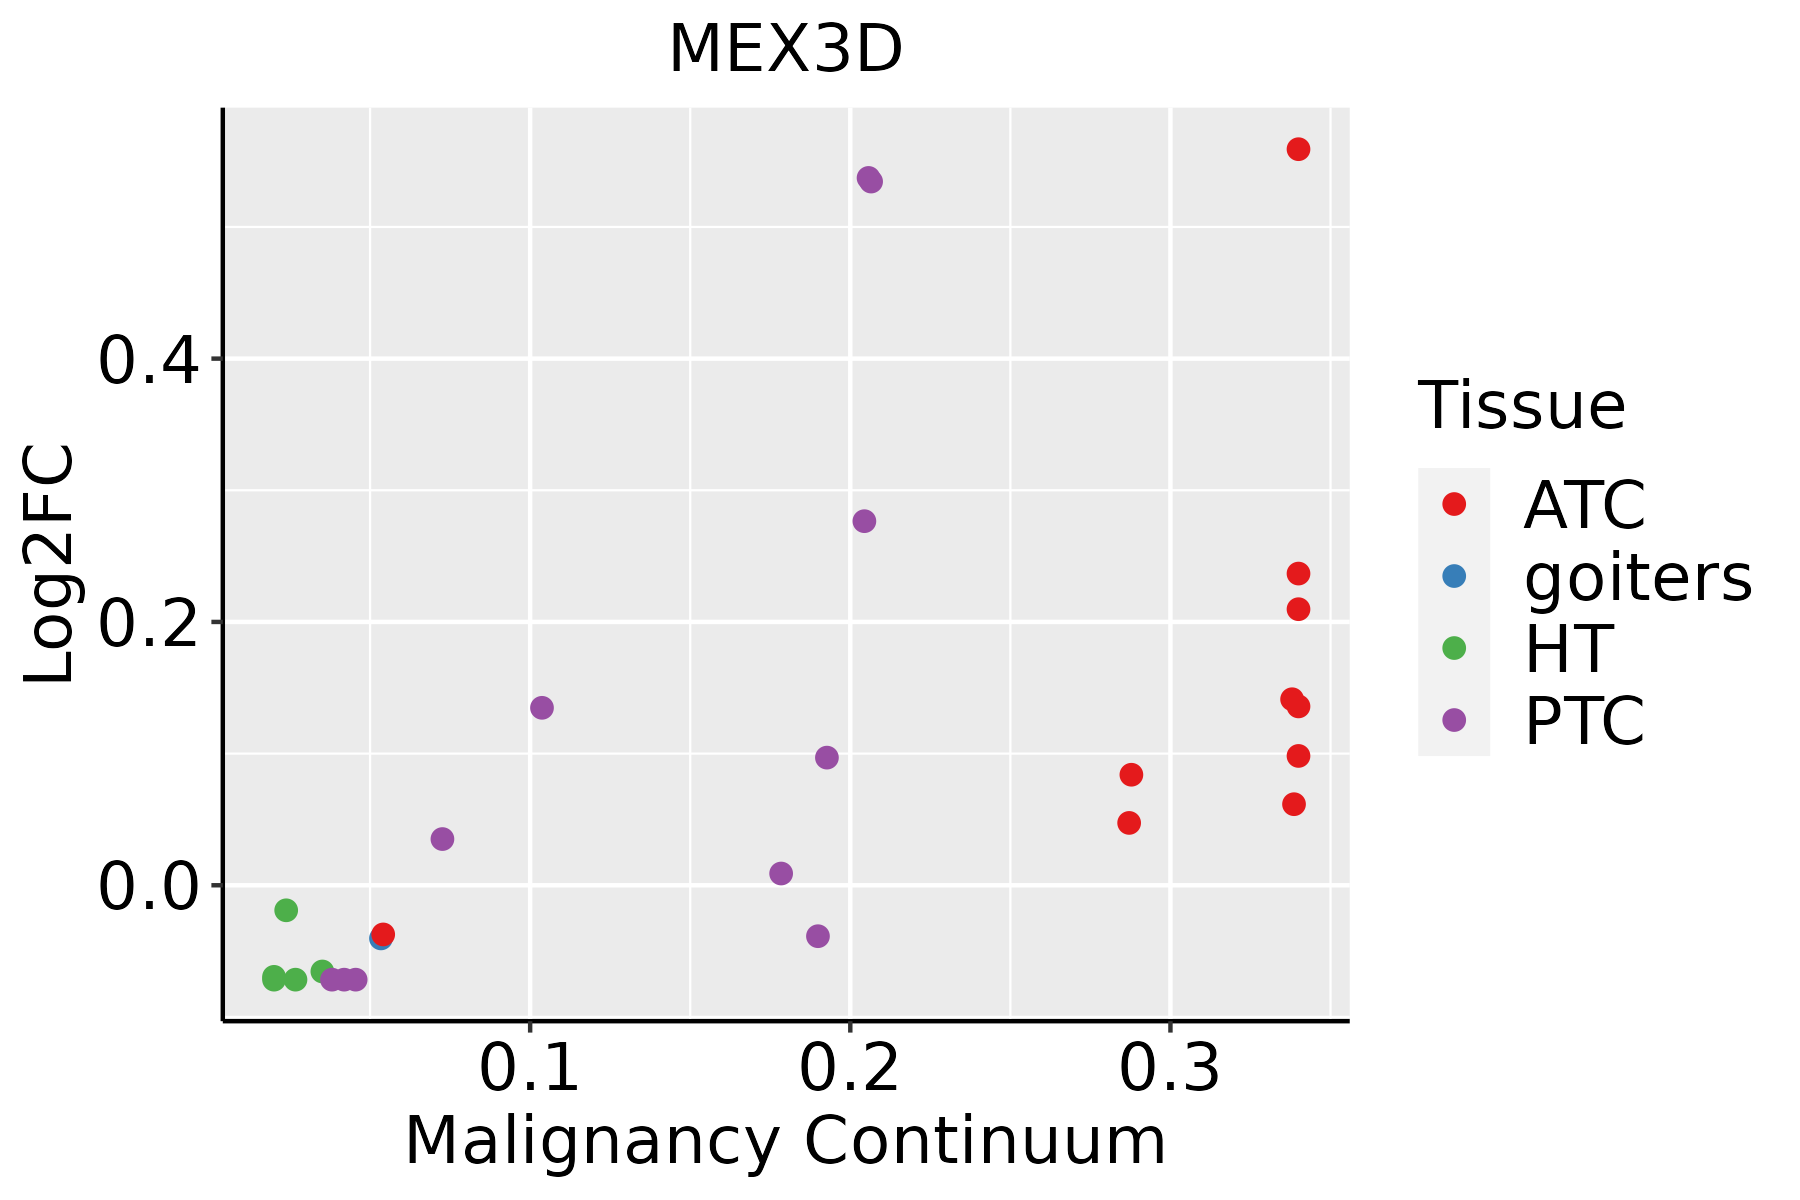 | ATC: Anaplastic thyroid cancer |
| HT: Hashimoto's thyroiditis | ||
| PTC: Papillary thyroid cancer |
| ∗log2FC in expression of this searched gene in stem-like cells from each diseased tissue sample relative to stem-like cells in normal samples in each tissue plotted against the malignancy continuum. Samples are colored based on if they are from different disease stage. |
Top |
Malignant transformation related pathway analysis |
| Find out the enriched GO biological processes and KEGG pathways involved in transition from healthy to precancer to cancer |
| Tissue | Disease Stage | Enriched GO biological Processes |
| Colorectum | AD |  |
| Colorectum | SER |  |
| Colorectum | MSS |  |
| Colorectum | MSI-H |  |
| Colorectum | FAP |  |
| ∗Top 15 enriched GO BP terms are showed in the bar plot of each disease state in each tissue. Each row represents a significant GO biological process which is colored according to the -log10(p.adjust). |
| Page: 1 2 3 4 5 6 7 8 9 |
| GO ID | Tissue | Disease Stage | Description | Gene Ratio | Bg Ratio | pvalue | p.adjust | Count |
| GO:0061157110 | Thyroid | ATC | mRNA destabilization | 52/6293 | 84/18723 | 1.01e-07 | 1.70e-06 | 52 |
| GO:0061014110 | Thyroid | ATC | positive regulation of mRNA catabolic process | 53/6293 | 87/18723 | 1.63e-07 | 2.61e-06 | 53 |
| GO:0050779110 | Thyroid | ATC | RNA destabilization | 53/6293 | 88/18723 | 2.75e-07 | 4.20e-06 | 53 |
| GO:003424923 | Thyroid | ATC | negative regulation of cellular amide metabolic process | 121/6293 | 273/18723 | 1.36e-04 | 9.57e-04 | 121 |
| GO:000829811 | Thyroid | ATC | intracellular mRNA localization | 11/6293 | 13/18723 | 2.30e-04 | 1.49e-03 | 11 |
| GO:001714823 | Thyroid | ATC | negative regulation of translation | 107/6293 | 245/18723 | 6.17e-04 | 3.51e-03 | 107 |
| Page: 1 2 3 4 |
| Pathway ID | Tissue | Disease Stage | Description | Gene Ratio | Bg Ratio | pvalue | p.adjust | qvalue | Count |
| Page: 1 |
Top |
Cell-cell communication analysis |
| Identification of potential cell-cell interactions between two cell types and their ligand-receptor pairs for different disease states |
| Ligand | Receptor | LRpair | Pathway | Tissue | Disease Stage |
| Page: 1 |
Top |
Single-cell gene regulatory network inference analysis |
| Find out the significant the regulons (TFs) and the target genes of each regulon across cell types for different disease states |
| TF | Cell Type | Tissue | Disease Stage | Target Gene | RSS | Regulon Activity |
| ∗The dot plots of a searched regulon are shown for all cell subpopulations in each disease state of each tissue based on the regulon specific score inferred using pySCENIC and by calculating the average expression. |
| Page: 1 |
Top |
Somatic mutation of malignant transformation related genes |
| Annotation of somatic variants for genes involved in malignant transformation |
| Hugo Symbol | Variant Class | Variant Classification | dbSNP RS | HGVSc | HGVSp | HGVSp Short | SWISSPROT | BIOTYPE | SIFT | PolyPhen | Tumor Sample Barcode | Tissue | Histology | Sex | Age | Stage | Therapy Types | Drugs | Outcome |
| MEX3D | SNV | Missense_Mutation | c.579G>C | p.Glu193Asp | p.E193D | Q86XN8 | protein_coding | deleterious(0.01) | probably_damaging(0.999) | TCGA-EK-A3GK-01 | Cervix | cervical & endocervical cancer | Female | <65 | I/II | Unknown | Unknown | SD | |
| MEX3D | SNV | Missense_Mutation | novel | c.665N>T | p.Pro222Leu | p.P222L | Q86XN8 | protein_coding | deleterious(0) | probably_damaging(0.999) | TCGA-ZX-AA5X-01 | Cervix | cervical & endocervical cancer | Female | <65 | III/IV | Unknown | Unknown | SD |
| MEX3D | SNV | Missense_Mutation | novel | c.1738G>A | p.Ala580Thr | p.A580T | Q86XN8 | protein_coding | tolerated(0.18) | benign(0.007) | TCGA-5M-AAT6-01 | Colorectum | colon adenocarcinoma | Female | <65 | III/IV | Unknown | Unknown | PD |
| MEX3D | SNV | Missense_Mutation | rs755620730 | c.1051N>A | p.Asp351Asn | p.D351N | Q86XN8 | protein_coding | deleterious(0.01) | benign(0.125) | TCGA-A6-6780-01 | Colorectum | colon adenocarcinoma | Male | >=65 | I/II | Unknown | Unknown | SD |
| MEX3D | SNV | Missense_Mutation | novel | c.1438N>A | p.Ala480Thr | p.A480T | Q86XN8 | protein_coding | tolerated(0.41) | benign(0.009) | TCGA-WS-AB45-01 | Colorectum | colon adenocarcinoma | Female | <65 | I/II | Unknown | Unknown | SD |
| MEX3D | SNV | Missense_Mutation | c.682N>A | p.Gly228Ser | p.G228S | Q86XN8 | protein_coding | deleterious(0.04) | probably_damaging(0.994) | TCGA-DC-4745-01 | Colorectum | rectum adenocarcinoma | Female | <65 | III/IV | Chemotherapy | 5-fluorouracil | SD | |
| MEX3D | SNV | Missense_Mutation | novel | c.634N>C | p.Tyr212His | p.Y212H | Q86XN8 | protein_coding | deleterious(0.01) | probably_damaging(0.999) | TCGA-D1-A175-01 | Endometrium | uterine corpus endometrioid carcinoma | Female | <65 | I/II | Chemotherapy | paclitaxel | SD |
| MEX3D | SNV | Missense_Mutation | novel | c.869G>A | p.Gly290Glu | p.G290E | Q86XN8 | protein_coding | deleterious(0) | probably_damaging(1) | TCGA-D1-A1NZ-01 | Endometrium | uterine corpus endometrioid carcinoma | Female | <65 | I/II | Unknown | Unknown | SD |
| MEX3D | SNV | Missense_Mutation | novel | c.652N>T | p.Arg218Trp | p.R218W | Q86XN8 | protein_coding | deleterious(0) | probably_damaging(1) | TCGA-DF-A2KU-01 | Endometrium | uterine corpus endometrioid carcinoma | Female | Unknown | I/II | Unknown | Unknown | SD |
| MEX3D | SNV | Missense_Mutation | novel | c.935N>A | p.Arg312His | p.R312H | Q86XN8 | protein_coding | deleterious(0.03) | probably_damaging(0.957) | TCGA-EO-A3KX-01 | Endometrium | uterine corpus endometrioid carcinoma | Female | >=65 | I/II | Unknown | Unknown | SD |
| Page: 1 2 3 |
Top |
Related drugs of malignant transformation related genes |
| Identification of chemicals and drugs interact with genes involved in malignant transfromation |
| (DGIdb 4.0) |
| Entrez ID | Symbol | Category | Interaction Types | Drug Claim Name | Drug Name | PMIDs |
| Page: 1 |

Copyright 2023-Present -The University of Texas Health Science Center at Houston |