
|
|||||
|
 | |
| |
| |
| |
| |
| |
|
Gene: METTL16 |
Gene summary for METTL16 |
| Gene information | Species | Human | Gene symbol | METTL16 | Gene ID | 79066 |
| Gene name | methyltransferase 16, N6-methyladenosine | |
| Gene Alias | METT10D | |
| Cytomap | 17p13.3 | |
| Gene Type | protein-coding | GO ID | GO:0000154 | UniProtAcc | Q86W50 |
Top |
Malignant transformation analysis |
| Identification of the aberrant gene expression in precancerous and cancerous lesions by comparing the gene expression of stem-like cells in diseased tissues with normal stem cells |
| Entrez ID | Symbol | Replicates | Species | Organ | Tissue | Adj P-value | Log2FC | Malignancy |
| 79066 | METTL16 | LZE4T | Human | Esophagus | ESCC | 3.91e-09 | 2.55e-01 | 0.0811 |
| 79066 | METTL16 | LZE5T | Human | Esophagus | ESCC | 6.11e-03 | 2.27e-01 | 0.0514 |
| 79066 | METTL16 | LZE7T | Human | Esophagus | ESCC | 2.37e-07 | 2.48e-01 | 0.0667 |
| 79066 | METTL16 | LZE8T | Human | Esophagus | ESCC | 1.46e-02 | 1.58e-01 | 0.067 |
| 79066 | METTL16 | LZE24T | Human | Esophagus | ESCC | 3.91e-10 | 3.44e-01 | 0.0596 |
| 79066 | METTL16 | P1T-E | Human | Esophagus | ESCC | 1.49e-10 | 3.45e-01 | 0.0875 |
| 79066 | METTL16 | P2T-E | Human | Esophagus | ESCC | 3.00e-21 | 3.36e-01 | 0.1177 |
| 79066 | METTL16 | P4T-E | Human | Esophagus | ESCC | 2.28e-13 | 3.68e-01 | 0.1323 |
| 79066 | METTL16 | P5T-E | Human | Esophagus | ESCC | 2.27e-06 | 1.47e-01 | 0.1327 |
| 79066 | METTL16 | P8T-E | Human | Esophagus | ESCC | 1.57e-10 | 2.38e-01 | 0.0889 |
| 79066 | METTL16 | P9T-E | Human | Esophagus | ESCC | 3.51e-08 | 1.94e-01 | 0.1131 |
| 79066 | METTL16 | P10T-E | Human | Esophagus | ESCC | 4.55e-15 | 2.66e-01 | 0.116 |
| 79066 | METTL16 | P11T-E | Human | Esophagus | ESCC | 1.05e-07 | 3.23e-01 | 0.1426 |
| 79066 | METTL16 | P12T-E | Human | Esophagus | ESCC | 2.38e-18 | 4.52e-01 | 0.1122 |
| 79066 | METTL16 | P15T-E | Human | Esophagus | ESCC | 5.68e-08 | 2.05e-01 | 0.1149 |
| 79066 | METTL16 | P16T-E | Human | Esophagus | ESCC | 4.02e-30 | 4.83e-01 | 0.1153 |
| 79066 | METTL16 | P20T-E | Human | Esophagus | ESCC | 2.98e-10 | 2.43e-01 | 0.1124 |
| 79066 | METTL16 | P21T-E | Human | Esophagus | ESCC | 5.34e-18 | 2.97e-01 | 0.1617 |
| 79066 | METTL16 | P22T-E | Human | Esophagus | ESCC | 1.14e-16 | 2.61e-01 | 0.1236 |
| 79066 | METTL16 | P23T-E | Human | Esophagus | ESCC | 5.06e-10 | 3.09e-01 | 0.108 |
| Page: 1 2 3 4 |
| Tissue | Expression Dynamics | Abbreviation |
| Esophagus | 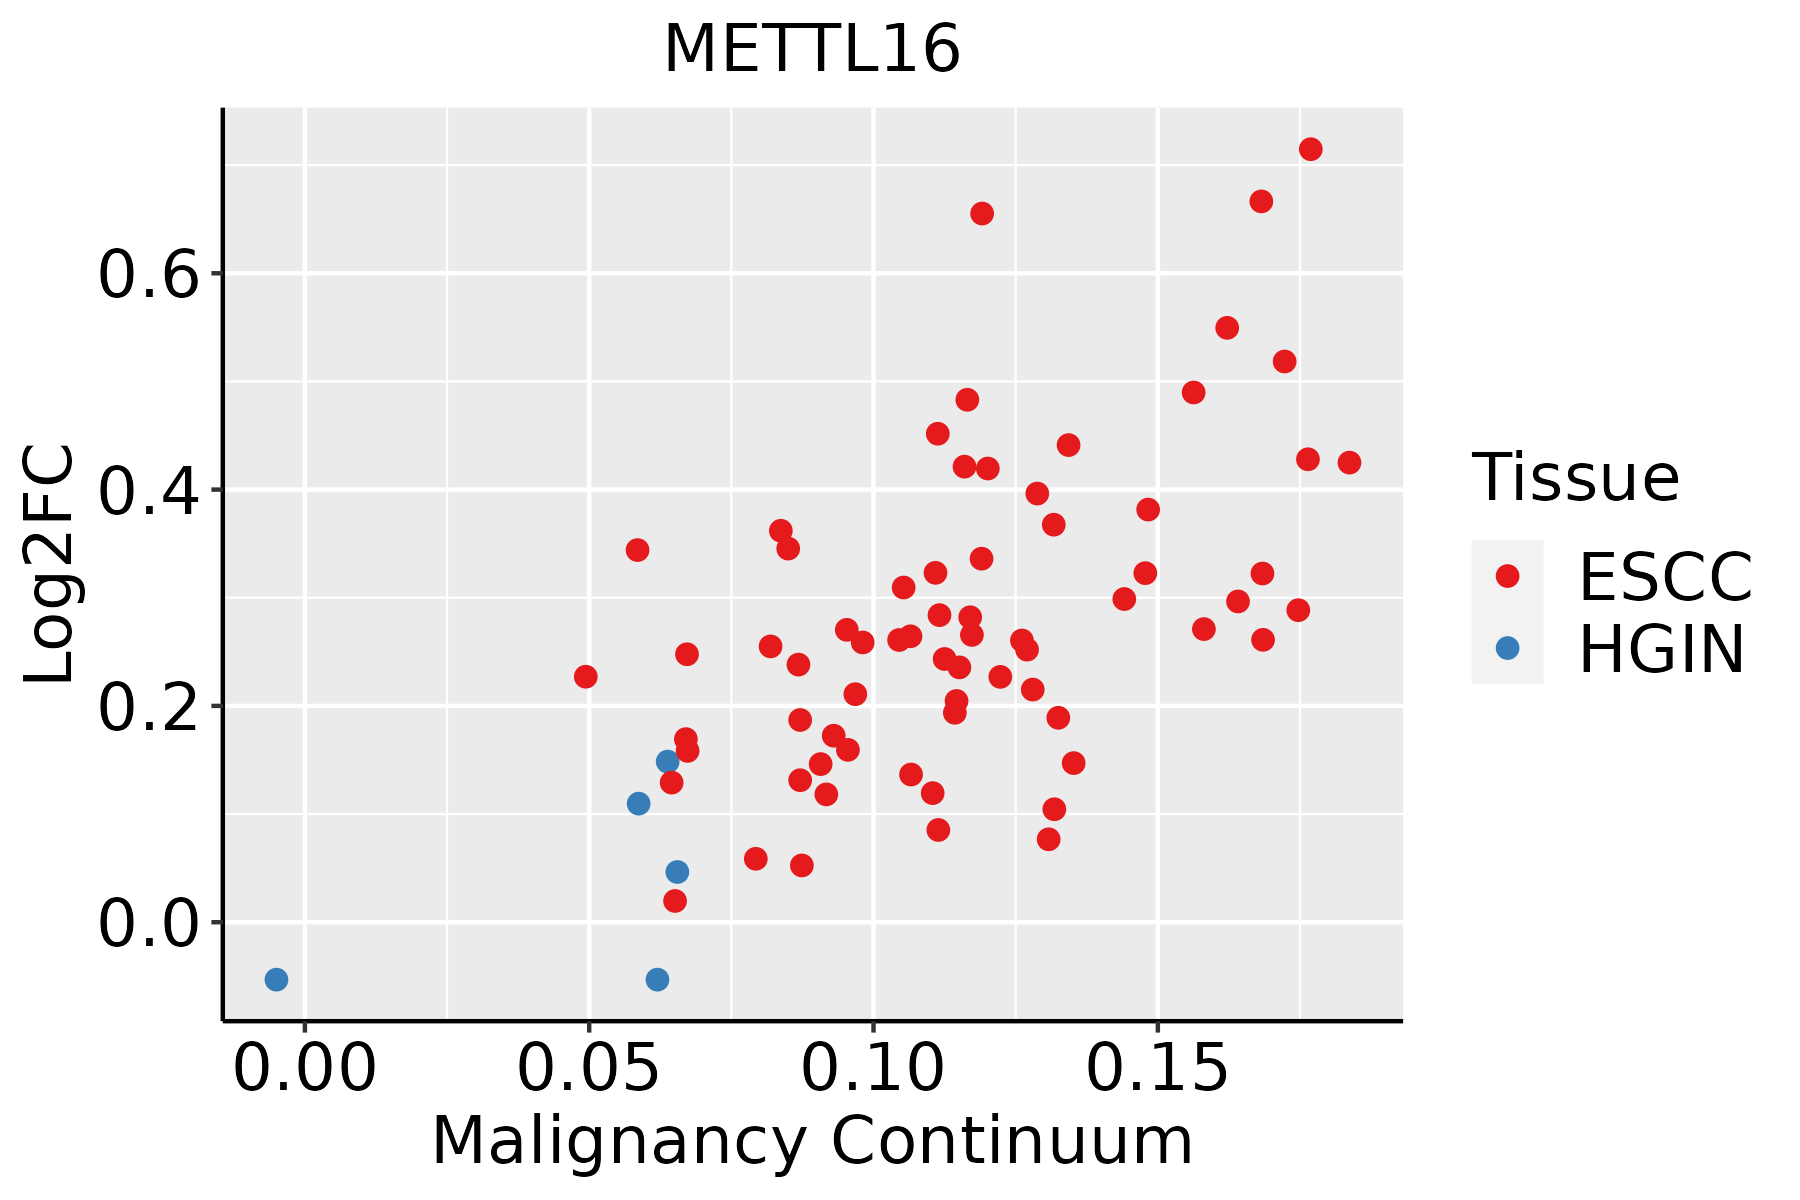 | ESCC: Esophageal squamous cell carcinoma |
| HGIN: High-grade intraepithelial neoplasias | ||
| LGIN: Low-grade intraepithelial neoplasias | ||
| Liver | 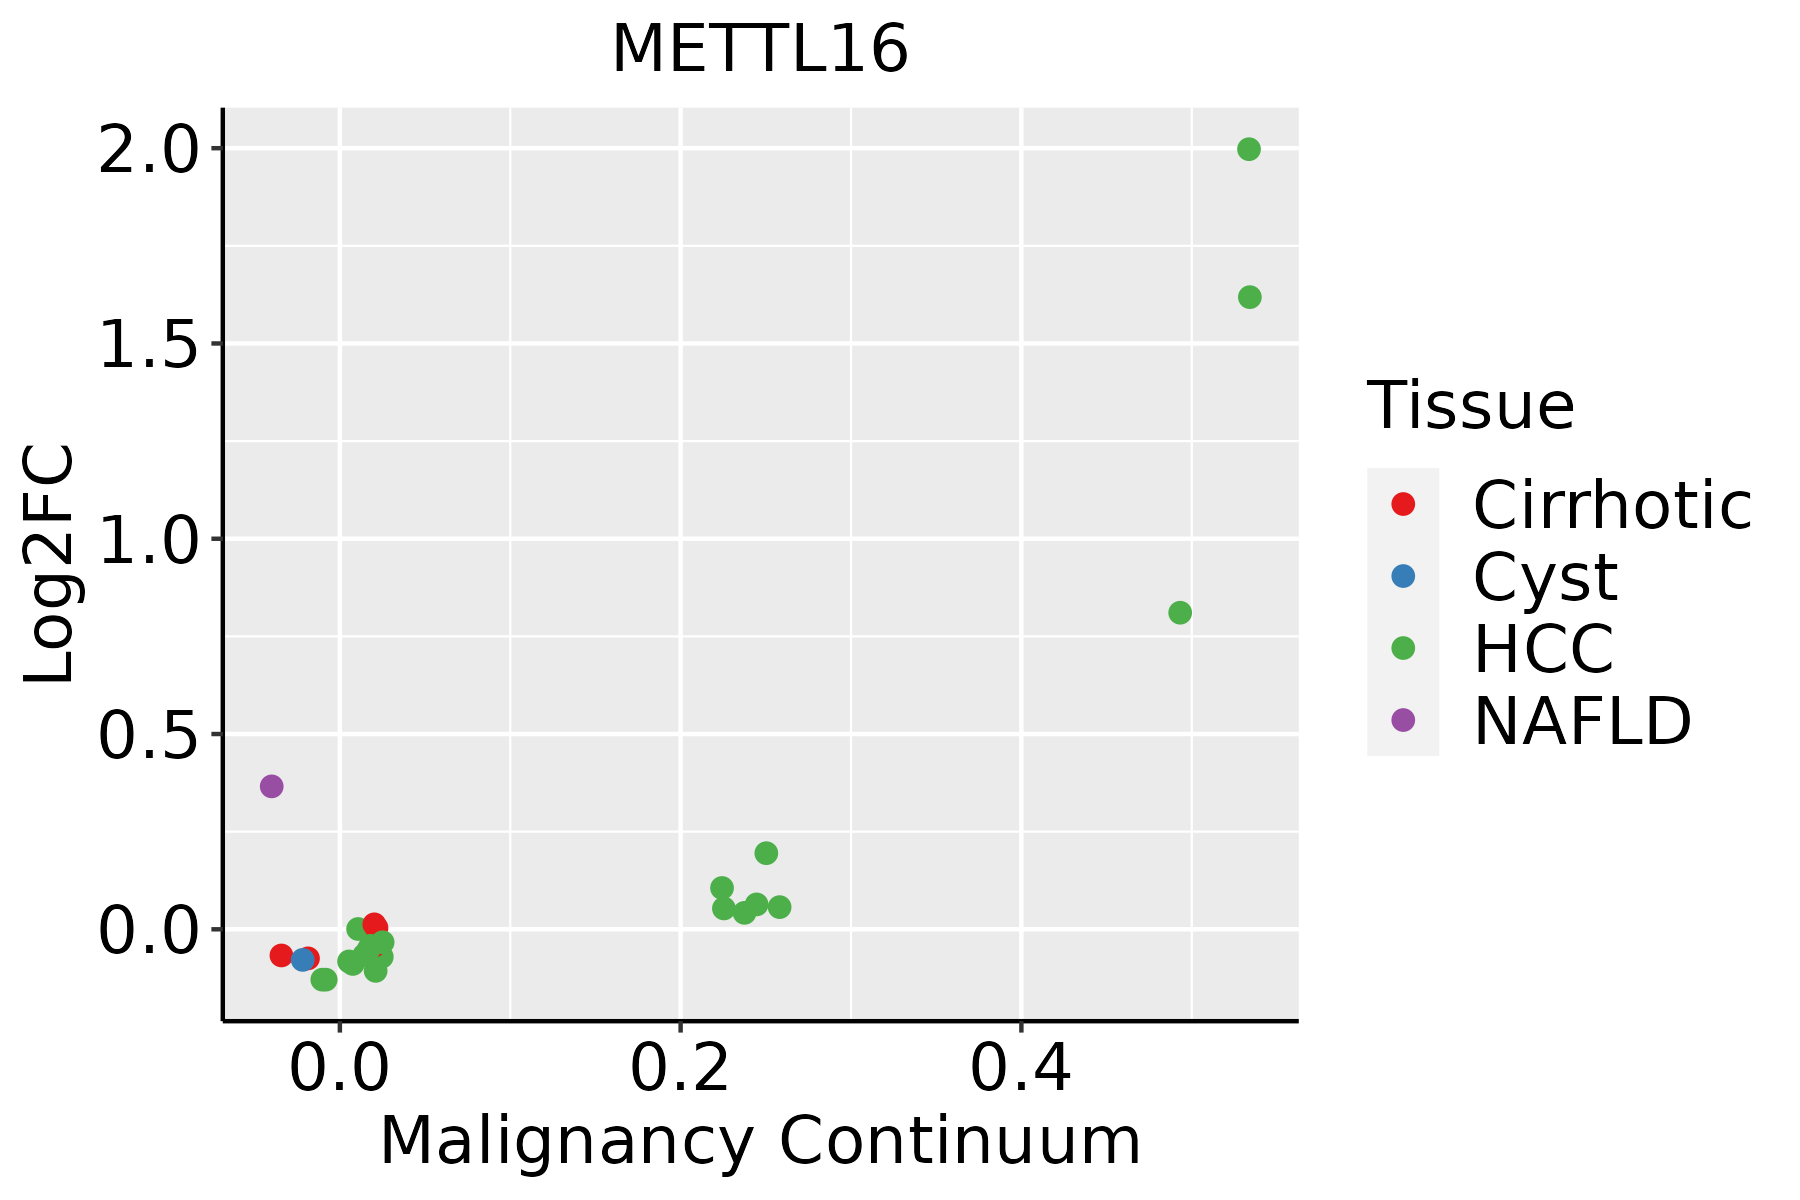 | HCC: Hepatocellular carcinoma |
| NAFLD: Non-alcoholic fatty liver disease | ||
| Lung | 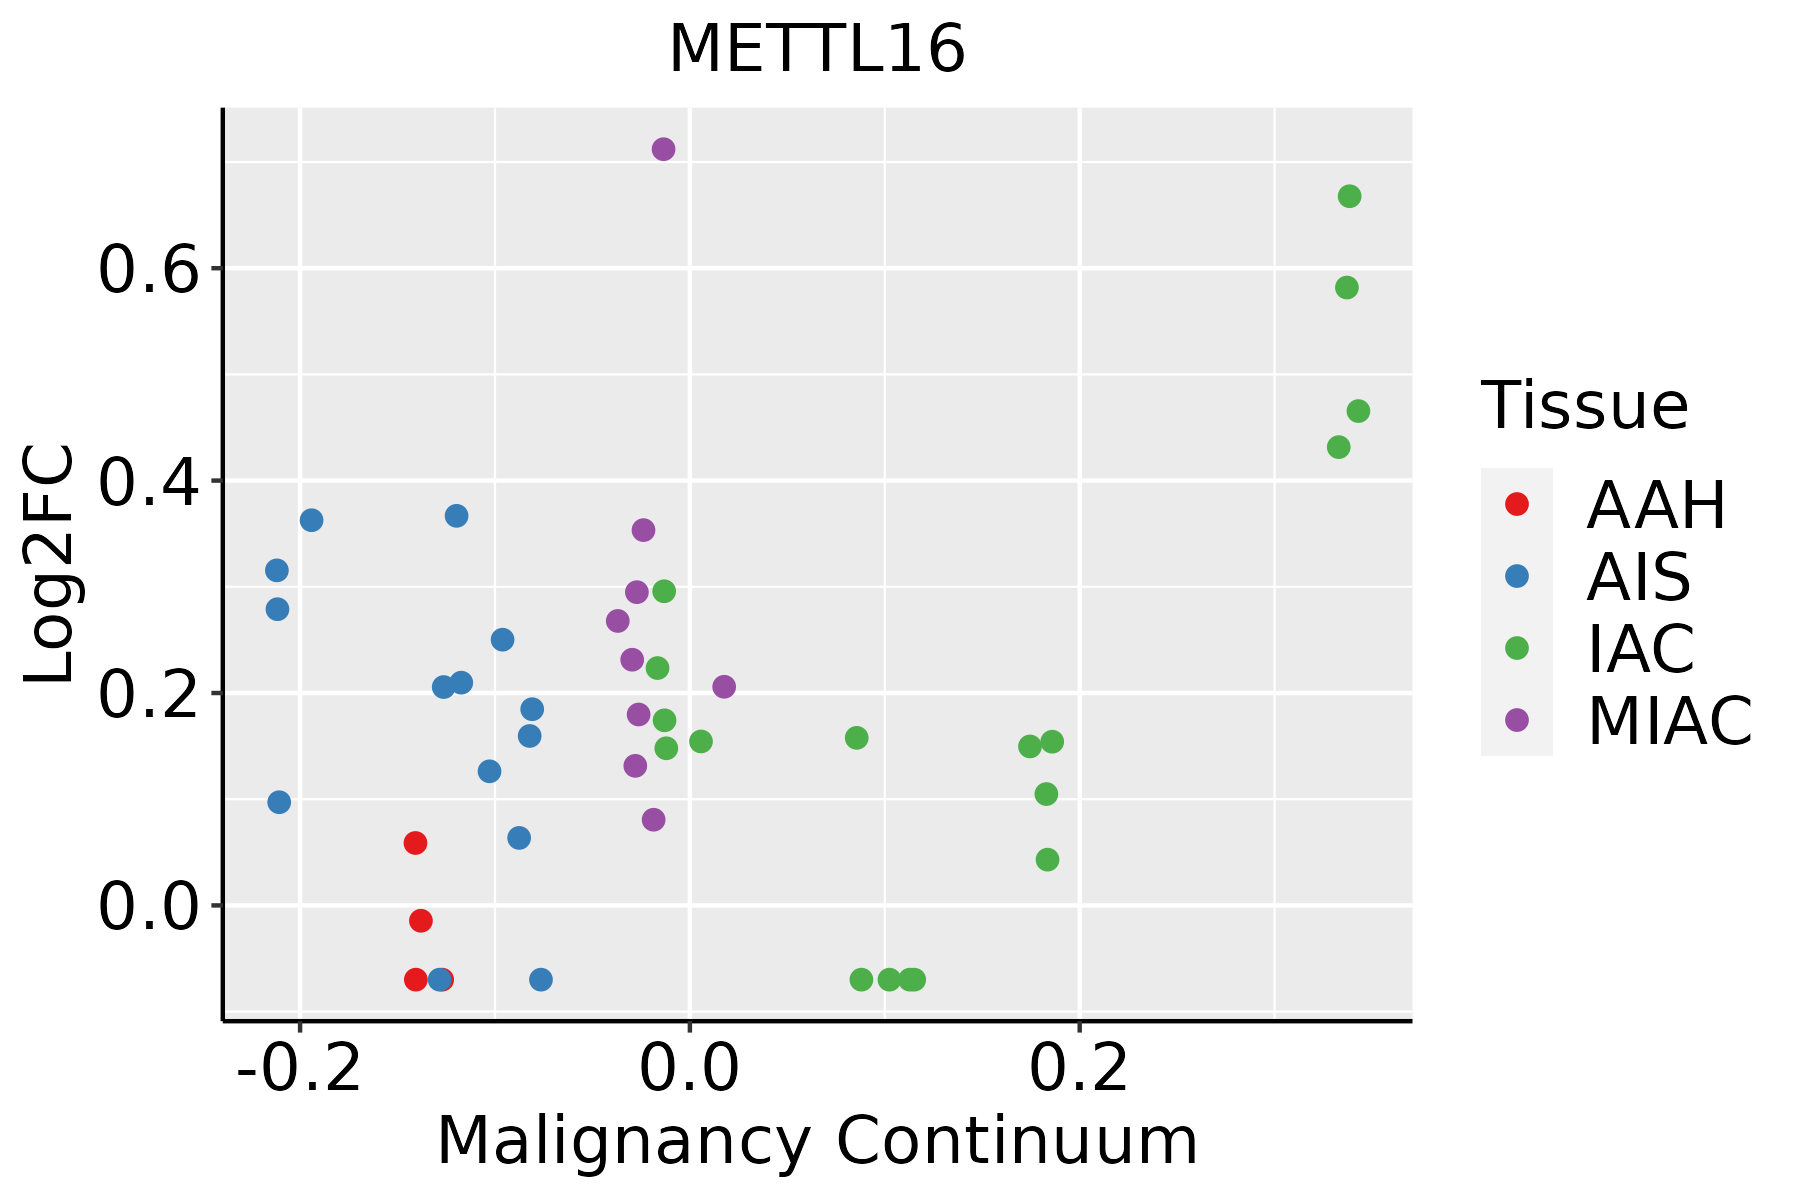 | AAH: Atypical adenomatous hyperplasia |
| AIS: Adenocarcinoma in situ | ||
| IAC: Invasive lung adenocarcinoma | ||
| MIA: Minimally invasive adenocarcinoma |
| ∗log2FC in expression of this searched gene in stem-like cells from each diseased tissue sample relative to stem-like cells in normal samples in each tissue plotted against the malignancy continuum. Samples are colored based on if they are from different disease stage. |
Top |
Malignant transformation related pathway analysis |
| Find out the enriched GO biological processes and KEGG pathways involved in transition from healthy to precancer to cancer |
| Tissue | Disease Stage | Enriched GO biological Processes |
| Colorectum | AD |  |
| Colorectum | SER |  |
| Colorectum | MSS |  |
| Colorectum | MSI-H |  |
| Colorectum | FAP |  |
| ∗Top 15 enriched GO BP terms are showed in the bar plot of each disease state in each tissue. Each row represents a significant GO biological process which is colored according to the -log10(p.adjust). |
| Page: 1 2 3 4 5 6 7 8 9 |
| GO ID | Tissue | Disease Stage | Description | Gene Ratio | Bg Ratio | pvalue | p.adjust | Count |
| GO:00434876 | Liver | NAFLD | regulation of RNA stability | 40/1882 | 170/18723 | 2.32e-07 | 1.58e-05 | 40 |
| GO:00434847 | Liver | NAFLD | regulation of RNA splicing | 35/1882 | 148/18723 | 1.14e-06 | 5.55e-05 | 35 |
| GO:00506846 | Liver | NAFLD | regulation of mRNA processing | 33/1882 | 137/18723 | 1.47e-06 | 6.73e-05 | 33 |
| GO:00610144 | Liver | NAFLD | positive regulation of mRNA catabolic process | 24/1882 | 87/18723 | 3.17e-06 | 1.27e-04 | 24 |
| GO:00480247 | Liver | NAFLD | regulation of mRNA splicing, via spliceosome | 26/1882 | 101/18723 | 5.10e-06 | 1.89e-04 | 26 |
| GO:00611574 | Liver | NAFLD | mRNA destabilization | 23/1882 | 84/18723 | 5.79e-06 | 2.05e-04 | 23 |
| GO:00226137 | Liver | NAFLD | ribonucleoprotein complex biogenesis | 76/1882 | 463/18723 | 1.19e-05 | 3.67e-04 | 76 |
| GO:19033134 | Liver | NAFLD | positive regulation of mRNA metabolic process | 28/1882 | 118/18723 | 1.21e-05 | 3.70e-04 | 28 |
| GO:00507794 | Liver | NAFLD | RNA destabilization | 23/1882 | 88/18723 | 1.34e-05 | 3.97e-04 | 23 |
| GO:00067904 | Liver | NAFLD | sulfur compound metabolic process | 58/1882 | 339/18723 | 3.79e-05 | 9.38e-04 | 58 |
| GO:00083807 | Liver | NAFLD | RNA splicing | 70/1882 | 434/18723 | 4.62e-05 | 1.10e-03 | 70 |
| GO:00422547 | Liver | NAFLD | ribosome biogenesis | 52/1882 | 299/18723 | 6.03e-05 | 1.32e-03 | 52 |
| GO:00171483 | Liver | NAFLD | negative regulation of translation | 43/1882 | 245/18723 | 2.05e-04 | 3.56e-03 | 43 |
| GO:19033127 | Liver | NAFLD | negative regulation of mRNA metabolic process | 21/1882 | 92/18723 | 2.56e-04 | 4.17e-03 | 21 |
| GO:00342493 | Liver | NAFLD | negative regulation of cellular amide metabolic process | 46/1882 | 273/18723 | 3.27e-04 | 5.04e-03 | 46 |
| GO:19023695 | Liver | NAFLD | negative regulation of RNA catabolic process | 18/1882 | 75/18723 | 3.60e-04 | 5.42e-03 | 18 |
| GO:00003777 | Liver | NAFLD | RNA splicing, via transesterification reactions with bulged adenosine as nucleophile | 51/1882 | 320/18723 | 6.21e-04 | 8.18e-03 | 51 |
| GO:00003987 | Liver | NAFLD | mRNA splicing, via spliceosome | 51/1882 | 320/18723 | 6.21e-04 | 8.18e-03 | 51 |
| GO:0044272 | Liver | NAFLD | sulfur compound biosynthetic process | 28/1882 | 148/18723 | 7.52e-04 | 9.52e-03 | 28 |
| GO:00003757 | Liver | NAFLD | RNA splicing, via transesterification reactions | 51/1882 | 324/18723 | 8.28e-04 | 1.02e-02 | 51 |
| Page: 1 2 3 4 5 6 7 8 9 10 |
| Pathway ID | Tissue | Disease Stage | Description | Gene Ratio | Bg Ratio | pvalue | p.adjust | qvalue | Count |
| Page: 1 |
Top |
Cell-cell communication analysis |
| Identification of potential cell-cell interactions between two cell types and their ligand-receptor pairs for different disease states |
| Ligand | Receptor | LRpair | Pathway | Tissue | Disease Stage |
| Page: 1 |
Top |
Single-cell gene regulatory network inference analysis |
| Find out the significant the regulons (TFs) and the target genes of each regulon across cell types for different disease states |
| TF | Cell Type | Tissue | Disease Stage | Target Gene | RSS | Regulon Activity |
| ∗The dot plots of a searched regulon are shown for all cell subpopulations in each disease state of each tissue based on the regulon specific score inferred using pySCENIC and by calculating the average expression. |
| Page: 1 |
Top |
Somatic mutation of malignant transformation related genes |
| Annotation of somatic variants for genes involved in malignant transformation |
| Hugo Symbol | Variant Class | Variant Classification | dbSNP RS | HGVSc | HGVSp | HGVSp Short | SWISSPROT | BIOTYPE | SIFT | PolyPhen | Tumor Sample Barcode | Tissue | Histology | Sex | Age | Stage | Therapy Types | Drugs | Outcome |
| METTL16 | SNV | Missense_Mutation | c.706N>G | p.Leu236Val | p.L236V | Q86W50 | protein_coding | tolerated(0.1) | possibly_damaging(0.739) | TCGA-AC-A23H-01 | Breast | breast invasive carcinoma | Female | >=65 | I/II | Unknown | Unknown | PD | |
| METTL16 | insertion | In_Frame_Ins | novel | c.212_213insGGCTCACTGCAACCTCCGCCTCCCAGGTTCGAGCGA | p.Pro71_Leu72insAlaHisCysAsnLeuArgLeuProGlySerSerGlu | p.P71_L72insAHCNLRLPGSSE | Q86W50 | protein_coding | TCGA-AN-A0FN-01 | Breast | breast invasive carcinoma | Female | <65 | I/II | Unknown | Unknown | SD | ||
| METTL16 | SNV | Missense_Mutation | novel | c.217G>C | p.Glu73Gln | p.E73Q | Q86W50 | protein_coding | deleterious(0.01) | probably_damaging(0.968) | TCGA-JW-A5VL-01 | Cervix | cervical & endocervical cancer | Female | <65 | I/II | Unknown | Unknown | SD |
| METTL16 | SNV | Missense_Mutation | c.599N>A | p.Arg200Gln | p.R200Q | Q86W50 | protein_coding | deleterious(0) | probably_damaging(0.994) | TCGA-AA-3977-01 | Colorectum | colon adenocarcinoma | Male | >=65 | I/II | Unknown | Unknown | SD | |
| METTL16 | SNV | Missense_Mutation | c.851C>T | p.Ala284Val | p.A284V | Q86W50 | protein_coding | tolerated(0.06) | benign(0.057) | TCGA-AA-A010-01 | Colorectum | colon adenocarcinoma | Female | <65 | I/II | Chemotherapy | folinic | CR | |
| METTL16 | SNV | Missense_Mutation | c.1262N>T | p.Glu421Val | p.E421V | Q86W50 | protein_coding | deleterious_low_confidence(0.02) | benign(0.078) | TCGA-DM-A28H-01 | Colorectum | colon adenocarcinoma | Male | <65 | III/IV | Unknown | Unknown | PD | |
| METTL16 | SNV | Missense_Mutation | novel | c.929A>T | p.Lys310Ile | p.K310I | Q86W50 | protein_coding | deleterious(0) | possibly_damaging(0.818) | TCGA-G4-6295-01 | Colorectum | colon adenocarcinoma | Female | >=65 | I/II | Unknown | Unknown | SD |
| METTL16 | SNV | Missense_Mutation | c.1115N>T | p.Thr372Met | p.T372M | Q86W50 | protein_coding | deleterious(0.02) | probably_damaging(0.975) | TCGA-AG-3742-01 | Colorectum | rectum adenocarcinoma | Female | >=65 | I/II | Unknown | Unknown | SD | |
| METTL16 | SNV | Missense_Mutation | rs765971942 | c.767N>T | p.Ala256Val | p.A256V | Q86W50 | protein_coding | deleterious(0.01) | benign(0.274) | TCGA-AG-3892-01 | Colorectum | rectum adenocarcinoma | Female | <65 | I/II | Unknown | Unknown | SD |
| METTL16 | SNV | Missense_Mutation | c.599N>A | p.Arg200Gln | p.R200Q | Q86W50 | protein_coding | deleterious(0) | probably_damaging(0.994) | TCGA-AG-A002-01 | Colorectum | rectum adenocarcinoma | Male | <65 | I/II | Unknown | Unknown | SD |
| Page: 1 2 3 4 5 |
Top |
Related drugs of malignant transformation related genes |
| Identification of chemicals and drugs interact with genes involved in malignant transfromation |
| (DGIdb 4.0) |
| Entrez ID | Symbol | Category | Interaction Types | Drug Claim Name | Drug Name | PMIDs |
| Page: 1 |

Copyright 2023-Present -The University of Texas Health Science Center at Houston |