
|
|||||
|
 | |
| |
| |
| |
| |
| |
|
Gene: MED4 |
Gene summary for MED4 |
| Gene information | Species | Human | Gene symbol | MED4 | Gene ID | 29079 |
| Gene name | mediator complex subunit 4 | |
| Gene Alias | ARC36 | |
| Cytomap | 13q14.2 | |
| Gene Type | protein-coding | GO ID | GO:0006139 | UniProtAcc | Q9NPJ6 |
Top |
Malignant transformation analysis |
| Identification of the aberrant gene expression in precancerous and cancerous lesions by comparing the gene expression of stem-like cells in diseased tissues with normal stem cells |
| Entrez ID | Symbol | Replicates | Species | Organ | Tissue | Adj P-value | Log2FC | Malignancy |
| 29079 | MED4 | LZE4T | Human | Esophagus | ESCC | 7.93e-13 | 1.35e-01 | 0.0811 |
| 29079 | MED4 | LZE7T | Human | Esophagus | ESCC | 3.21e-06 | 2.27e-01 | 0.0667 |
| 29079 | MED4 | LZE8T | Human | Esophagus | ESCC | 2.95e-06 | 6.39e-02 | 0.067 |
| 29079 | MED4 | LZE20T | Human | Esophagus | ESCC | 3.18e-06 | 6.75e-02 | 0.0662 |
| 29079 | MED4 | LZE22D1 | Human | Esophagus | HGIN | 5.79e-05 | 7.09e-02 | 0.0595 |
| 29079 | MED4 | LZE22T | Human | Esophagus | ESCC | 1.08e-04 | 1.92e-01 | 0.068 |
| 29079 | MED4 | LZE24T | Human | Esophagus | ESCC | 8.26e-16 | 1.84e-01 | 0.0596 |
| 29079 | MED4 | LZE6T | Human | Esophagus | ESCC | 8.30e-05 | -4.12e-02 | 0.0845 |
| 29079 | MED4 | P1T-E | Human | Esophagus | ESCC | 1.18e-08 | 2.77e-01 | 0.0875 |
| 29079 | MED4 | P2T-E | Human | Esophagus | ESCC | 6.15e-20 | 4.66e-01 | 0.1177 |
| 29079 | MED4 | P4T-E | Human | Esophagus | ESCC | 6.84e-22 | 1.15e-01 | 0.1323 |
| 29079 | MED4 | P5T-E | Human | Esophagus | ESCC | 3.48e-09 | 1.02e-01 | 0.1327 |
| 29079 | MED4 | P8T-E | Human | Esophagus | ESCC | 8.58e-43 | 6.68e-01 | 0.0889 |
| 29079 | MED4 | P9T-E | Human | Esophagus | ESCC | 3.17e-17 | 3.14e-01 | 0.1131 |
| 29079 | MED4 | P10T-E | Human | Esophagus | ESCC | 6.93e-20 | 4.36e-01 | 0.116 |
| 29079 | MED4 | P11T-E | Human | Esophagus | ESCC | 8.81e-15 | 2.39e-01 | 0.1426 |
| 29079 | MED4 | P12T-E | Human | Esophagus | ESCC | 3.31e-23 | 4.38e-01 | 0.1122 |
| 29079 | MED4 | P15T-E | Human | Esophagus | ESCC | 5.61e-24 | 4.60e-01 | 0.1149 |
| 29079 | MED4 | P16T-E | Human | Esophagus | ESCC | 7.02e-24 | 5.31e-01 | 0.1153 |
| 29079 | MED4 | P17T-E | Human | Esophagus | ESCC | 9.56e-04 | 3.92e-01 | 0.1278 |
| Page: 1 2 3 4 5 6 |
| Tissue | Expression Dynamics | Abbreviation |
| Esophagus | 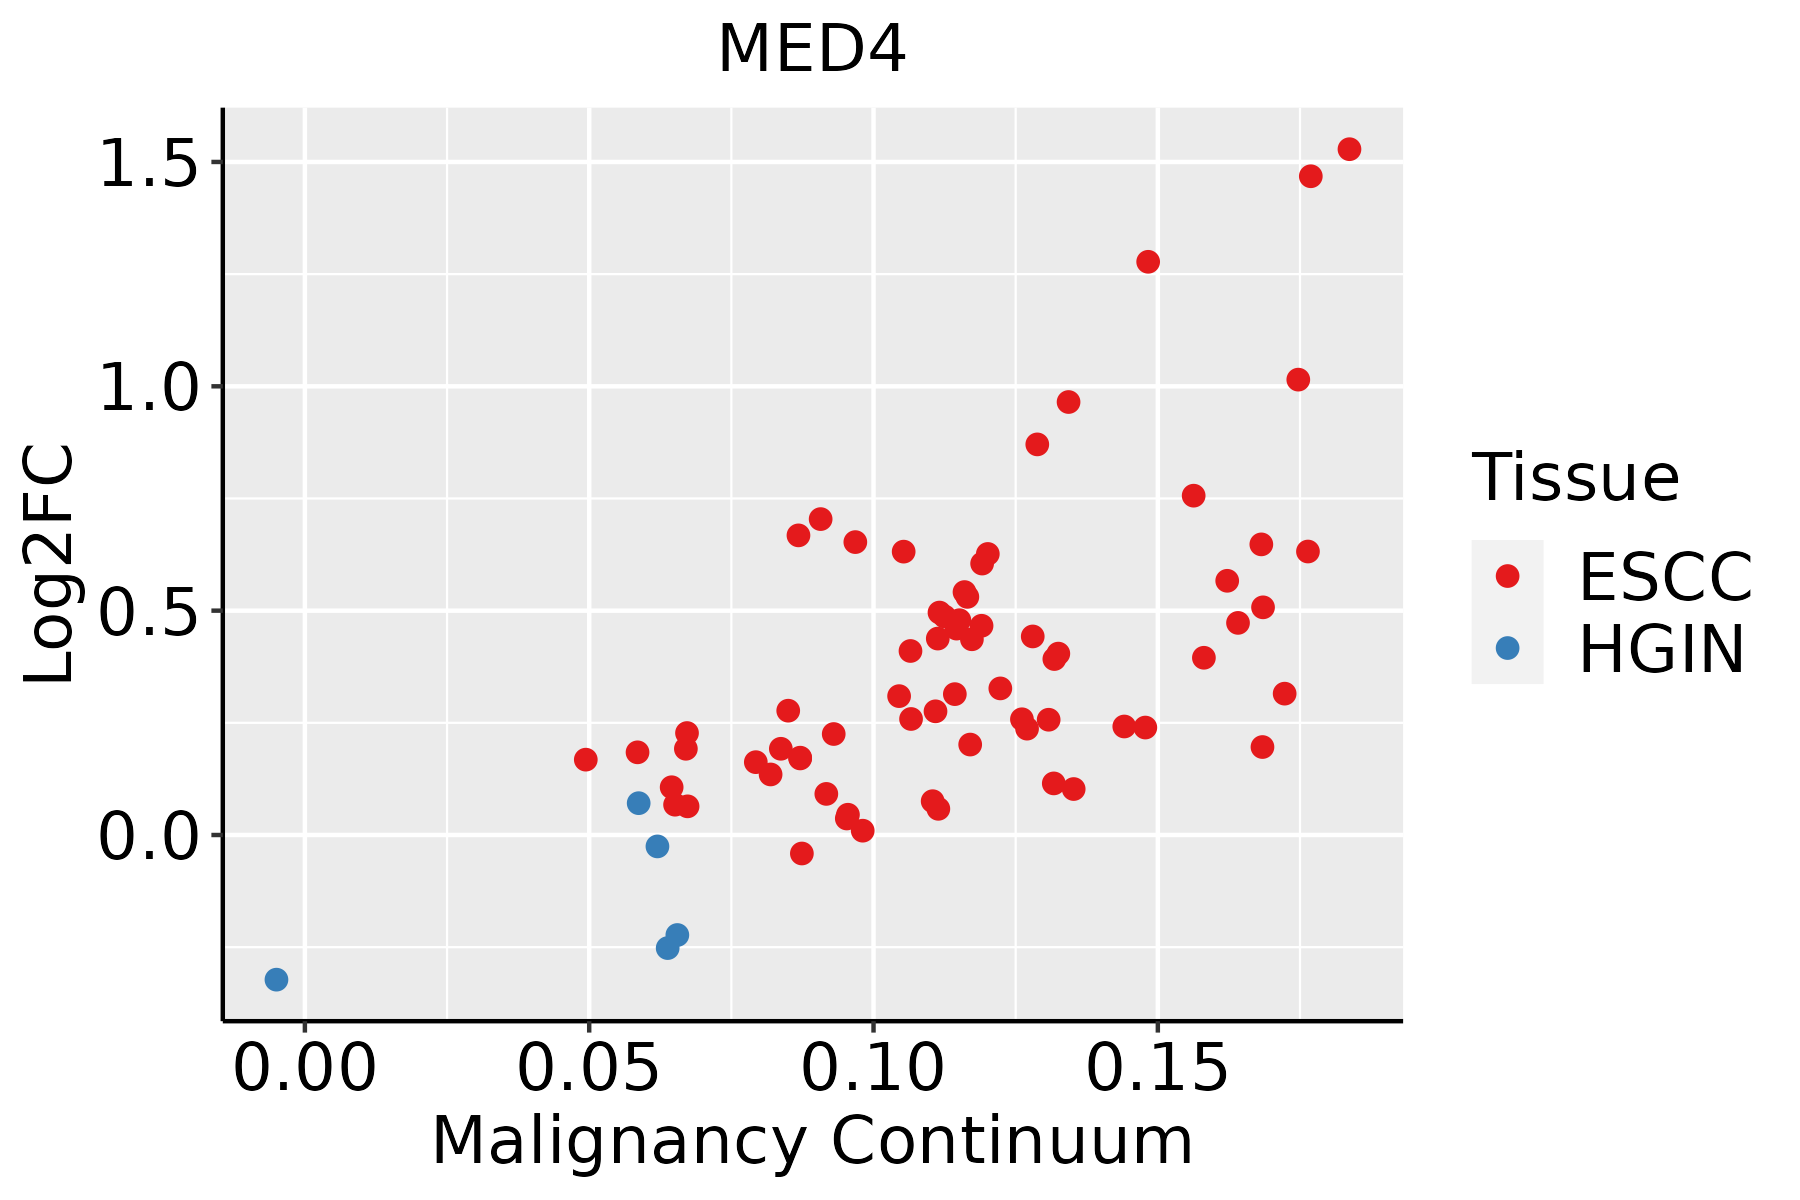 | ESCC: Esophageal squamous cell carcinoma |
| HGIN: High-grade intraepithelial neoplasias | ||
| LGIN: Low-grade intraepithelial neoplasias | ||
| Liver |  | HCC: Hepatocellular carcinoma |
| NAFLD: Non-alcoholic fatty liver disease | ||
| Oral Cavity | 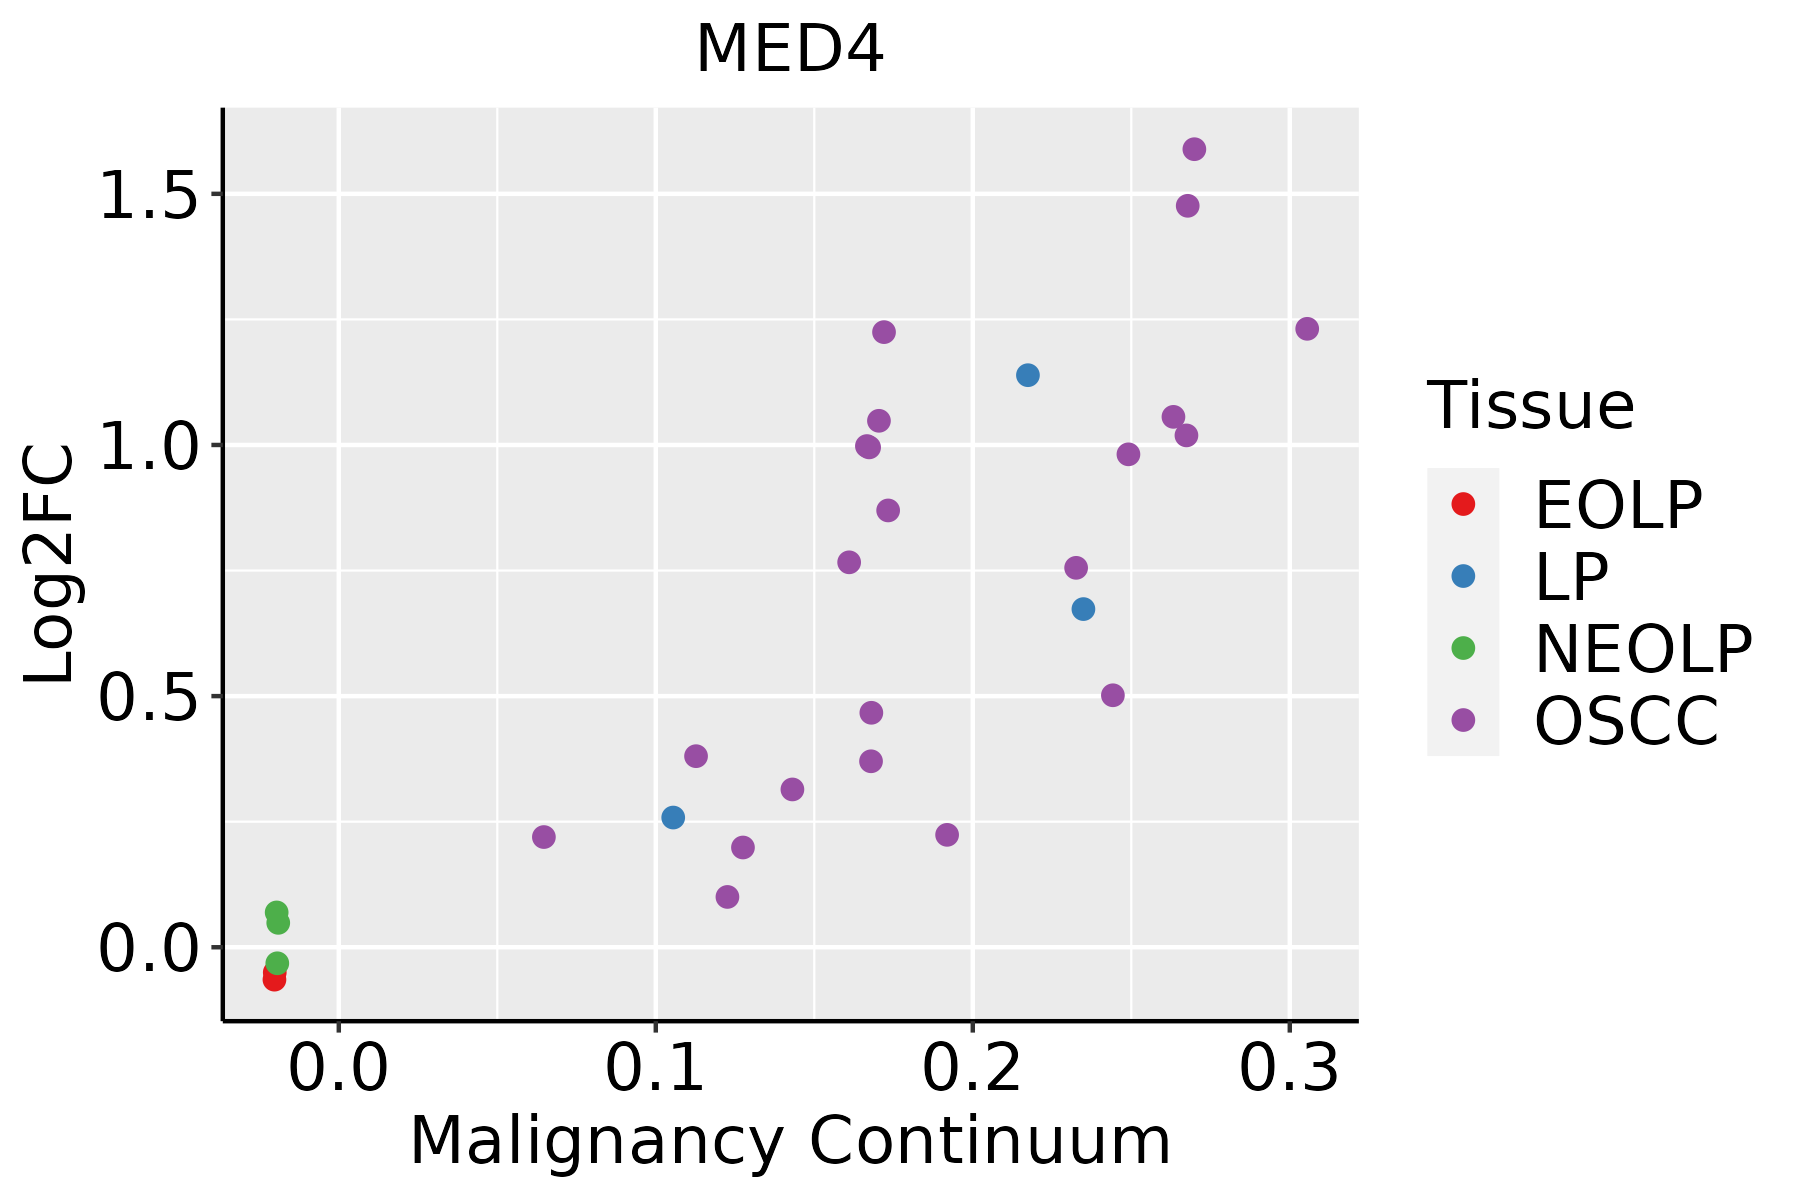 | EOLP: Erosive Oral lichen planus |
| LP: leukoplakia | ||
| NEOLP: Non-erosive oral lichen planus | ||
| OSCC: Oral squamous cell carcinoma | ||
| Skin | 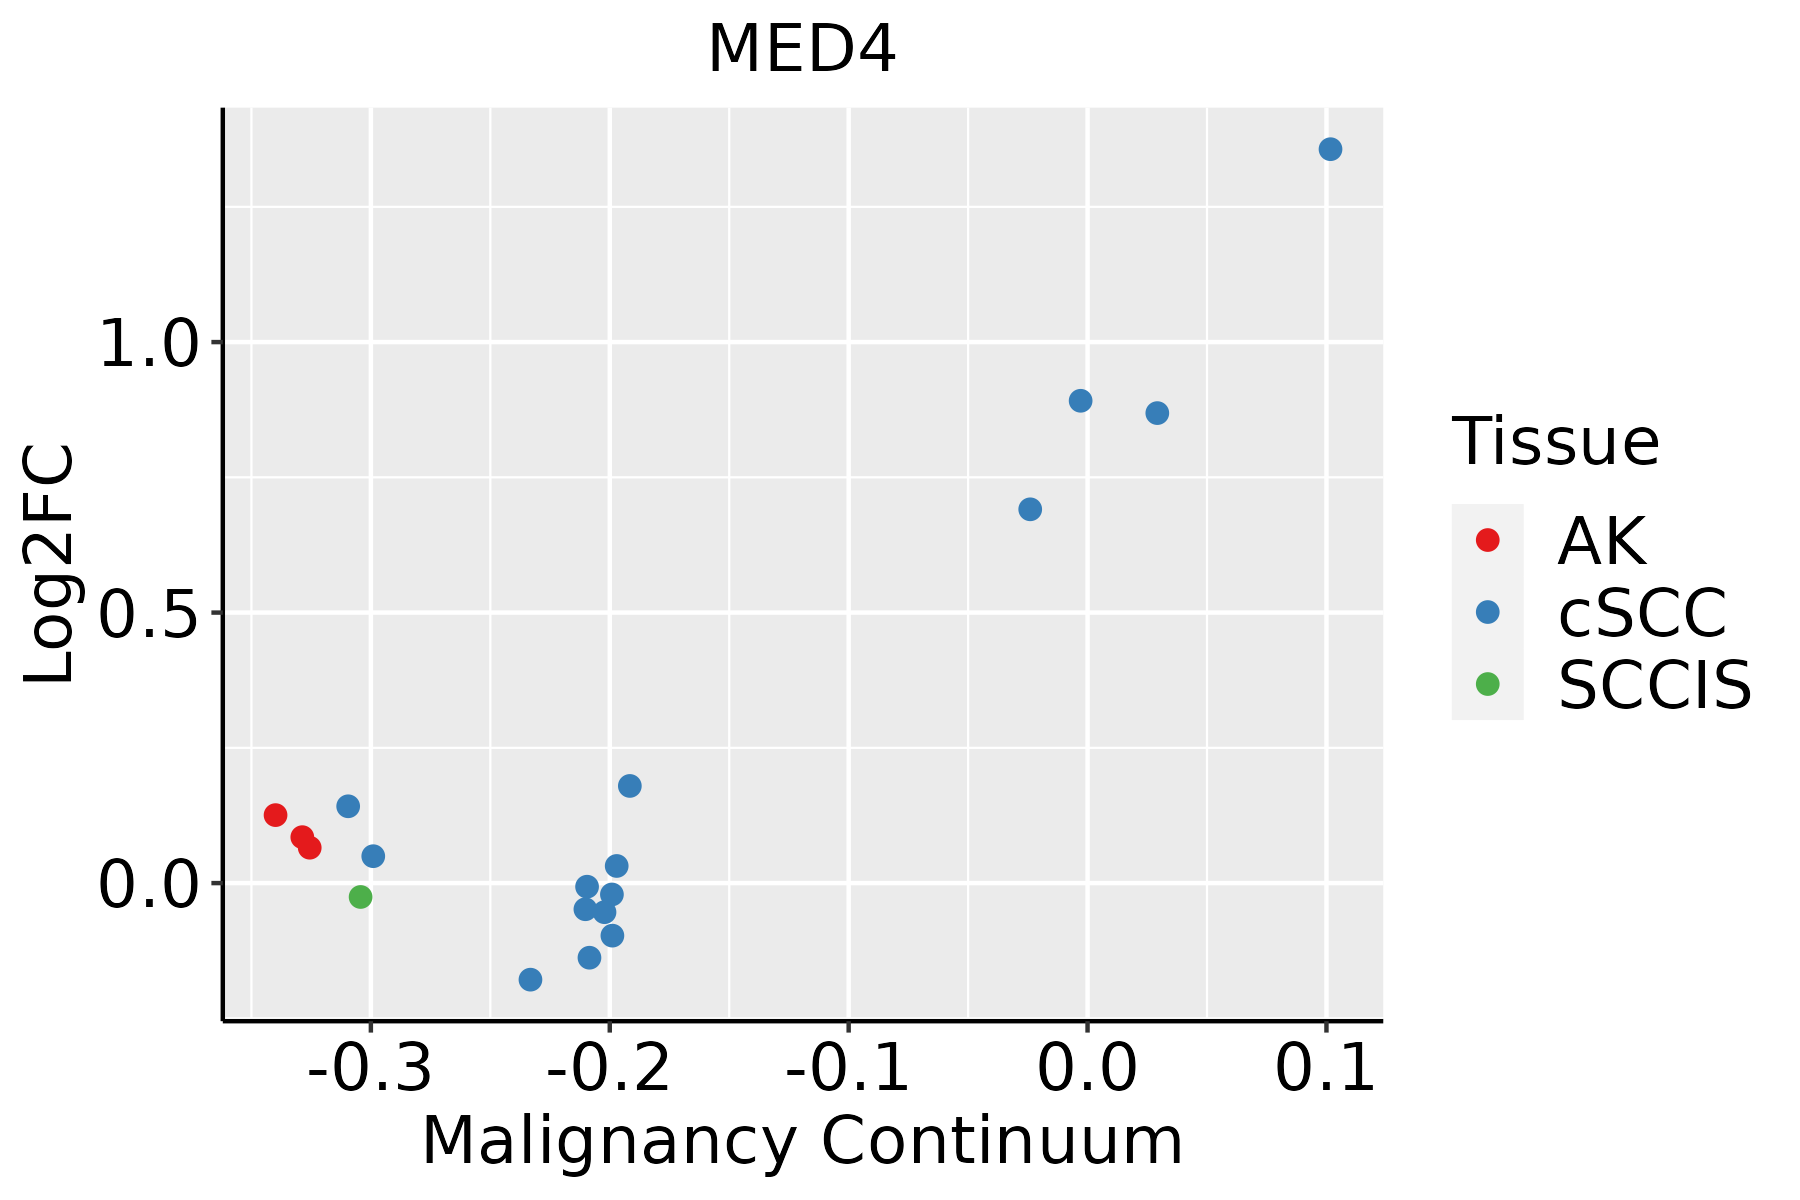 | AK: Actinic keratosis |
| cSCC: Cutaneous squamous cell carcinoma | ||
| SCCIS:squamous cell carcinoma in situ | ||
| Thyroid | 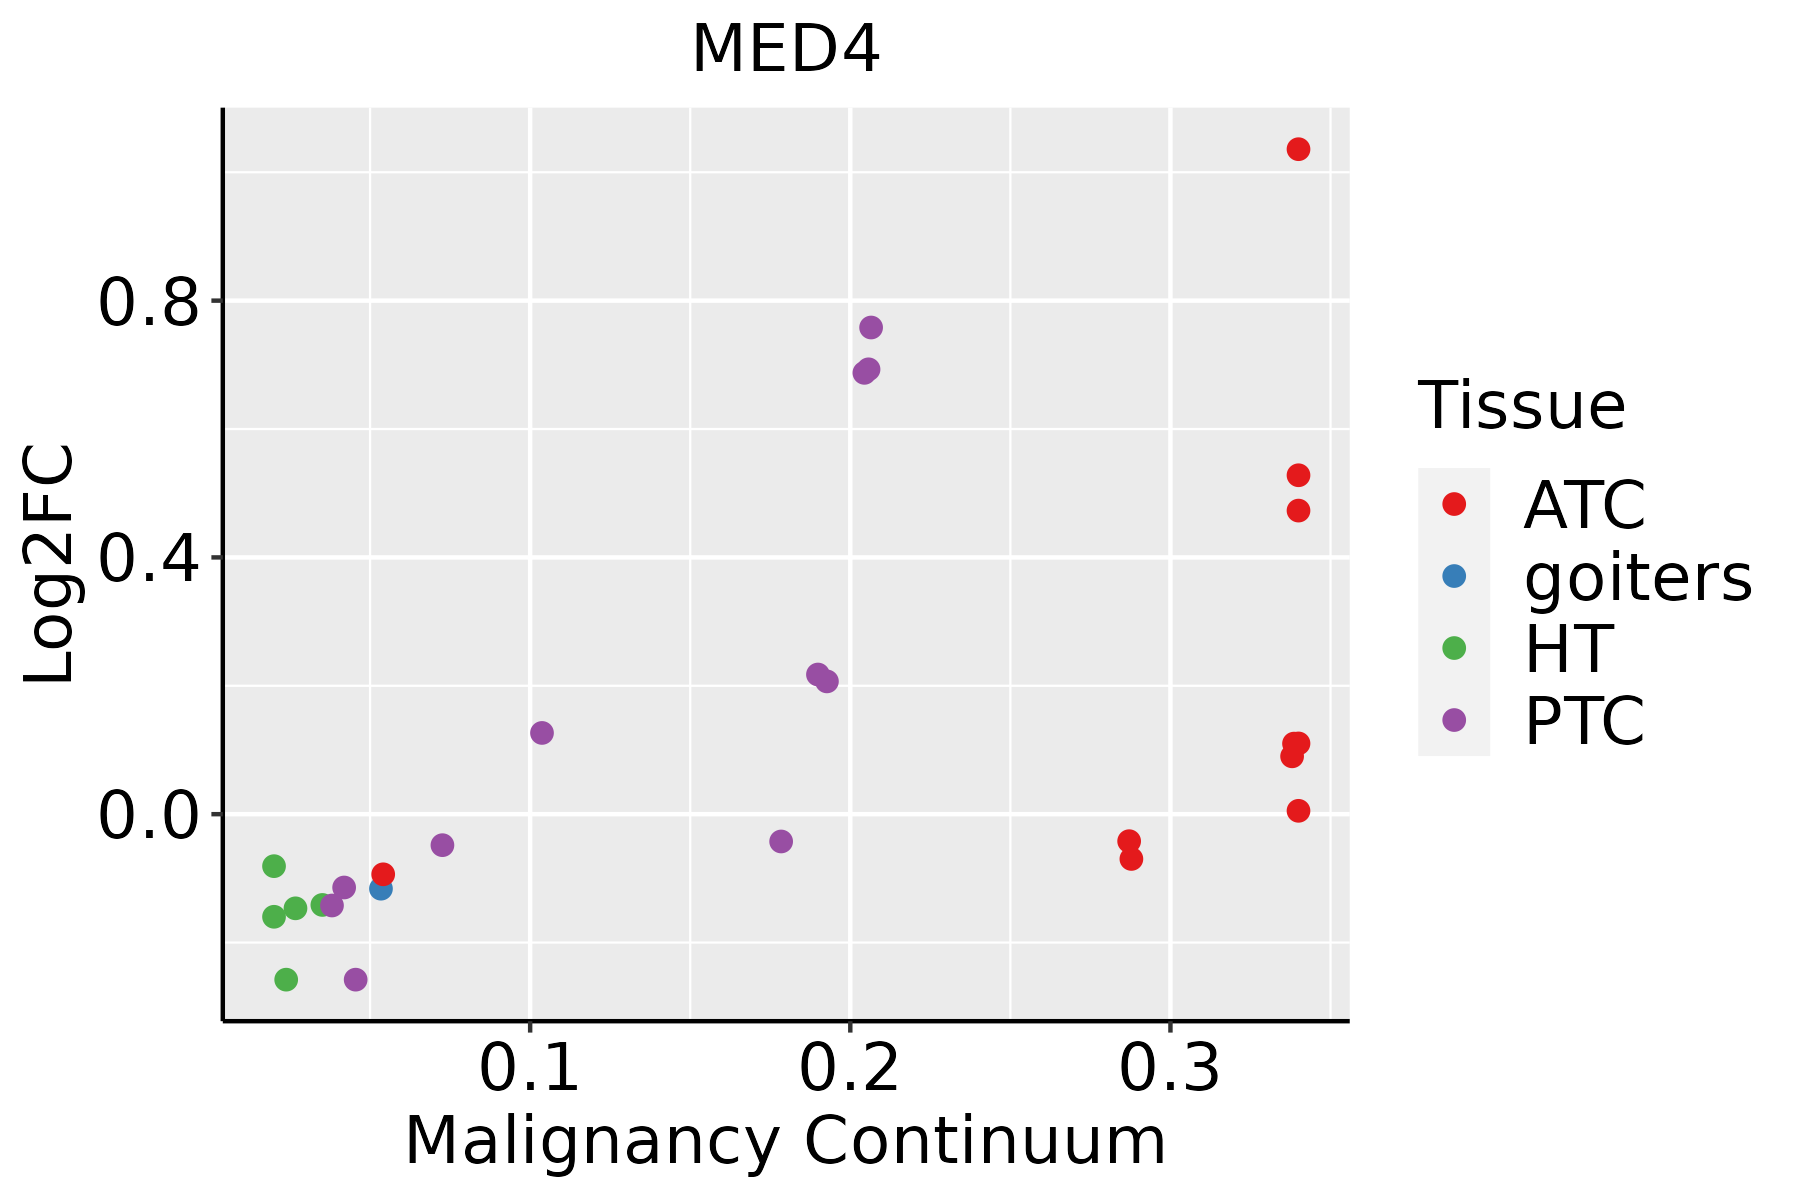 | ATC: Anaplastic thyroid cancer |
| HT: Hashimoto's thyroiditis | ||
| PTC: Papillary thyroid cancer |
| ∗log2FC in expression of this searched gene in stem-like cells from each diseased tissue sample relative to stem-like cells in normal samples in each tissue plotted against the malignancy continuum. Samples are colored based on if they are from different disease stage. |
Top |
Malignant transformation related pathway analysis |
| Find out the enriched GO biological processes and KEGG pathways involved in transition from healthy to precancer to cancer |
| Tissue | Disease Stage | Enriched GO biological Processes |
| Colorectum | AD |  |
| Colorectum | SER |  |
| Colorectum | MSS |  |
| Colorectum | MSI-H |  |
| Colorectum | FAP |  |
| ∗Top 15 enriched GO BP terms are showed in the bar plot of each disease state in each tissue. Each row represents a significant GO biological process which is colored according to the -log10(p.adjust). |
| Page: 1 2 3 4 5 6 7 8 9 |
| GO ID | Tissue | Disease Stage | Description | Gene Ratio | Bg Ratio | pvalue | p.adjust | Count |
| GO:00070302 | Liver | HCC | Golgi organization | 99/7958 | 157/18723 | 1.54e-07 | 2.85e-06 | 99 |
| GO:000724912 | Liver | HCC | I-kappaB kinase/NF-kappaB signaling | 156/7958 | 281/18723 | 6.66e-06 | 8.00e-05 | 156 |
| GO:00063671 | Liver | HCC | transcription initiation from RNA polymerase II promoter | 52/7958 | 77/18723 | 7.87e-06 | 9.27e-05 | 52 |
| GO:004312312 | Liver | HCC | positive regulation of I-kappaB kinase/NF-kappaB signaling | 108/7958 | 186/18723 | 1.28e-05 | 1.43e-04 | 108 |
| GO:004312212 | Liver | HCC | regulation of I-kappaB kinase/NF-kappaB signaling | 138/7958 | 249/18723 | 2.47e-05 | 2.58e-04 | 138 |
| GO:0006352 | Liver | HCC | DNA-templated transcription, initiation | 78/7958 | 130/18723 | 4.19e-05 | 4.11e-04 | 78 |
| GO:20001421 | Liver | HCC | regulation of DNA-templated transcription, initiation | 28/7958 | 40/18723 | 4.01e-04 | 2.71e-03 | 28 |
| GO:00602601 | Liver | HCC | regulation of transcription initiation from RNA polymerase II promoter | 24/7958 | 33/18723 | 4.24e-04 | 2.85e-03 | 24 |
| GO:2000144 | Liver | HCC | positive regulation of DNA-templated transcription, initiation | 21/7958 | 31/18723 | 4.01e-03 | 1.76e-02 | 21 |
| GO:0060261 | Liver | HCC | positive regulation of transcription initiation from RNA polymerase II promoter | 17/7958 | 25/18723 | 8.94e-03 | 3.45e-02 | 17 |
| GO:004819315 | Oral cavity | OSCC | Golgi vesicle transport | 209/7305 | 296/18723 | 1.39e-28 | 6.30e-26 | 209 |
| GO:00068888 | Oral cavity | OSCC | endoplasmic reticulum to Golgi vesicle-mediated transport | 97/7305 | 130/18723 | 1.42e-16 | 1.15e-14 | 97 |
| GO:004312218 | Oral cavity | OSCC | regulation of I-kappaB kinase/NF-kappaB signaling | 155/7305 | 249/18723 | 7.79e-14 | 4.14e-12 | 155 |
| GO:004312310 | Oral cavity | OSCC | positive regulation of I-kappaB kinase/NF-kappaB signaling | 122/7305 | 186/18723 | 1.68e-13 | 8.52e-12 | 122 |
| GO:000724910 | Oral cavity | OSCC | I-kappaB kinase/NF-kappaB signaling | 169/7305 | 281/18723 | 4.69e-13 | 2.25e-11 | 169 |
| GO:00070307 | Oral cavity | OSCC | Golgi organization | 92/7305 | 157/18723 | 4.96e-07 | 7.27e-06 | 92 |
| GO:00063522 | Oral cavity | OSCC | DNA-templated transcription, initiation | 74/7305 | 130/18723 | 2.56e-05 | 2.39e-04 | 74 |
| GO:00063672 | Oral cavity | OSCC | transcription initiation from RNA polymerase II promoter | 46/7305 | 77/18723 | 1.82e-04 | 1.24e-03 | 46 |
| GO:20001423 | Oral cavity | OSCC | regulation of DNA-templated transcription, initiation | 26/7305 | 40/18723 | 7.79e-04 | 4.23e-03 | 26 |
| GO:20001442 | Oral cavity | OSCC | positive regulation of DNA-templated transcription, initiation | 21/7305 | 31/18723 | 1.13e-03 | 5.75e-03 | 21 |
| Page: 1 2 3 4 5 6 7 |
| Pathway ID | Tissue | Disease Stage | Description | Gene Ratio | Bg Ratio | pvalue | p.adjust | qvalue | Count |
| hsa0491928 | Esophagus | ESCC | Thyroid hormone signaling pathway | 78/4205 | 121/8465 | 6.79e-04 | 2.23e-03 | 1.14e-03 | 78 |
| hsa04919113 | Esophagus | ESCC | Thyroid hormone signaling pathway | 78/4205 | 121/8465 | 6.79e-04 | 2.23e-03 | 1.14e-03 | 78 |
| hsa0491912 | Liver | HCC | Thyroid hormone signaling pathway | 75/4020 | 121/8465 | 8.76e-04 | 3.38e-03 | 1.88e-03 | 75 |
| hsa0491913 | Liver | HCC | Thyroid hormone signaling pathway | 75/4020 | 121/8465 | 8.76e-04 | 3.38e-03 | 1.88e-03 | 75 |
| hsa0491926 | Oral cavity | OSCC | Thyroid hormone signaling pathway | 73/3704 | 121/8465 | 1.63e-04 | 5.52e-04 | 2.81e-04 | 73 |
| hsa04919112 | Oral cavity | OSCC | Thyroid hormone signaling pathway | 73/3704 | 121/8465 | 1.63e-04 | 5.52e-04 | 2.81e-04 | 73 |
| Page: 1 |
Top |
Cell-cell communication analysis |
| Identification of potential cell-cell interactions between two cell types and their ligand-receptor pairs for different disease states |
| Ligand | Receptor | LRpair | Pathway | Tissue | Disease Stage |
| Page: 1 |
Top |
Single-cell gene regulatory network inference analysis |
| Find out the significant the regulons (TFs) and the target genes of each regulon across cell types for different disease states |
| TF | Cell Type | Tissue | Disease Stage | Target Gene | RSS | Regulon Activity |
| ∗The dot plots of a searched regulon are shown for all cell subpopulations in each disease state of each tissue based on the regulon specific score inferred using pySCENIC and by calculating the average expression. |
| Page: 1 |
Top |
Somatic mutation of malignant transformation related genes |
| Annotation of somatic variants for genes involved in malignant transformation |
| Hugo Symbol | Variant Class | Variant Classification | dbSNP RS | HGVSc | HGVSp | HGVSp Short | SWISSPROT | BIOTYPE | SIFT | PolyPhen | Tumor Sample Barcode | Tissue | Histology | Sex | Age | Stage | Therapy Types | Drugs | Outcome |
| MED4 | SNV | Missense_Mutation | rs775421698 | c.533N>T | p.Thr178Ile | p.T178I | Q9NPJ6 | protein_coding | deleterious(0.03) | probably_damaging(0.995) | TCGA-BH-A0HF-01 | Breast | breast invasive carcinoma | Female | >=65 | I/II | Hormone Therapy | arimidex | SD |
| MED4 | SNV | Missense_Mutation | c.479N>A | p.Ala160Asp | p.A160D | Q9NPJ6 | protein_coding | deleterious(0) | probably_damaging(0.954) | TCGA-AA-3672-01 | Colorectum | colon adenocarcinoma | Female | >=65 | III/IV | Unknown | Unknown | SD | |
| MED4 | SNV | Missense_Mutation | c.193G>A | p.Val65Ile | p.V65I | Q9NPJ6 | protein_coding | tolerated(0.41) | benign(0.001) | TCGA-AA-A010-01 | Colorectum | colon adenocarcinoma | Female | <65 | I/II | Chemotherapy | folinic | CR | |
| MED4 | SNV | Missense_Mutation | c.373N>A | p.Val125Ile | p.V125I | Q9NPJ6 | protein_coding | tolerated(1) | benign(0.045) | TCGA-CK-5916-01 | Colorectum | colon adenocarcinoma | Female | >=65 | I/II | Unknown | Unknown | PD | |
| MED4 | SNV | Missense_Mutation | rs144201204 | c.592N>A | p.Val198Met | p.V198M | Q9NPJ6 | protein_coding | tolerated(0.22) | benign(0.326) | TCGA-G4-6586-01 | Colorectum | colon adenocarcinoma | Female | >=65 | I/II | Unknown | Unknown | SD |
| MED4 | SNV | Missense_Mutation | c.229C>G | p.Gln77Glu | p.Q77E | Q9NPJ6 | protein_coding | tolerated(0.12) | benign(0.003) | TCGA-A5-A0GU-01 | Endometrium | uterine corpus endometrioid carcinoma | Female | <65 | I/II | Unknown | Unknown | SD | |
| MED4 | SNV | Missense_Mutation | novel | c.768N>T | p.Glu256Asp | p.E256D | Q9NPJ6 | protein_coding | tolerated(0.06) | probably_damaging(0.931) | TCGA-B5-A1MR-01 | Endometrium | uterine corpus endometrioid carcinoma | Female | >=65 | III/IV | Unknown | Unknown | SD |
| MED4 | SNV | Missense_Mutation | novel | c.151N>C | p.Ser51Pro | p.S51P | Q9NPJ6 | protein_coding | tolerated(0.47) | benign(0.328) | TCGA-B5-A3FC-01 | Endometrium | uterine corpus endometrioid carcinoma | Female | <65 | I/II | Unknown | Unknown | SD |
| MED4 | SNV | Missense_Mutation | rs199856249 | c.215N>A | p.Arg72Gln | p.R72Q | Q9NPJ6 | protein_coding | deleterious(0.01) | benign(0.147) | TCGA-DI-A1BU-01 | Endometrium | uterine corpus endometrioid carcinoma | Female | <65 | I/II | Chemotherapy | paclitaxel | SD |
| MED4 | SNV | Missense_Mutation | c.506N>A | p.Pro169Gln | p.P169Q | Q9NPJ6 | protein_coding | tolerated(0.53) | probably_damaging(0.999) | TCGA-55-6971-01 | Lung | lung adenocarcinoma | Female | <65 | I/II | Unknown | Unknown | SD |
| Page: 1 2 |
Top |
Related drugs of malignant transformation related genes |
| Identification of chemicals and drugs interact with genes involved in malignant transfromation |
| (DGIdb 4.0) |
| Entrez ID | Symbol | Category | Interaction Types | Drug Claim Name | Drug Name | PMIDs |
| Page: 1 |

Copyright 2023-Present -The University of Texas Health Science Center at Houston |