
|
|||||
|
 | |
| |
| |
| |
| |
| |
|
Gene: MDH2 |
Gene summary for MDH2 |
| Gene information | Species | Human | Gene symbol | MDH2 | Gene ID | 4191 |
| Gene name | malate dehydrogenase 2 | |
| Gene Alias | DEE51 | |
| Cytomap | 7q11.23 | |
| Gene Type | protein-coding | GO ID | GO:0005975 | UniProtAcc | B3KTM1 |
Top |
Malignant transformation analysis |
| Identification of the aberrant gene expression in precancerous and cancerous lesions by comparing the gene expression of stem-like cells in diseased tissues with normal stem cells |
| Entrez ID | Symbol | Replicates | Species | Organ | Tissue | Adj P-value | Log2FC | Malignancy |
| 4191 | MDH2 | GSM4909282 | Human | Breast | IDC | 3.85e-19 | 4.97e-01 | -0.0288 |
| 4191 | MDH2 | GSM4909288 | Human | Breast | IDC | 1.35e-05 | 1.78e-01 | 0.0988 |
| 4191 | MDH2 | GSM4909294 | Human | Breast | IDC | 4.68e-05 | 9.63e-02 | 0.2022 |
| 4191 | MDH2 | GSM4909296 | Human | Breast | IDC | 2.19e-24 | 3.04e-01 | 0.1524 |
| 4191 | MDH2 | GSM4909297 | Human | Breast | IDC | 5.82e-23 | -3.67e-01 | 0.1517 |
| 4191 | MDH2 | GSM4909301 | Human | Breast | IDC | 6.77e-04 | -1.82e-01 | 0.1577 |
| 4191 | MDH2 | GSM4909311 | Human | Breast | IDC | 1.51e-41 | -2.83e-01 | 0.1534 |
| 4191 | MDH2 | GSM4909312 | Human | Breast | IDC | 1.21e-16 | 1.26e-01 | 0.1552 |
| 4191 | MDH2 | GSM4909313 | Human | Breast | IDC | 8.31e-03 | -1.05e-01 | 0.0391 |
| 4191 | MDH2 | GSM4909316 | Human | Breast | IDC | 9.12e-05 | 9.49e-02 | 0.21 |
| 4191 | MDH2 | GSM4909319 | Human | Breast | IDC | 5.67e-57 | -2.63e-01 | 0.1563 |
| 4191 | MDH2 | GSM4909320 | Human | Breast | IDC | 1.08e-06 | -2.67e-01 | 0.1575 |
| 4191 | MDH2 | GSM4909321 | Human | Breast | IDC | 3.83e-20 | 8.92e-02 | 0.1559 |
| 4191 | MDH2 | brca1 | Human | Breast | Precancer | 4.96e-10 | 4.63e-01 | -0.0338 |
| 4191 | MDH2 | brca2 | Human | Breast | Precancer | 2.84e-03 | 2.94e-01 | -0.024 |
| 4191 | MDH2 | brca3 | Human | Breast | Precancer | 2.66e-23 | 6.02e-01 | -0.0263 |
| 4191 | MDH2 | M2 | Human | Breast | IDC | 1.91e-04 | 1.18e-01 | 0.21 |
| 4191 | MDH2 | NCCBC11 | Human | Breast | DCIS | 4.96e-02 | 2.06e-01 | 0.1232 |
| 4191 | MDH2 | NCCBC14 | Human | Breast | DCIS | 1.16e-14 | -1.83e-01 | 0.2021 |
| 4191 | MDH2 | NCCBC2 | Human | Breast | DCIS | 5.16e-03 | -3.48e-01 | 0.1554 |
| Page: 1 2 3 4 5 6 7 8 9 10 11 12 |
| Tissue | Expression Dynamics | Abbreviation |
| Breast |  | IDC: Invasive ductal carcinoma |
| DCIS: Ductal carcinoma in situ | ||
| Precancer(BRCA1-mut): Precancerous lesion from BRCA1 mutation carriers | ||
| Cervix | 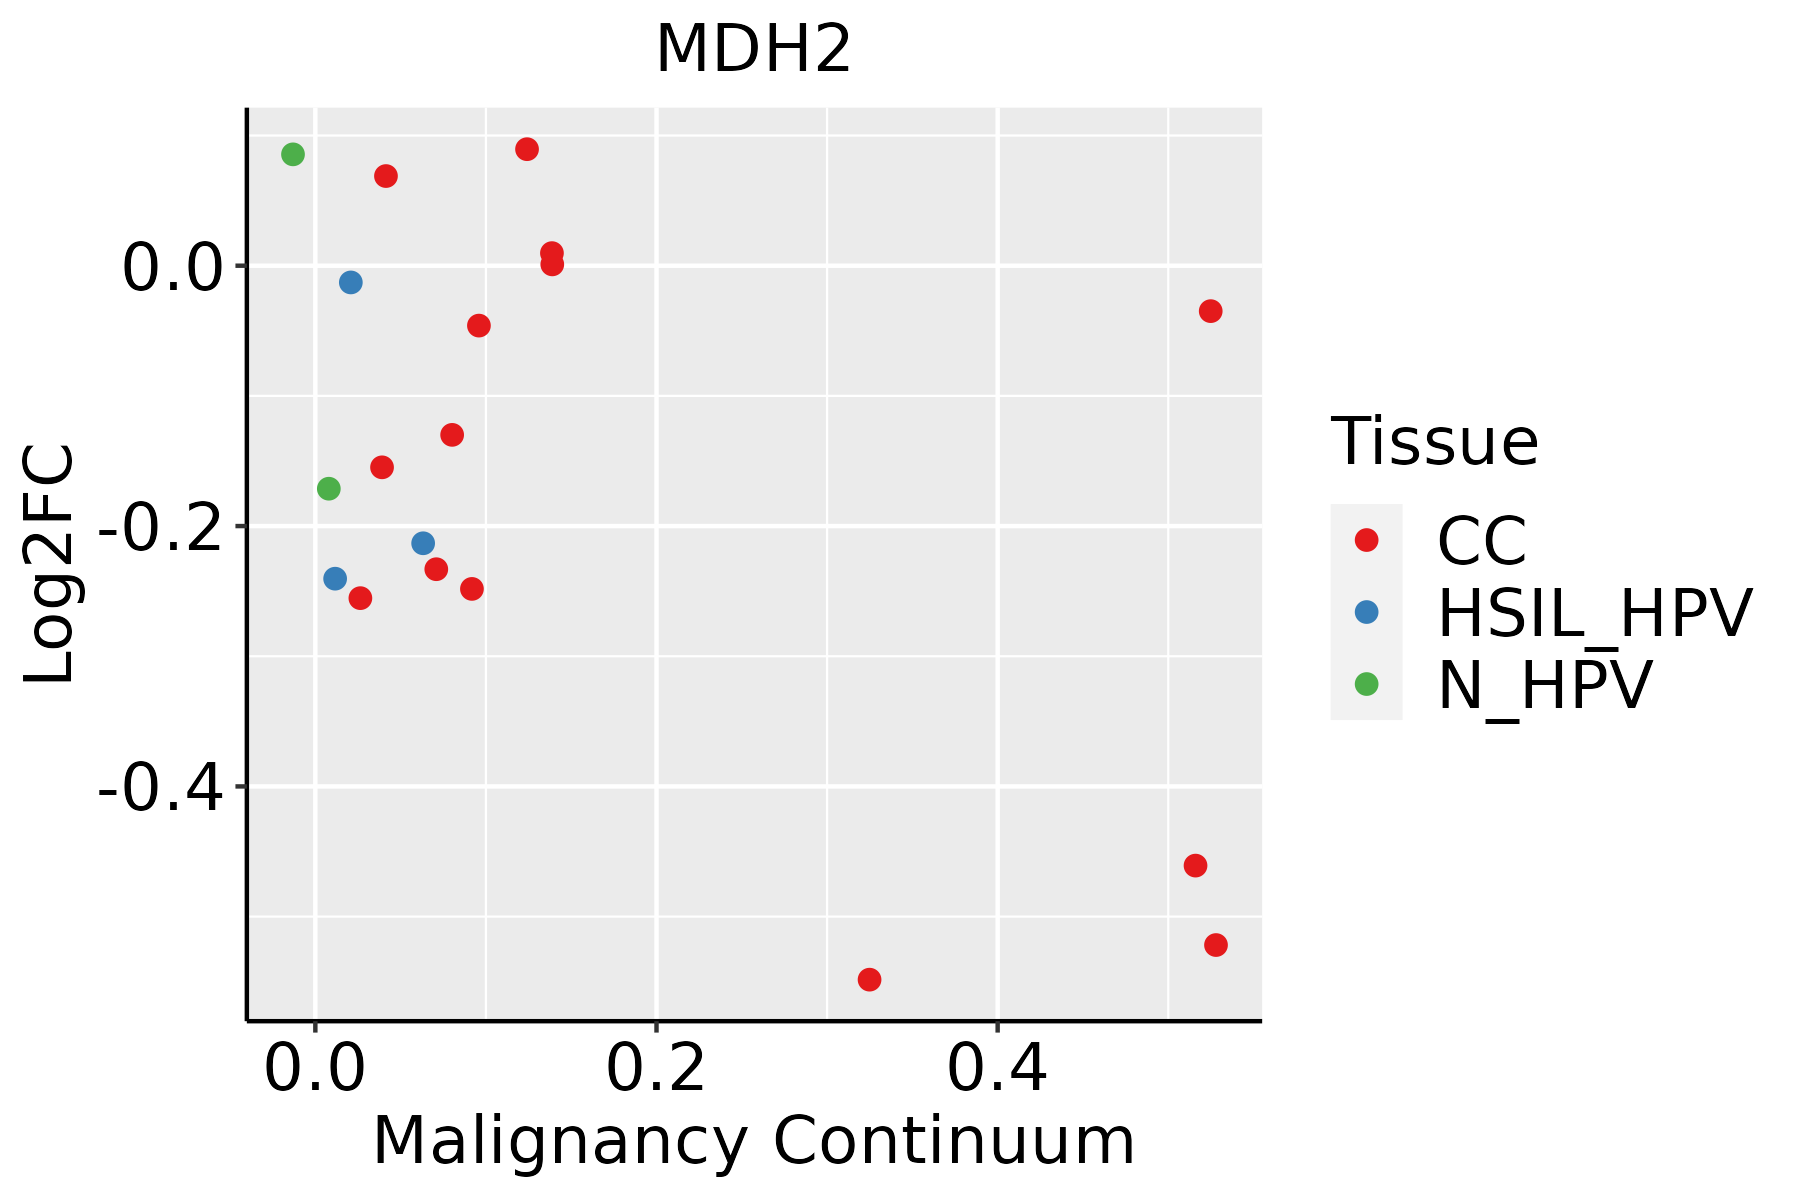 | CC: Cervix cancer |
| HSIL_HPV: HPV-infected high-grade squamous intraepithelial lesions | ||
| N_HPV: HPV-infected normal cervix | ||
| Colorectum (GSE201348) | 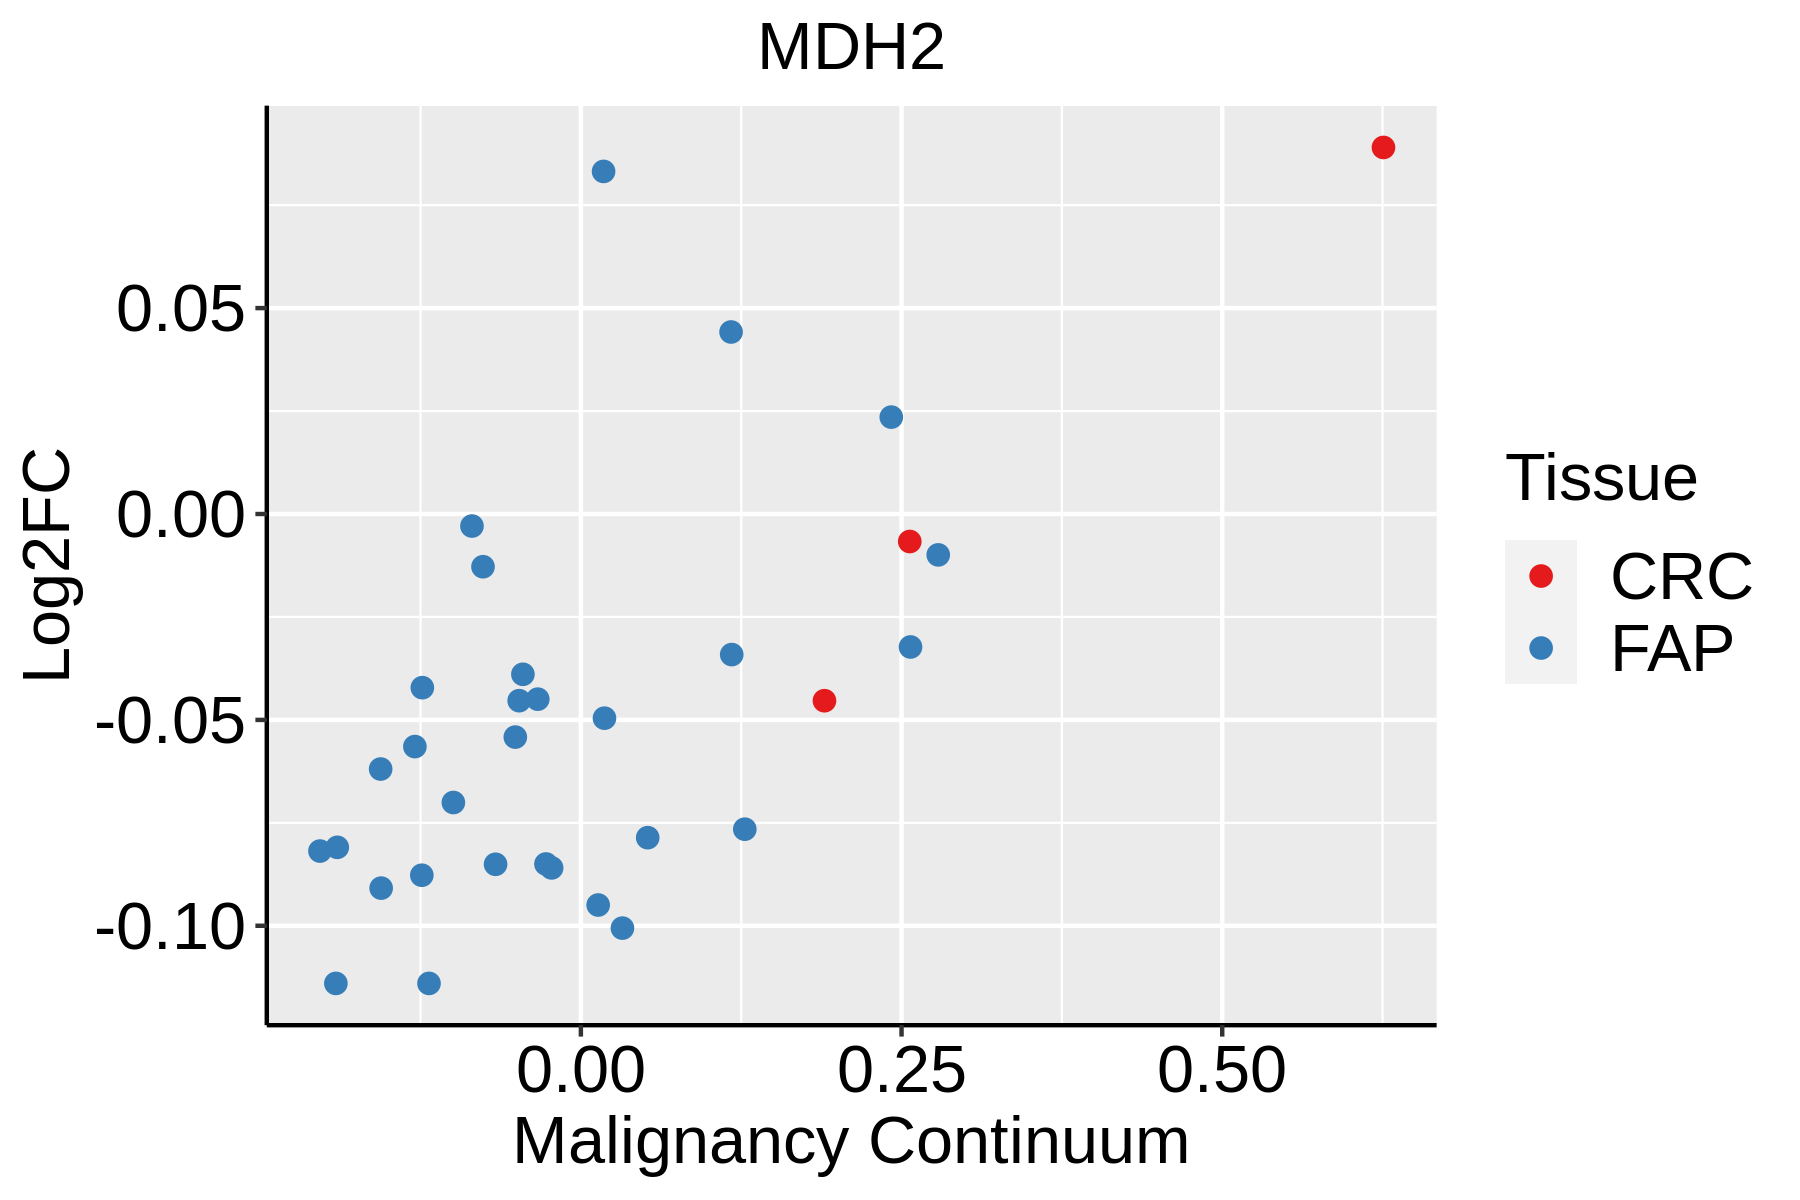 | FAP: Familial adenomatous polyposis |
| CRC: Colorectal cancer | ||
| Colorectum (HTA11) |  | AD: Adenomas |
| SER: Sessile serrated lesions | ||
| MSI-H: Microsatellite-high colorectal cancer | ||
| MSS: Microsatellite stable colorectal cancer | ||
| Endometrium |  | AEH: Atypical endometrial hyperplasia |
| EEC: Endometrioid Cancer | ||
| Esophagus | 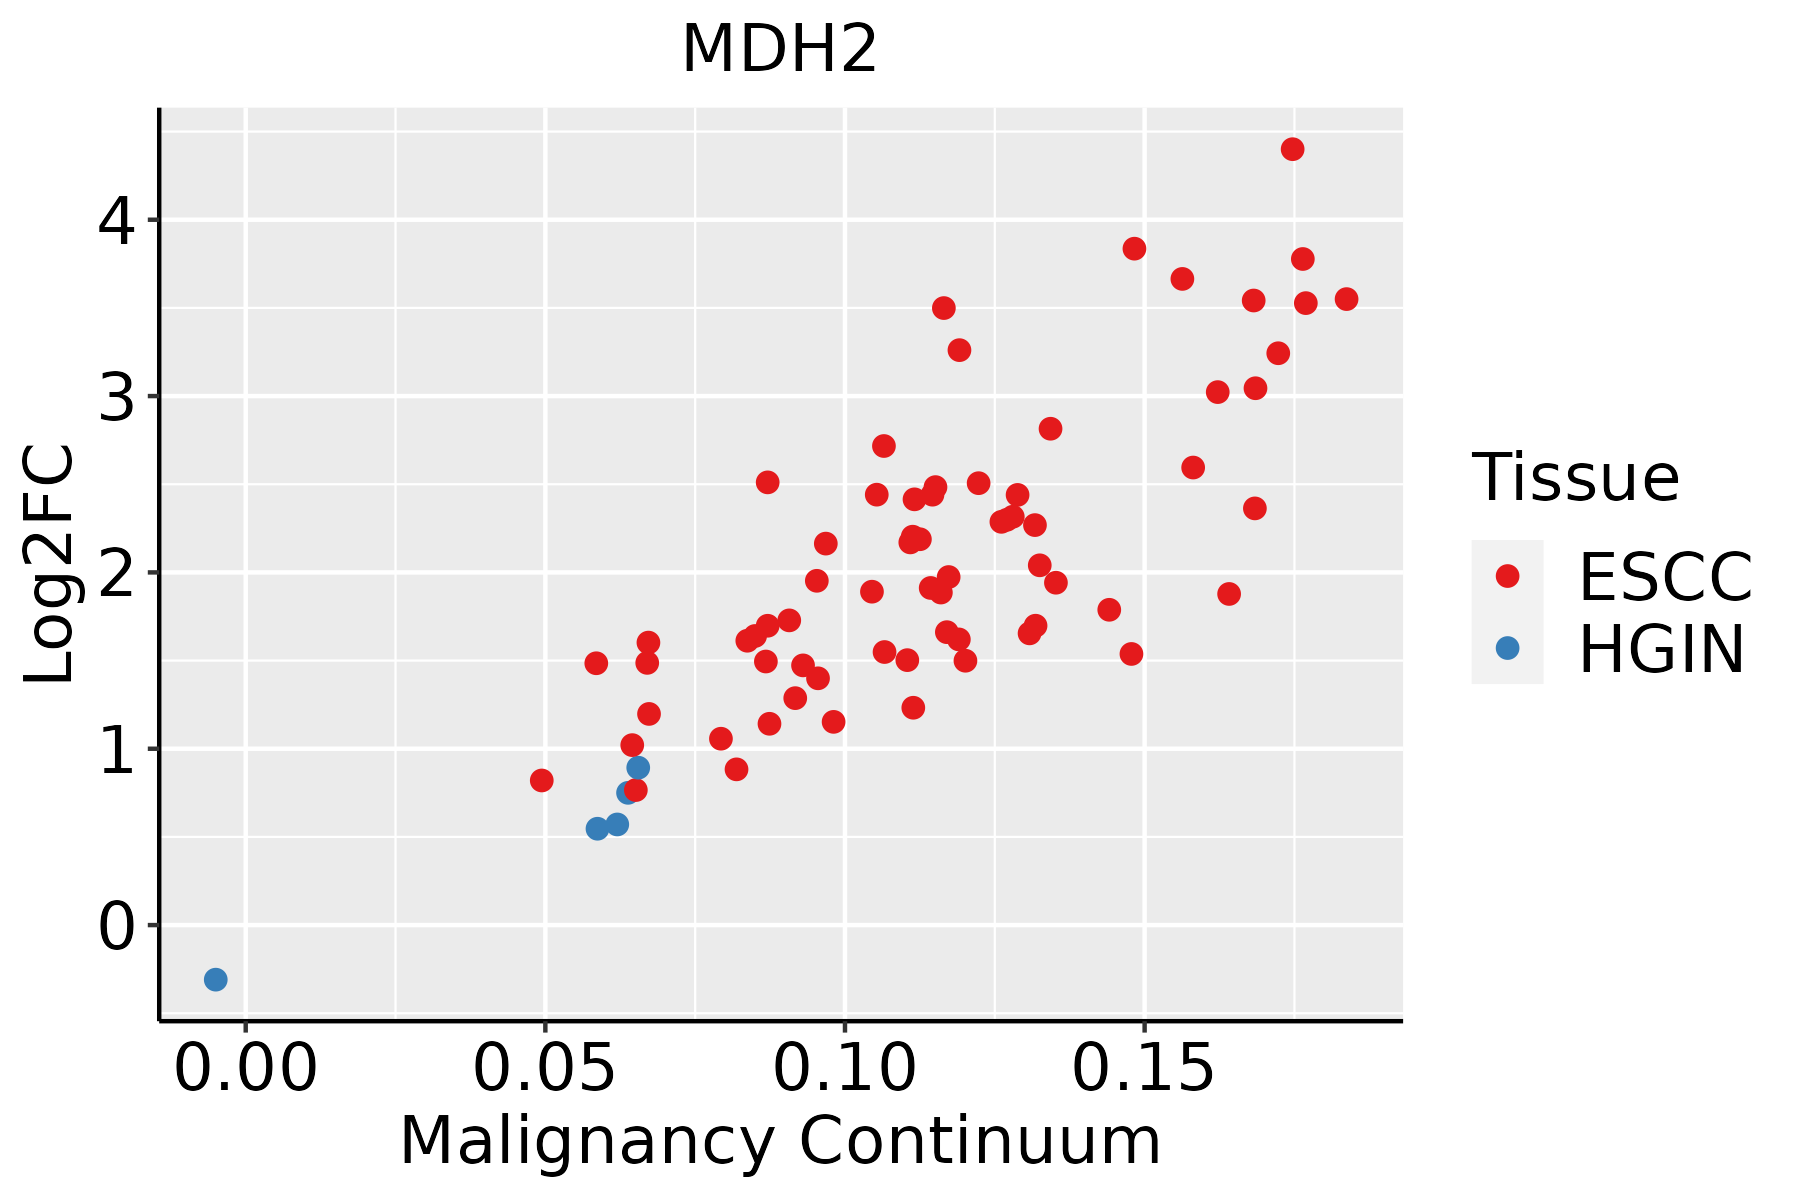 | ESCC: Esophageal squamous cell carcinoma |
| HGIN: High-grade intraepithelial neoplasias | ||
| LGIN: Low-grade intraepithelial neoplasias | ||
| Liver | 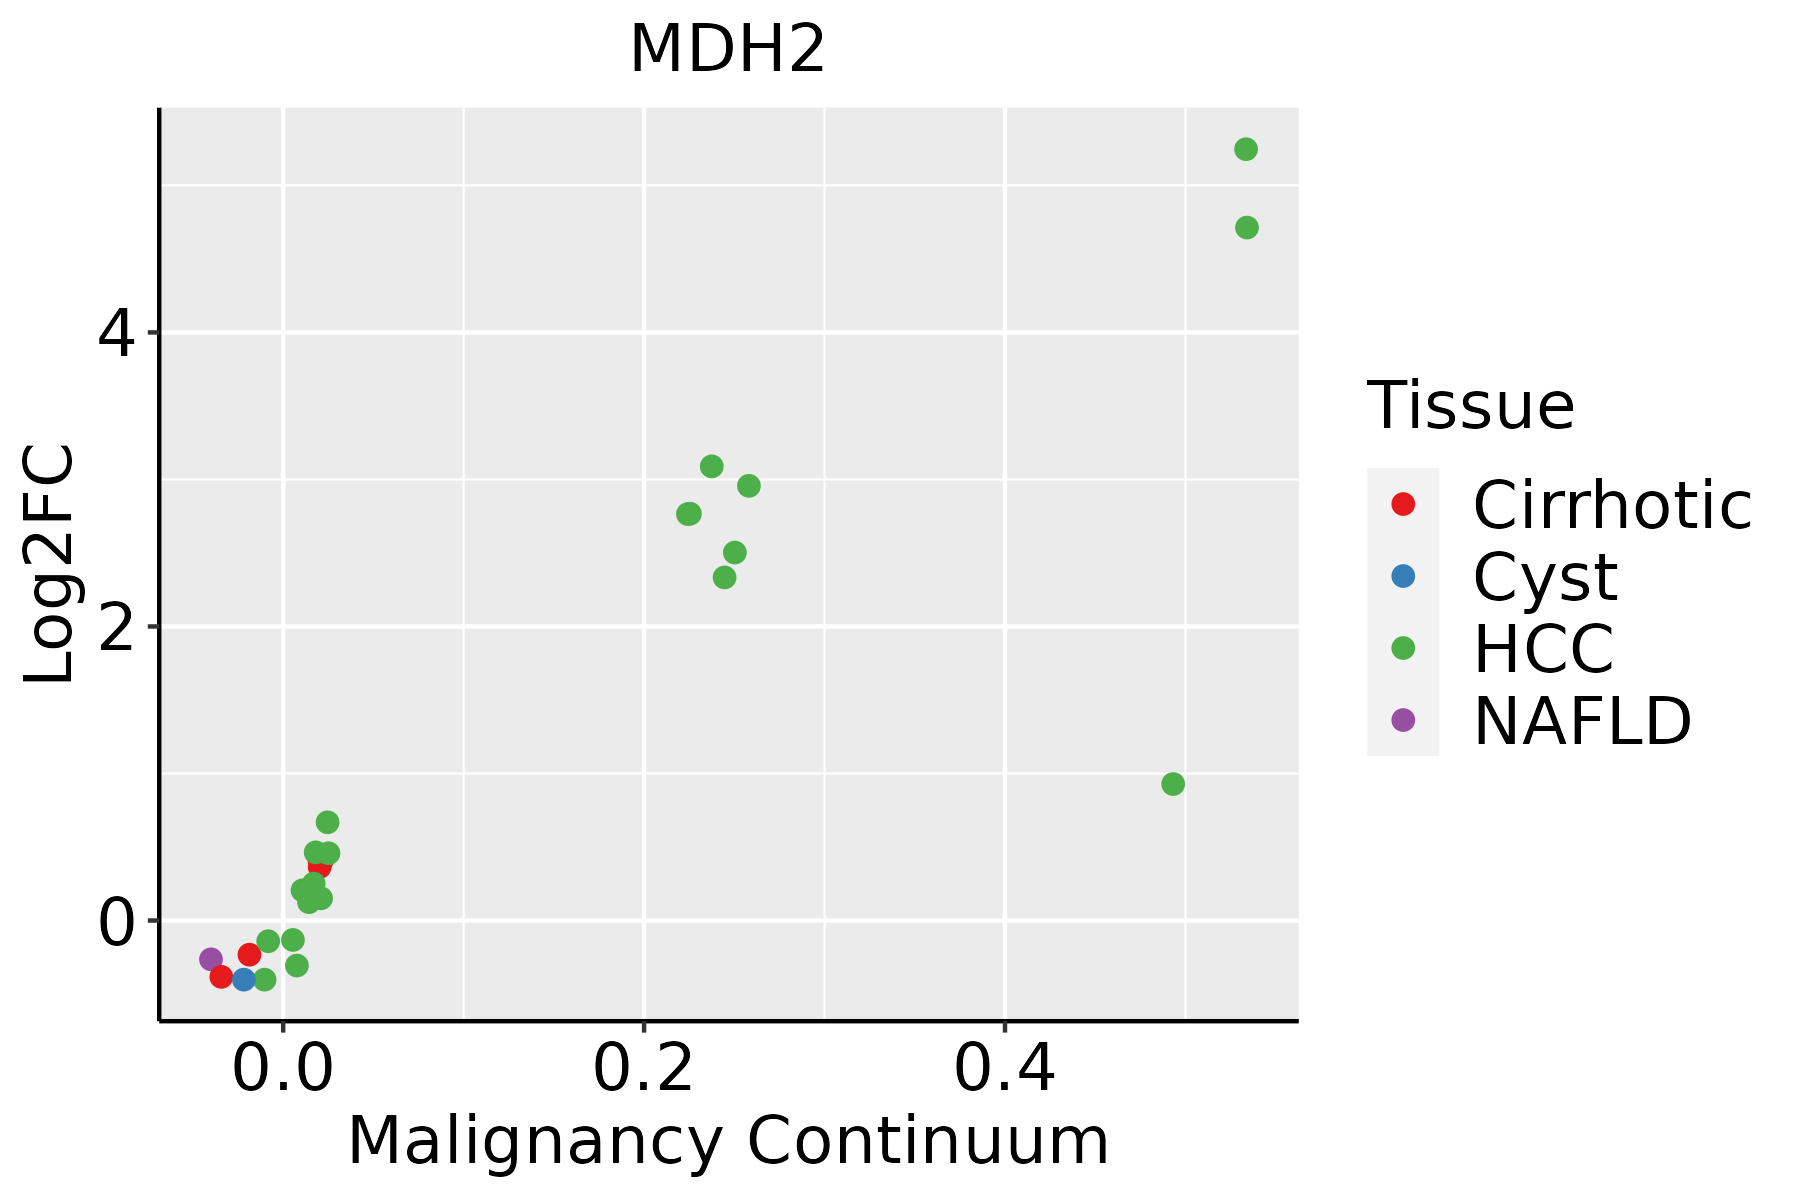 | HCC: Hepatocellular carcinoma |
| NAFLD: Non-alcoholic fatty liver disease | ||
| Oral Cavity | 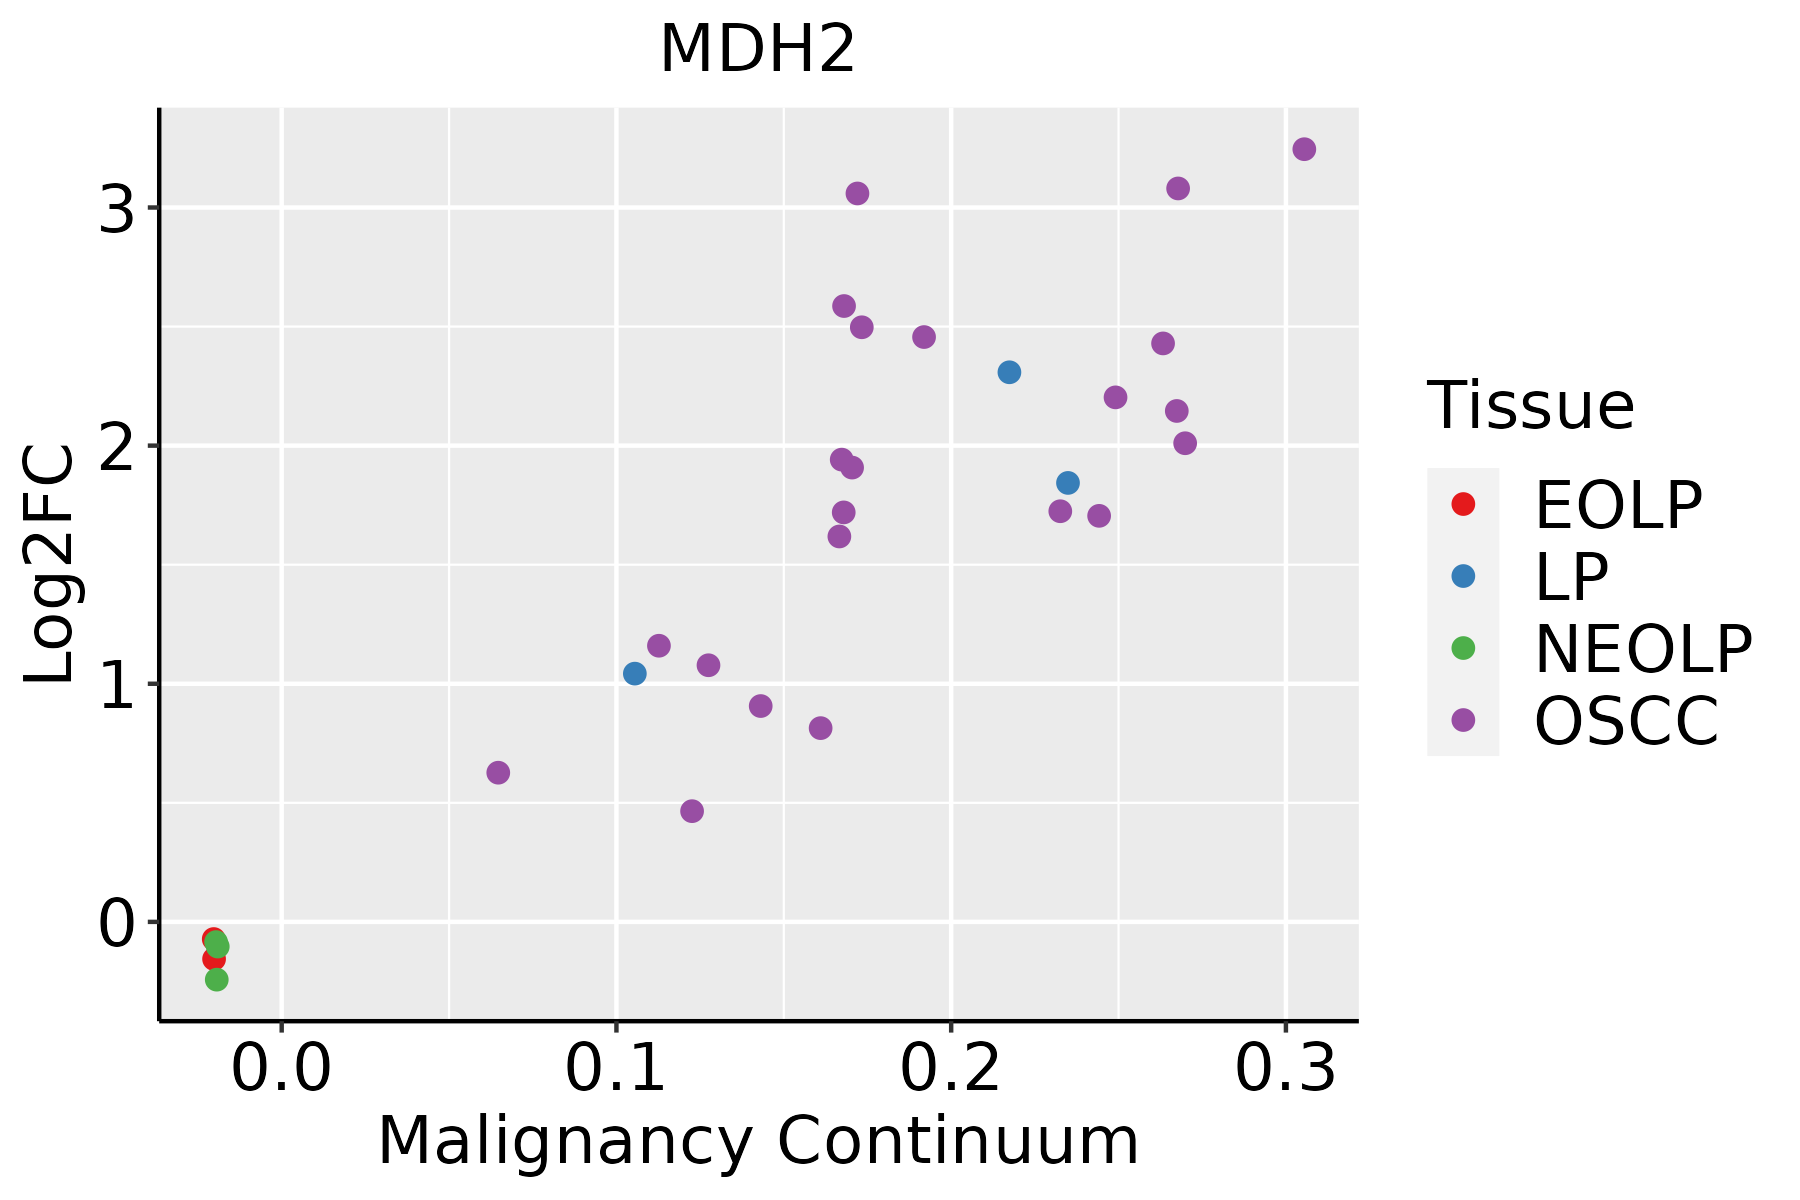 | EOLP: Erosive Oral lichen planus |
| LP: leukoplakia | ||
| NEOLP: Non-erosive oral lichen planus | ||
| OSCC: Oral squamous cell carcinoma | ||
| Prostate | 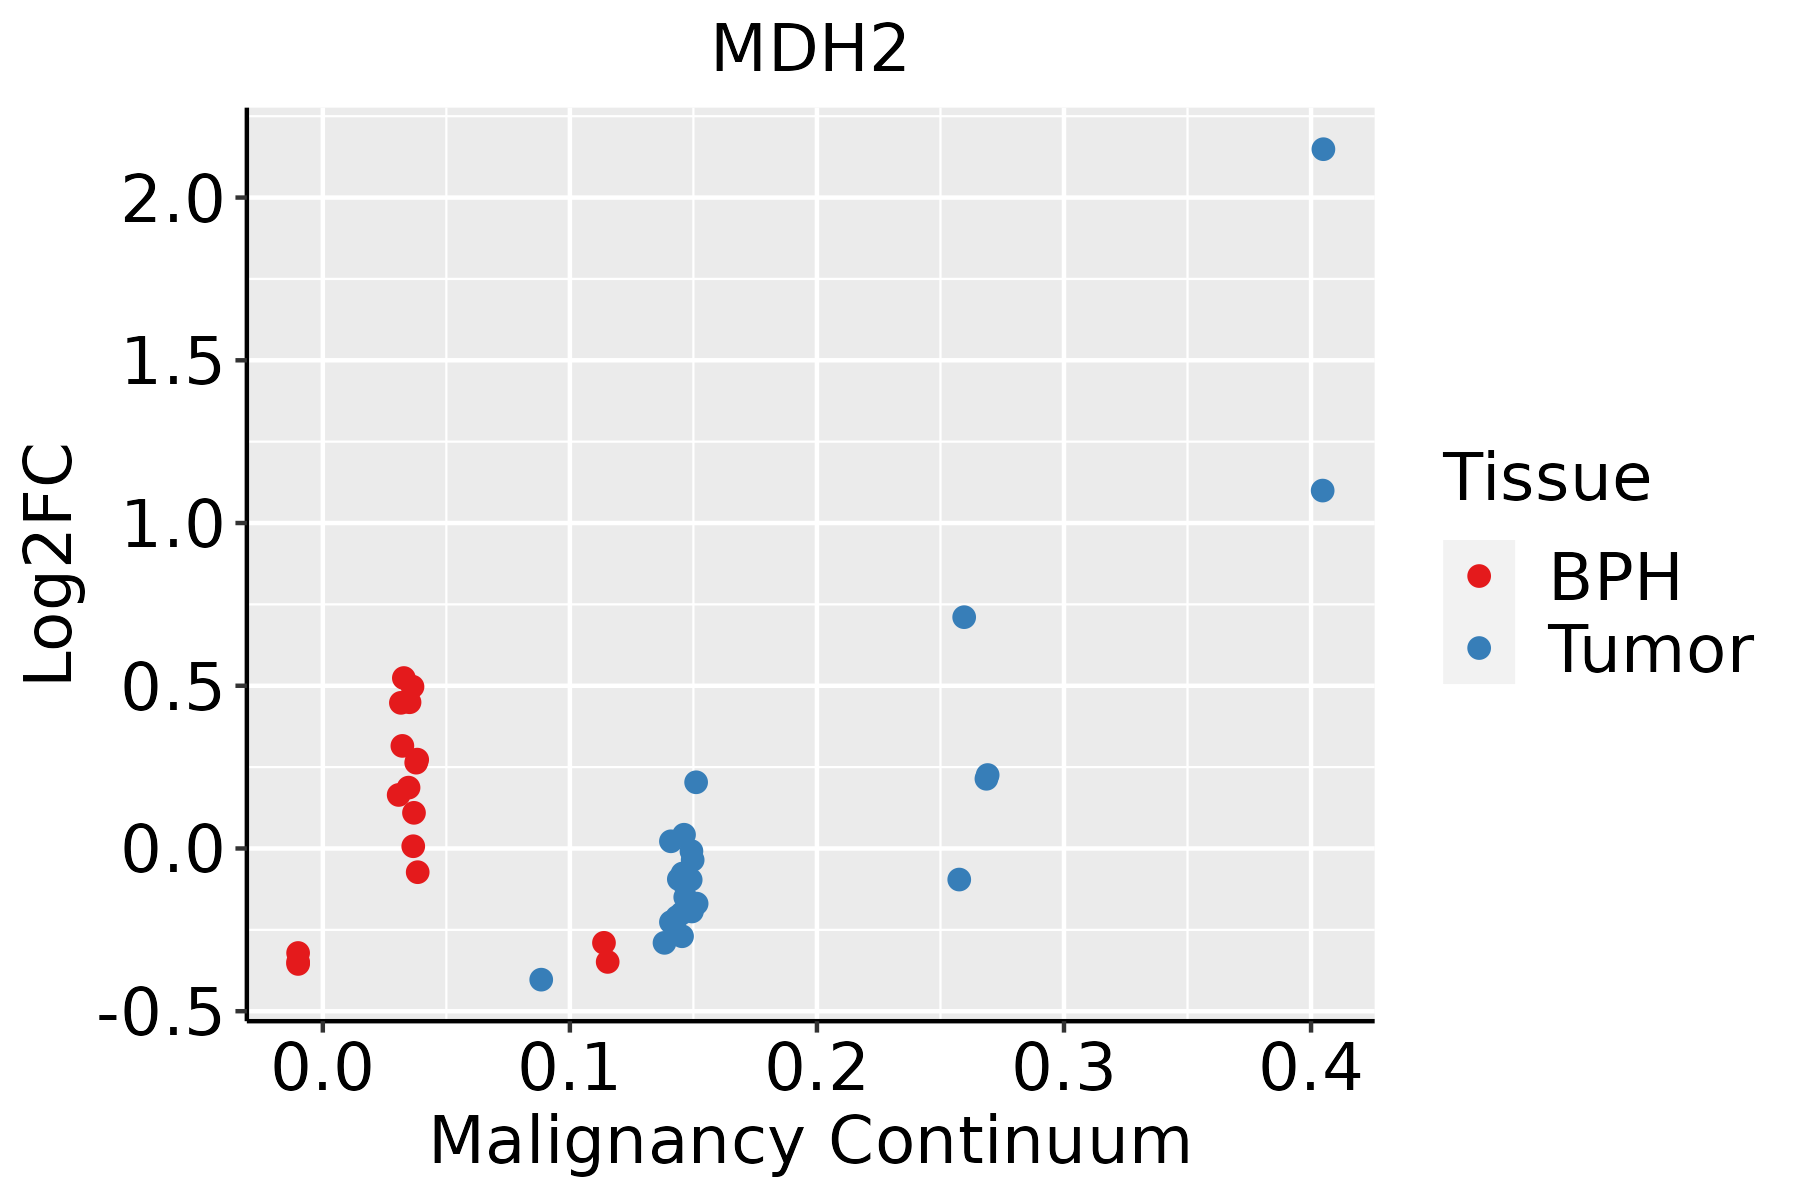 | BPH: Benign Prostatic Hyperplasia |
| Skin | 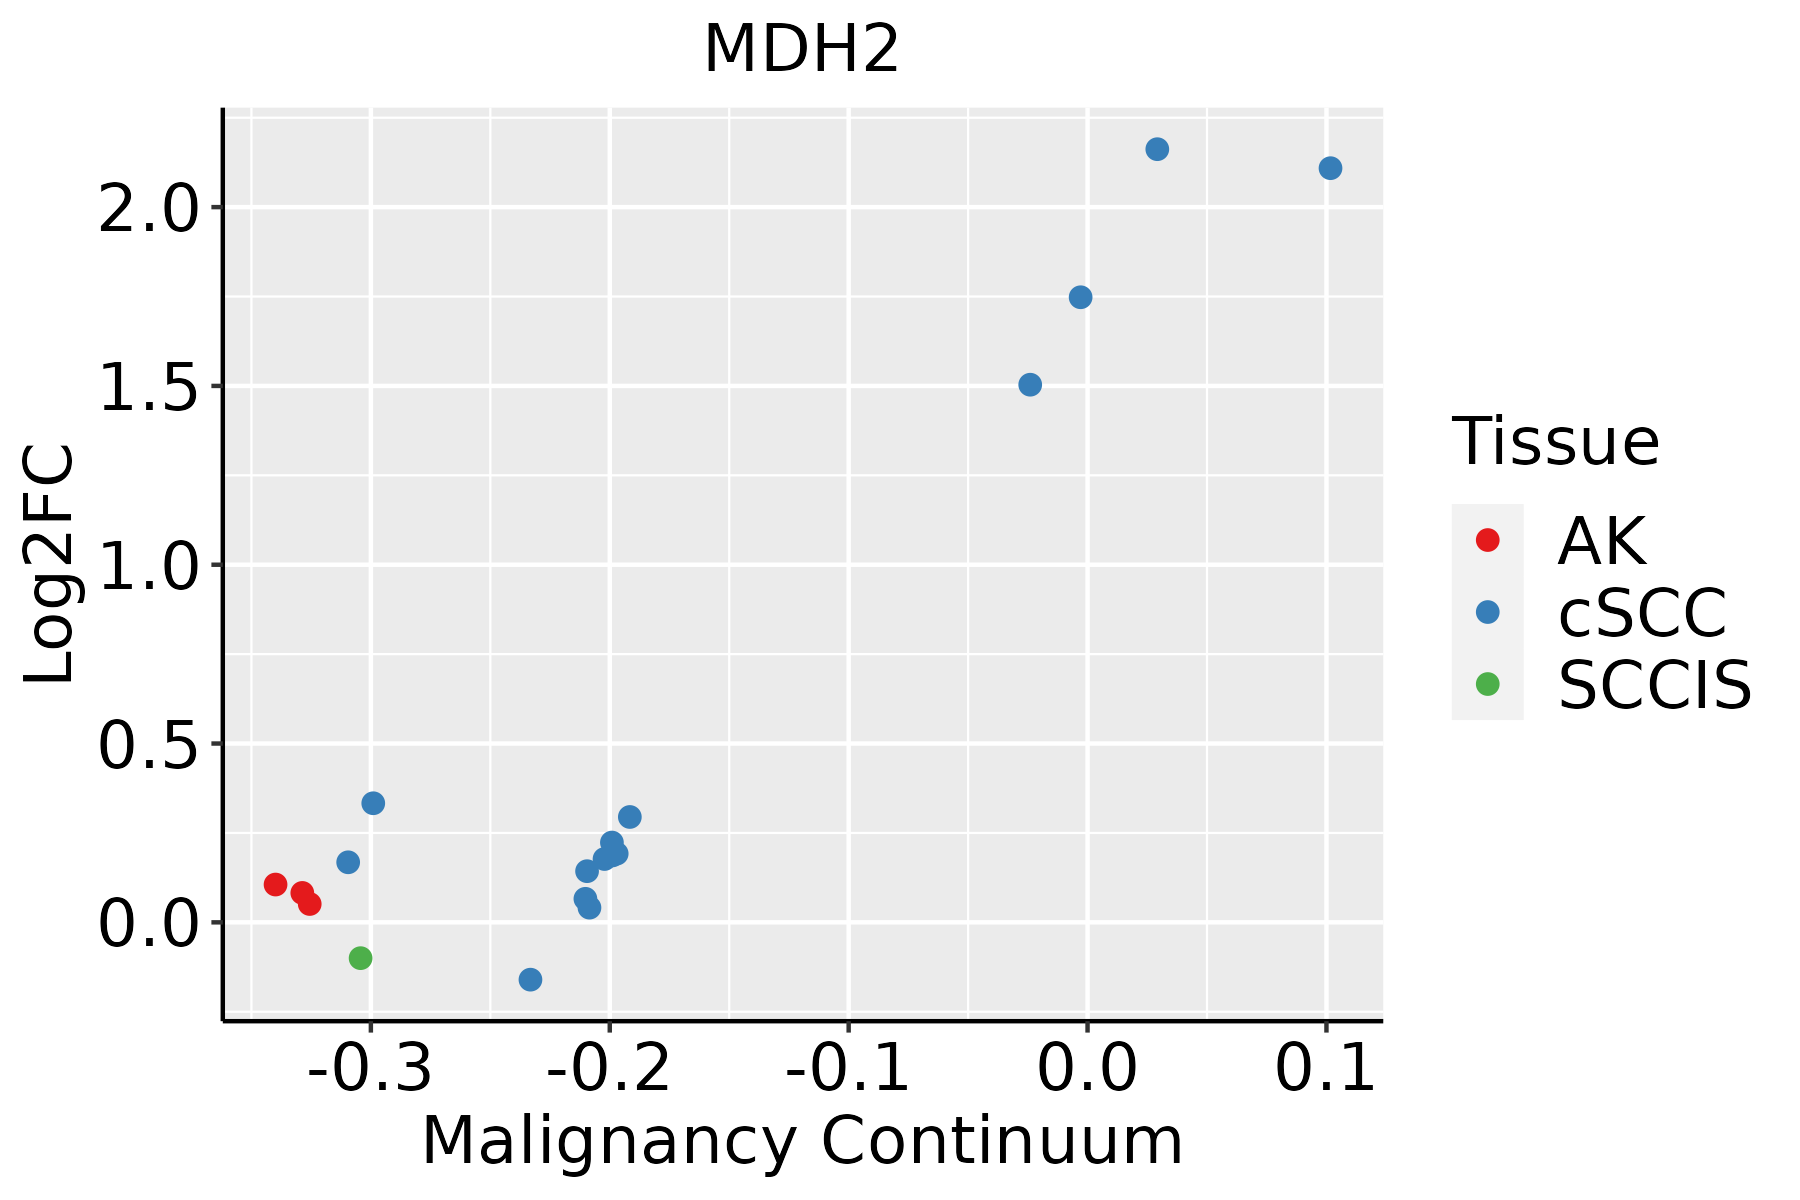 | AK: Actinic keratosis |
| cSCC: Cutaneous squamous cell carcinoma | ||
| SCCIS:squamous cell carcinoma in situ | ||
| Thyroid | 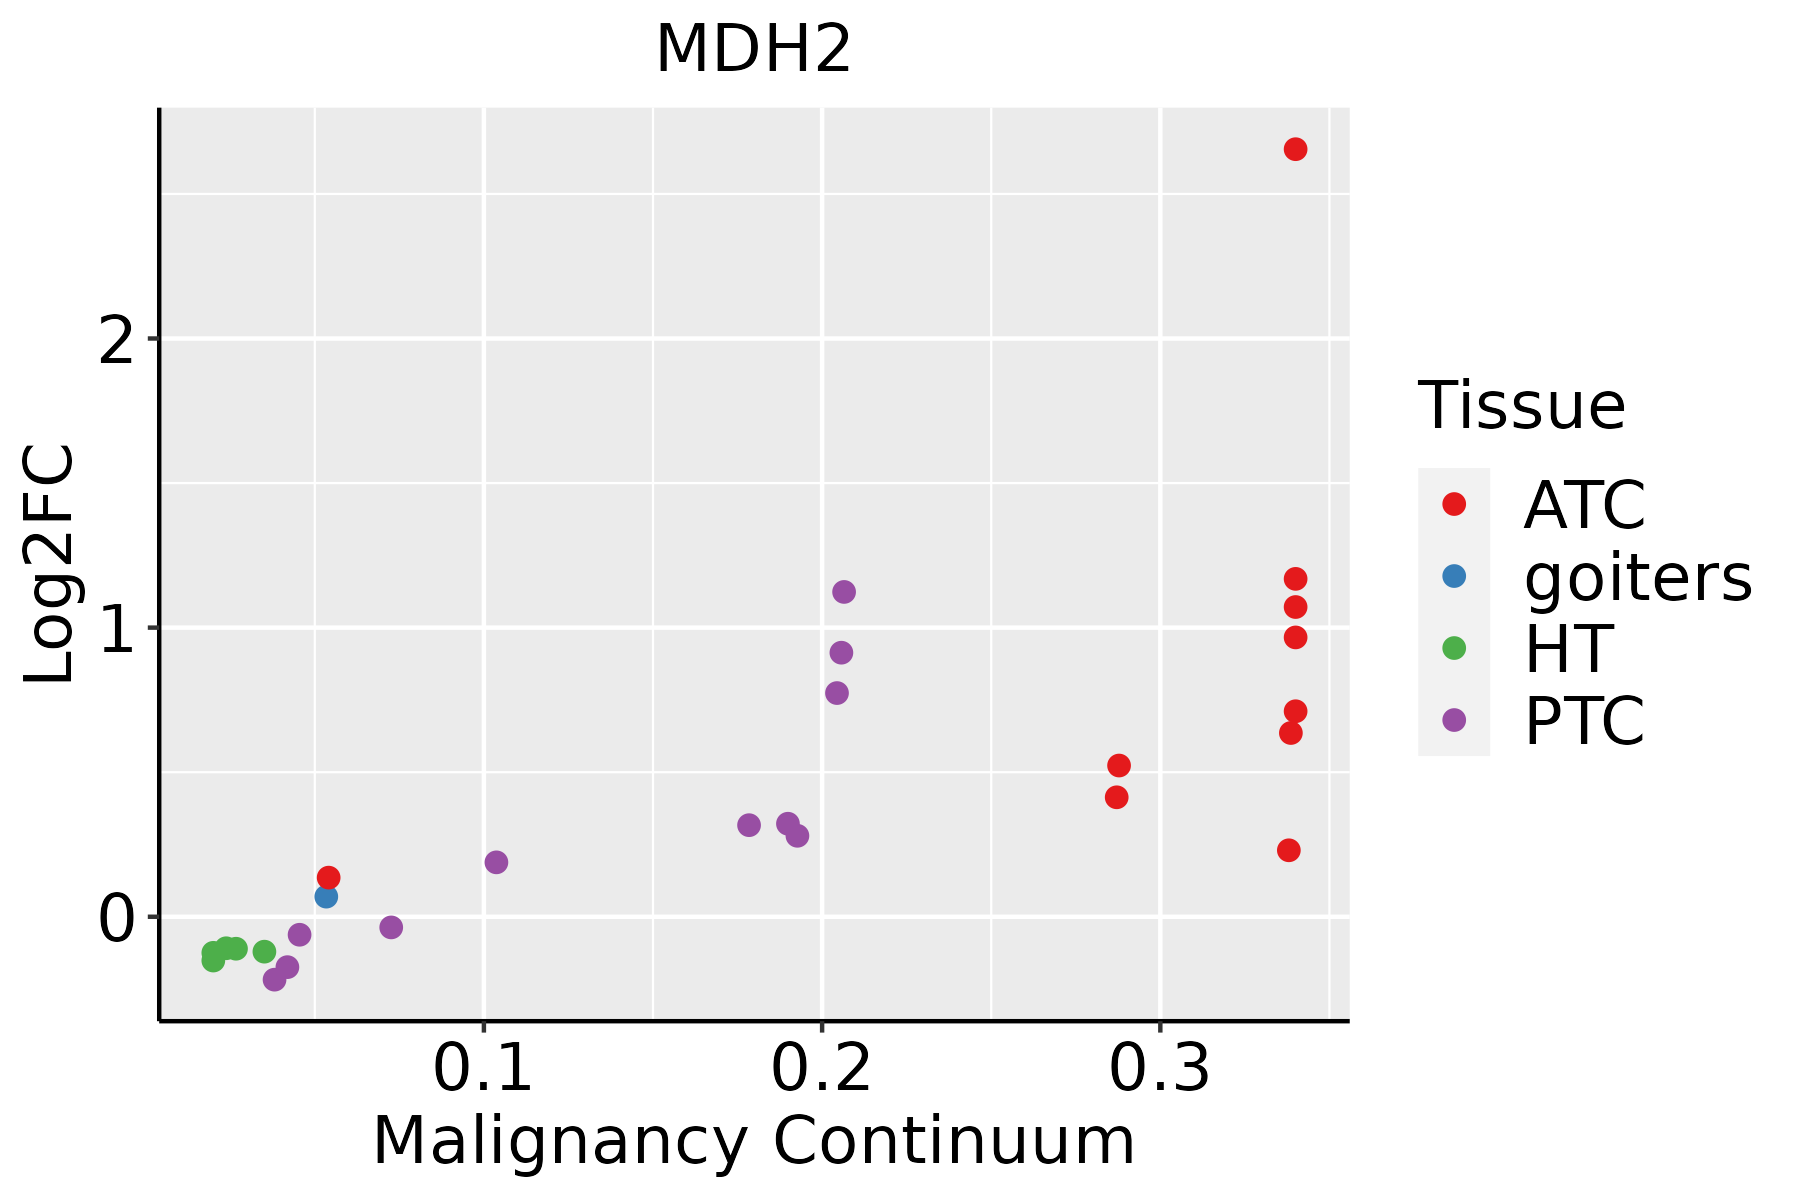 | ATC: Anaplastic thyroid cancer |
| HT: Hashimoto's thyroiditis | ||
| PTC: Papillary thyroid cancer |
| ∗log2FC in expression of this searched gene in stem-like cells from each diseased tissue sample relative to stem-like cells in normal samples in each tissue plotted against the malignancy continuum. Samples are colored based on if they are from different disease stage. |
Top |
Malignant transformation related pathway analysis |
| Find out the enriched GO biological processes and KEGG pathways involved in transition from healthy to precancer to cancer |
| Tissue | Disease Stage | Enriched GO biological Processes |
| Colorectum | AD |  |
| Colorectum | SER |  |
| Colorectum | MSS |  |
| Colorectum | MSI-H |  |
| Colorectum | FAP |  |
| ∗Top 15 enriched GO BP terms are showed in the bar plot of each disease state in each tissue. Each row represents a significant GO biological process which is colored according to the -log10(p.adjust). |
| Page: 1 2 3 4 5 6 7 8 9 |
| GO ID | Tissue | Disease Stage | Description | Gene Ratio | Bg Ratio | pvalue | p.adjust | Count |
| GO:00090607 | Liver | Cirrhotic | aerobic respiration | 109/4634 | 189/18723 | 3.88e-22 | 1.62e-19 | 109 |
| GO:00453337 | Liver | Cirrhotic | cellular respiration | 122/4634 | 230/18723 | 2.15e-20 | 6.43e-18 | 122 |
| GO:001598012 | Liver | Cirrhotic | energy derivation by oxidation of organic compounds | 154/4634 | 318/18723 | 3.11e-20 | 8.87e-18 | 154 |
| GO:00060995 | Liver | Cirrhotic | tricarboxylic acid cycle | 19/4634 | 30/18723 | 8.57e-06 | 1.27e-04 | 19 |
| GO:004364811 | Liver | Cirrhotic | dicarboxylic acid metabolic process | 43/4634 | 96/18723 | 1.42e-05 | 1.97e-04 | 43 |
| GO:000609122 | Liver | HCC | generation of precursor metabolites and energy | 340/7958 | 490/18723 | 4.04e-34 | 2.85e-31 | 340 |
| GO:000906012 | Liver | HCC | aerobic respiration | 147/7958 | 189/18723 | 3.13e-23 | 6.61e-21 | 147 |
| GO:004533312 | Liver | HCC | cellular respiration | 171/7958 | 230/18723 | 6.35e-23 | 1.26e-20 | 171 |
| GO:001598022 | Liver | HCC | energy derivation by oxidation of organic compounds | 221/7958 | 318/18723 | 1.02e-22 | 1.86e-20 | 221 |
| GO:00436482 | Liver | HCC | dicarboxylic acid metabolic process | 68/7958 | 96/18723 | 1.73e-08 | 4.14e-07 | 68 |
| GO:000609911 | Liver | HCC | tricarboxylic acid cycle | 27/7958 | 30/18723 | 7.59e-08 | 1.52e-06 | 27 |
| GO:000609118 | Oral cavity | OSCC | generation of precursor metabolites and energy | 286/7305 | 490/18723 | 1.45e-18 | 1.71e-16 | 286 |
| GO:000906018 | Oral cavity | OSCC | aerobic respiration | 133/7305 | 189/18723 | 1.79e-18 | 2.02e-16 | 133 |
| GO:004533318 | Oral cavity | OSCC | cellular respiration | 153/7305 | 230/18723 | 2.07e-17 | 1.87e-15 | 153 |
| GO:001598018 | Oral cavity | OSCC | energy derivation by oxidation of organic compounds | 190/7305 | 318/18723 | 4.10e-14 | 2.26e-12 | 190 |
| GO:00060996 | Oral cavity | OSCC | tricarboxylic acid cycle | 26/7305 | 30/18723 | 9.63e-08 | 1.66e-06 | 26 |
| GO:00436484 | Oral cavity | OSCC | dicarboxylic acid metabolic process | 50/7305 | 96/18723 | 6.24e-03 | 2.35e-02 | 50 |
| GO:000906019 | Oral cavity | LP | aerobic respiration | 111/4623 | 189/18723 | 1.68e-23 | 5.85e-21 | 111 |
| GO:004533319 | Oral cavity | LP | cellular respiration | 124/4623 | 230/18723 | 1.35e-21 | 3.38e-19 | 124 |
| GO:000609119 | Oral cavity | LP | generation of precursor metabolites and energy | 214/4623 | 490/18723 | 1.12e-20 | 2.60e-18 | 214 |
| Page: 1 2 3 4 5 6 |
| Pathway ID | Tissue | Disease Stage | Description | Gene Ratio | Bg Ratio | pvalue | p.adjust | qvalue | Count |
| hsa0120012 | Breast | Precancer | Carbon metabolism | 18/684 | 115/8465 | 4.79e-03 | 2.75e-02 | 2.11e-02 | 18 |
| hsa0120013 | Breast | Precancer | Carbon metabolism | 18/684 | 115/8465 | 4.79e-03 | 2.75e-02 | 2.11e-02 | 18 |
| hsa01200 | Colorectum | AD | Carbon metabolism | 55/2092 | 115/8465 | 5.53e-08 | 8.42e-07 | 5.37e-07 | 55 |
| hsa00620 | Colorectum | AD | Pyruvate metabolism | 28/2092 | 47/8465 | 3.71e-07 | 5.41e-06 | 3.45e-06 | 28 |
| hsa00020 | Colorectum | AD | Citrate cycle (TCA cycle) | 20/2092 | 30/8465 | 1.43e-06 | 1.77e-05 | 1.13e-05 | 20 |
| hsa00630 | Colorectum | AD | Glyoxylate and dicarboxylate metabolism | 14/2092 | 30/8465 | 7.25e-03 | 2.97e-02 | 1.89e-02 | 14 |
| hsa012001 | Colorectum | AD | Carbon metabolism | 55/2092 | 115/8465 | 5.53e-08 | 8.42e-07 | 5.37e-07 | 55 |
| hsa006201 | Colorectum | AD | Pyruvate metabolism | 28/2092 | 47/8465 | 3.71e-07 | 5.41e-06 | 3.45e-06 | 28 |
| hsa000201 | Colorectum | AD | Citrate cycle (TCA cycle) | 20/2092 | 30/8465 | 1.43e-06 | 1.77e-05 | 1.13e-05 | 20 |
| hsa006301 | Colorectum | AD | Glyoxylate and dicarboxylate metabolism | 14/2092 | 30/8465 | 7.25e-03 | 2.97e-02 | 1.89e-02 | 14 |
| hsa006202 | Colorectum | SER | Pyruvate metabolism | 22/1580 | 47/8465 | 9.62e-06 | 1.33e-04 | 9.67e-05 | 22 |
| hsa000202 | Colorectum | SER | Citrate cycle (TCA cycle) | 16/1580 | 30/8465 | 2.06e-05 | 2.74e-04 | 1.99e-04 | 16 |
| hsa012002 | Colorectum | SER | Carbon metabolism | 40/1580 | 115/8465 | 2.77e-05 | 3.41e-04 | 2.47e-04 | 40 |
| hsa006203 | Colorectum | SER | Pyruvate metabolism | 22/1580 | 47/8465 | 9.62e-06 | 1.33e-04 | 9.67e-05 | 22 |
| hsa000203 | Colorectum | SER | Citrate cycle (TCA cycle) | 16/1580 | 30/8465 | 2.06e-05 | 2.74e-04 | 1.99e-04 | 16 |
| hsa012003 | Colorectum | SER | Carbon metabolism | 40/1580 | 115/8465 | 2.77e-05 | 3.41e-04 | 2.47e-04 | 40 |
| hsa006204 | Colorectum | MSS | Pyruvate metabolism | 24/1875 | 47/8465 | 1.25e-05 | 1.35e-04 | 8.27e-05 | 24 |
| hsa012004 | Colorectum | MSS | Carbon metabolism | 43/1875 | 115/8465 | 1.37e-04 | 1.17e-03 | 7.19e-04 | 43 |
| hsa000204 | Colorectum | MSS | Citrate cycle (TCA cycle) | 16/1875 | 30/8465 | 1.84e-04 | 1.47e-03 | 9.00e-04 | 16 |
| hsa006205 | Colorectum | MSS | Pyruvate metabolism | 24/1875 | 47/8465 | 1.25e-05 | 1.35e-04 | 8.27e-05 | 24 |
| Page: 1 2 3 4 |
Top |
Cell-cell communication analysis |
| Identification of potential cell-cell interactions between two cell types and their ligand-receptor pairs for different disease states |
| Ligand | Receptor | LRpair | Pathway | Tissue | Disease Stage |
| Page: 1 |
Top |
Single-cell gene regulatory network inference analysis |
| Find out the significant the regulons (TFs) and the target genes of each regulon across cell types for different disease states |
| TF | Cell Type | Tissue | Disease Stage | Target Gene | RSS | Regulon Activity |
| ∗The dot plots of a searched regulon are shown for all cell subpopulations in each disease state of each tissue based on the regulon specific score inferred using pySCENIC and by calculating the average expression. |
| Page: 1 |
Top |
Somatic mutation of malignant transformation related genes |
| Annotation of somatic variants for genes involved in malignant transformation |
| Hugo Symbol | Variant Class | Variant Classification | dbSNP RS | HGVSc | HGVSp | HGVSp Short | SWISSPROT | BIOTYPE | SIFT | PolyPhen | Tumor Sample Barcode | Tissue | Histology | Sex | Age | Stage | Therapy Types | Drugs | Outcome |
| MDH2 | SNV | Missense_Mutation | rs145207041 | c.505N>A | p.Val169Met | p.V169M | P40926 | protein_coding | deleterious(0.03) | possibly_damaging(0.62) | TCGA-A8-A09A-01 | Breast | breast invasive carcinoma | Female | <65 | I/II | Hormone Therapy | tamoxiphen | SD |
| MDH2 | SNV | Missense_Mutation | novel | c.754N>T | p.Ala252Ser | p.A252S | P40926 | protein_coding | deleterious(0) | probably_damaging(0.986) | TCGA-E9-A22H-01 | Breast | breast invasive carcinoma | Female | <65 | I/II | Chemotherapy | doxorubicin | SD |
| MDH2 | insertion | Frame_Shift_Ins | novel | c.789_790insGGGTT | p.Asp264GlyfsTer5 | p.D264Gfs*5 | P40926 | protein_coding | TCGA-BH-A0AY-01 | Breast | breast invasive carcinoma | Female | <65 | I/II | Chemotherapy | SD | |||
| MDH2 | insertion | Nonsense_Mutation | novel | c.791_792insGAGTCATTTTTGAGGG | p.Asp264GlufsTer5 | p.D264Efs*5 | P40926 | protein_coding | TCGA-BH-A0AY-01 | Breast | breast invasive carcinoma | Female | <65 | I/II | Chemotherapy | SD | |||
| MDH2 | SNV | Missense_Mutation | novel | c.596G>A | p.Gly199Asp | p.G199D | P40926 | protein_coding | deleterious(0) | probably_damaging(1) | TCGA-2W-A8YY-01 | Cervix | cervical & endocervical cancer | Female | <65 | I/II | Chemotherapy | cisplatin | CR |
| MDH2 | SNV | Missense_Mutation | c.509N>G | p.Thr170Arg | p.T170R | P40926 | protein_coding | deleterious(0) | probably_damaging(1) | TCGA-MY-A5BD-01 | Cervix | cervical & endocervical cancer | Female | <65 | I/II | Chemotherapy | cisplatin | CR | |
| MDH2 | SNV | Missense_Mutation | rs782546937 | c.502N>A | p.Gly168Ser | p.G168S | P40926 | protein_coding | deleterious(0) | probably_damaging(0.996) | TCGA-UC-A7PG-06 | Cervix | cervical & endocervical cancer | Female | <65 | III/IV | Chemotherapy | cisplatin | PD |
| MDH2 | SNV | Missense_Mutation | c.169G>C | p.Asp57His | p.D57H | P40926 | protein_coding | deleterious(0) | probably_damaging(0.994) | TCGA-CK-4948-01 | Colorectum | colon adenocarcinoma | Female | <65 | III/IV | Unknown | Unknown | SD | |
| MDH2 | SNV | Missense_Mutation | rs782472423 | c.328N>T | p.Arg110Trp | p.R110W | P40926 | protein_coding | deleterious(0) | probably_damaging(1) | TCGA-G4-6586-01 | Colorectum | colon adenocarcinoma | Female | >=65 | I/II | Unknown | Unknown | SD |
| MDH2 | SNV | Missense_Mutation | rs373091398 | c.898G>A | p.Glu300Lys | p.E300K | P40926 | protein_coding | tolerated(0.1) | benign(0.085) | TCGA-AG-A002-01 | Colorectum | rectum adenocarcinoma | Male | <65 | I/II | Unknown | Unknown | SD |
| Page: 1 2 3 |
Top |
Related drugs of malignant transformation related genes |
| Identification of chemicals and drugs interact with genes involved in malignant transfromation |
| (DGIdb 4.0) |
| Entrez ID | Symbol | Category | Interaction Types | Drug Claim Name | Drug Name | PMIDs |
| 4191 | MDH2 | NA | ALBUMIN | ALBUMIN HUMAN | 2932302 | |
| 4191 | MDH2 | NA | EXPECTORANT | 15225672 | ||
| 4191 | MDH2 | NA | GONADOTROPINS | 10026128 | ||
| 4191 | MDH2 | NA | ANTIOXIDANT | 15225672 | ||
| 4191 | MDH2 | NA | CISPLATIN | CISPLATIN | 15225672 |
| Page: 1 |

Copyright 2023-Present -The University of Texas Health Science Center at Houston |