
|
|||||
|
 | |
| |
| |
| |
| |
| |
|
Gene: MAP2K5 |
Gene summary for MAP2K5 |
| Gene information | Species | Human | Gene symbol | MAP2K5 | Gene ID | 5607 |
| Gene name | mitogen-activated protein kinase kinase 5 | |
| Gene Alias | HsT17454 | |
| Cytomap | 15q23 | |
| Gene Type | protein-coding | GO ID | GO:0000122 | UniProtAcc | Q13163 |
Top |
Malignant transformation analysis |
| Identification of the aberrant gene expression in precancerous and cancerous lesions by comparing the gene expression of stem-like cells in diseased tissues with normal stem cells |
| Entrez ID | Symbol | Replicates | Species | Organ | Tissue | Adj P-value | Log2FC | Malignancy |
| 5607 | MAP2K5 | CCI_2 | Human | Cervix | CC | 2.03e-03 | 5.63e-01 | 0.5249 |
| 5607 | MAP2K5 | CCI_3 | Human | Cervix | CC | 6.87e-08 | 6.08e-01 | 0.516 |
| 5607 | MAP2K5 | HTA11_3410_2000001011 | Human | Colorectum | AD | 1.26e-08 | -4.68e-01 | 0.0155 |
| 5607 | MAP2K5 | HTA11_866_3004761011 | Human | Colorectum | AD | 1.19e-03 | -4.38e-01 | 0.096 |
| 5607 | MAP2K5 | HTA11_10711_2000001011 | Human | Colorectum | AD | 2.28e-02 | -4.57e-01 | 0.0338 |
| 5607 | MAP2K5 | HTA11_7696_3000711011 | Human | Colorectum | AD | 1.98e-08 | -3.39e-01 | 0.0674 |
| 5607 | MAP2K5 | HTA11_99999971662_82457 | Human | Colorectum | MSS | 2.76e-24 | -6.12e-01 | 0.3859 |
| 5607 | MAP2K5 | HTA11_99999974143_84620 | Human | Colorectum | MSS | 6.47e-21 | -5.54e-01 | 0.3005 |
| 5607 | MAP2K5 | F007 | Human | Colorectum | FAP | 5.49e-07 | -4.47e-01 | 0.1176 |
| 5607 | MAP2K5 | A001-C-207 | Human | Colorectum | FAP | 2.03e-03 | -3.30e-01 | 0.1278 |
| 5607 | MAP2K5 | A015-C-203 | Human | Colorectum | FAP | 4.54e-49 | -7.04e-01 | -0.1294 |
| 5607 | MAP2K5 | A015-C-204 | Human | Colorectum | FAP | 5.01e-13 | -5.76e-01 | -0.0228 |
| 5607 | MAP2K5 | A014-C-040 | Human | Colorectum | FAP | 5.26e-05 | -4.02e-01 | -0.1184 |
| 5607 | MAP2K5 | A002-C-201 | Human | Colorectum | FAP | 3.40e-17 | -3.81e-01 | 0.0324 |
| 5607 | MAP2K5 | A002-C-203 | Human | Colorectum | FAP | 8.66e-05 | -2.74e-02 | 0.2786 |
| 5607 | MAP2K5 | A001-C-119 | Human | Colorectum | FAP | 1.28e-14 | -7.25e-01 | -0.1557 |
| 5607 | MAP2K5 | A001-C-108 | Human | Colorectum | FAP | 2.64e-32 | -5.26e-01 | -0.0272 |
| 5607 | MAP2K5 | A002-C-205 | Human | Colorectum | FAP | 5.40e-30 | -7.12e-01 | -0.1236 |
| 5607 | MAP2K5 | A001-C-104 | Human | Colorectum | FAP | 1.20e-13 | -4.02e-01 | 0.0184 |
| 5607 | MAP2K5 | A015-C-005 | Human | Colorectum | FAP | 5.65e-05 | -3.84e-01 | -0.0336 |
| Page: 1 2 3 4 5 6 |
| Tissue | Expression Dynamics | Abbreviation |
| Cervix | 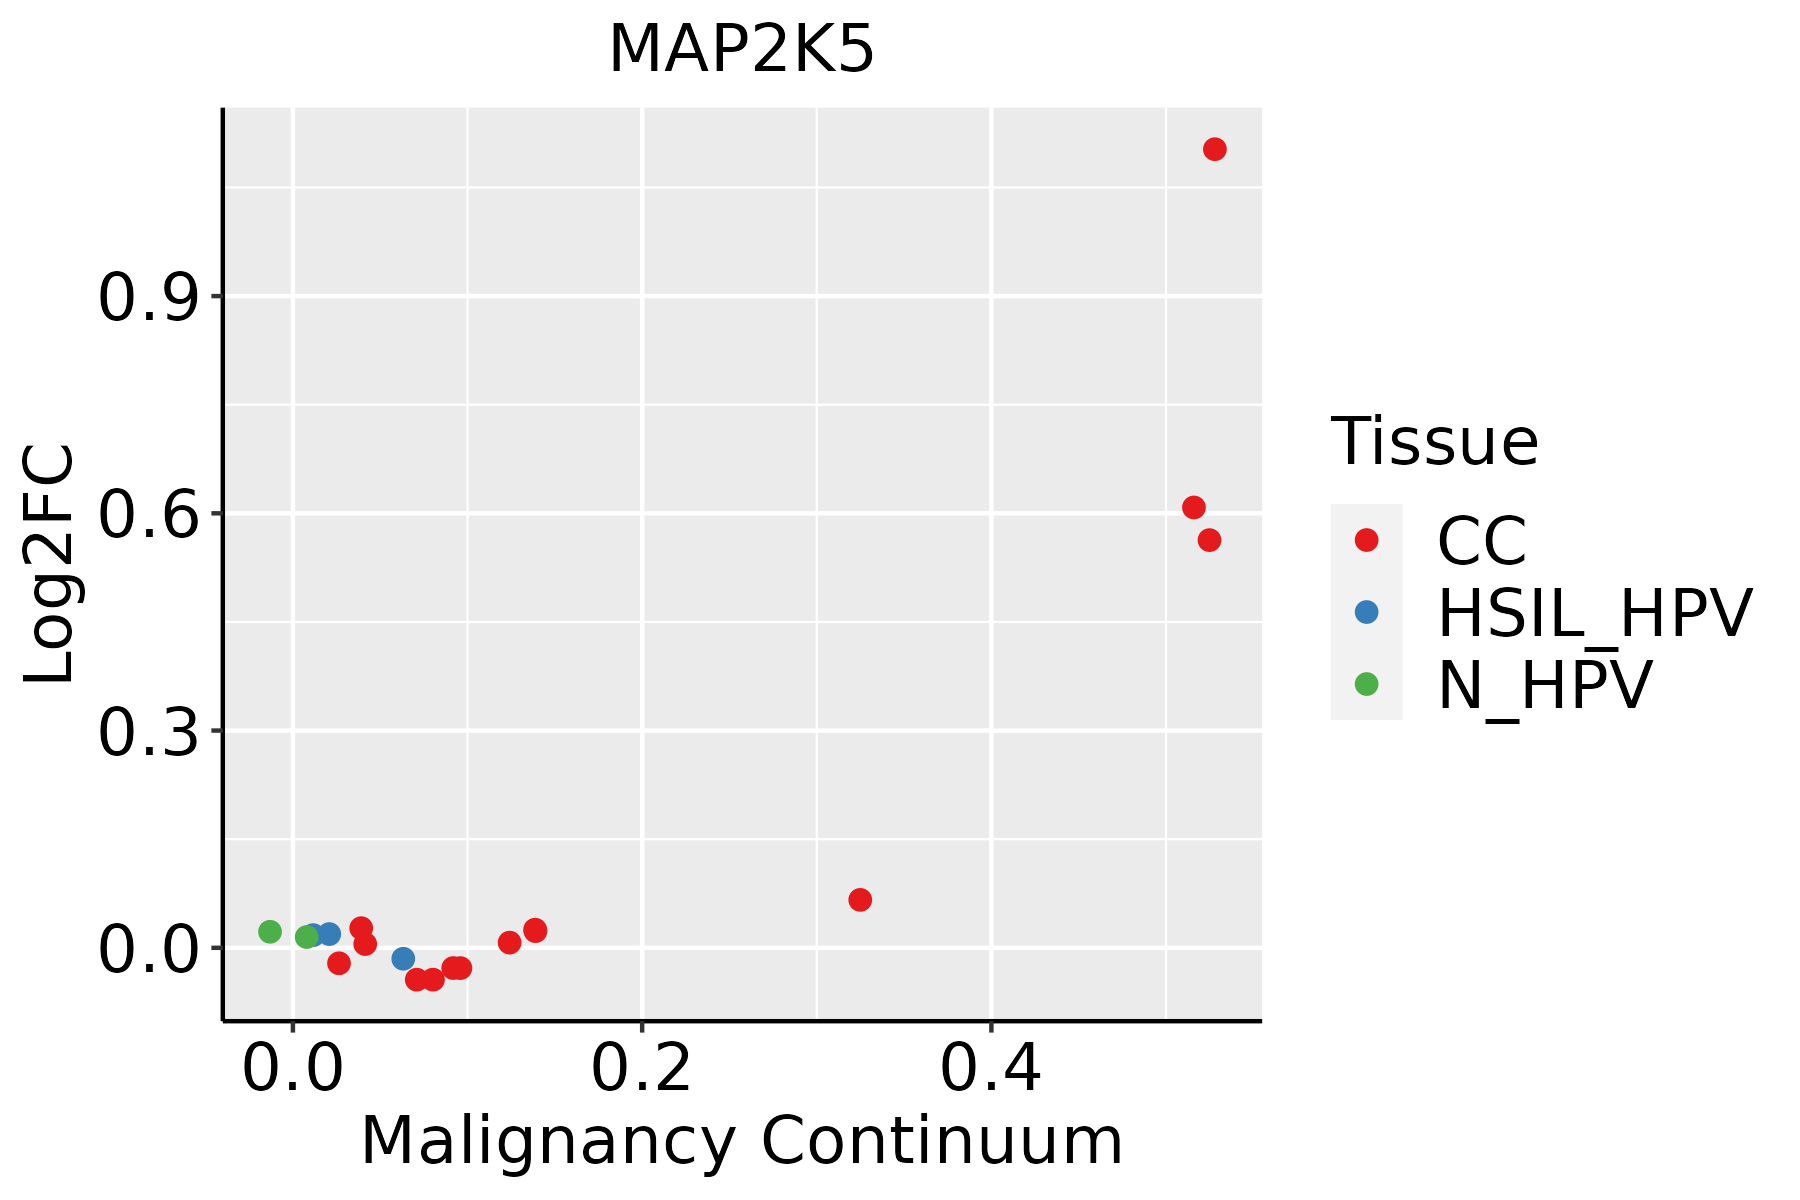 | CC: Cervix cancer |
| HSIL_HPV: HPV-infected high-grade squamous intraepithelial lesions | ||
| N_HPV: HPV-infected normal cervix | ||
| Colorectum (GSE201348) | 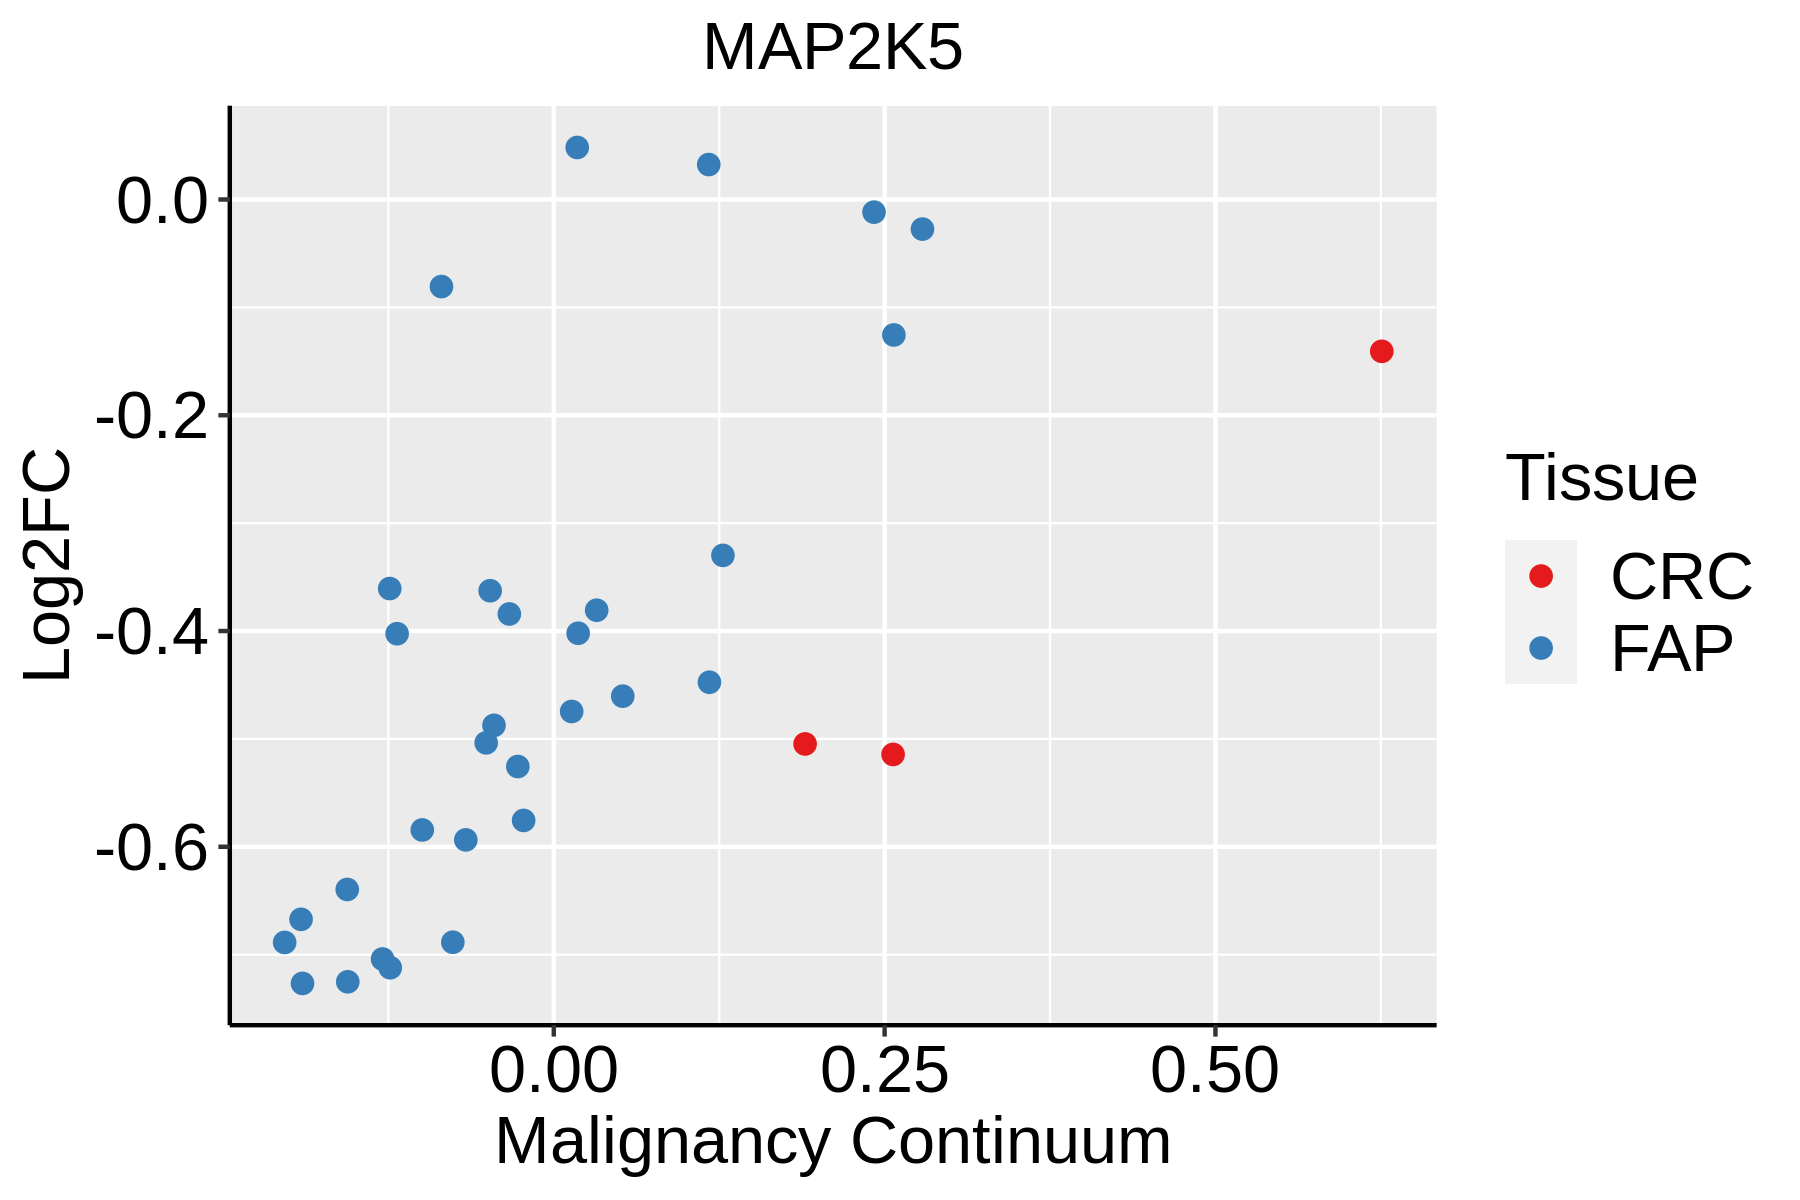 | FAP: Familial adenomatous polyposis |
| CRC: Colorectal cancer | ||
| Colorectum (HTA11) |  | AD: Adenomas |
| SER: Sessile serrated lesions | ||
| MSI-H: Microsatellite-high colorectal cancer | ||
| MSS: Microsatellite stable colorectal cancer | ||
| Esophagus |  | ESCC: Esophageal squamous cell carcinoma |
| HGIN: High-grade intraepithelial neoplasias | ||
| LGIN: Low-grade intraepithelial neoplasias | ||
| Lung |  | AAH: Atypical adenomatous hyperplasia |
| AIS: Adenocarcinoma in situ | ||
| IAC: Invasive lung adenocarcinoma | ||
| MIA: Minimally invasive adenocarcinoma |
| ∗log2FC in expression of this searched gene in stem-like cells from each diseased tissue sample relative to stem-like cells in normal samples in each tissue plotted against the malignancy continuum. Samples are colored based on if they are from different disease stage. |
Top |
Malignant transformation related pathway analysis |
| Find out the enriched GO biological processes and KEGG pathways involved in transition from healthy to precancer to cancer |
| Tissue | Disease Stage | Enriched GO biological Processes |
| Colorectum | AD |  |
| Colorectum | SER |  |
| Colorectum | MSS |  |
| Colorectum | MSI-H |  |
| Colorectum | FAP |  |
| ∗Top 15 enriched GO BP terms are showed in the bar plot of each disease state in each tissue. Each row represents a significant GO biological process which is colored according to the -log10(p.adjust). |
| Page: 1 2 3 4 5 6 7 8 9 |
| GO ID | Tissue | Disease Stage | Description | Gene Ratio | Bg Ratio | pvalue | p.adjust | Count |
| GO:0052548 | Colorectum | AD | regulation of endopeptidase activity | 124/3918 | 432/18723 | 6.58e-05 | 1.07e-03 | 124 |
| GO:0090132 | Colorectum | AD | epithelium migration | 105/3918 | 360/18723 | 1.18e-04 | 1.73e-03 | 105 |
| GO:0010632 | Colorectum | AD | regulation of epithelial cell migration | 88/3918 | 292/18723 | 1.19e-04 | 1.75e-03 | 88 |
| GO:0033674 | Colorectum | AD | positive regulation of kinase activity | 131/3918 | 467/18723 | 1.28e-04 | 1.85e-03 | 131 |
| GO:0010631 | Colorectum | AD | epithelial cell migration | 104/3918 | 357/18723 | 1.33e-04 | 1.90e-03 | 104 |
| GO:0090130 | Colorectum | AD | tissue migration | 105/3918 | 365/18723 | 2.10e-04 | 2.77e-03 | 105 |
| GO:0097191 | Colorectum | AD | extrinsic apoptotic signaling pathway | 68/3918 | 219/18723 | 2.64e-04 | 3.27e-03 | 68 |
| GO:0043154 | Colorectum | AD | negative regulation of cysteine-type endopeptidase activity involved in apoptotic process | 30/3918 | 78/18723 | 2.95e-04 | 3.59e-03 | 30 |
| GO:0030307 | Colorectum | AD | positive regulation of cell growth | 54/3918 | 166/18723 | 3.08e-04 | 3.69e-03 | 54 |
| GO:0045927 | Colorectum | AD | positive regulation of growth | 77/3918 | 259/18723 | 4.82e-04 | 5.27e-03 | 77 |
| GO:0045860 | Colorectum | AD | positive regulation of protein kinase activity | 107/3918 | 386/18723 | 8.01e-04 | 7.92e-03 | 107 |
| GO:0072567 | Colorectum | AD | chemokine (C-X-C motif) ligand 2 production | 11/3918 | 20/18723 | 8.39e-04 | 8.21e-03 | 11 |
| GO:2000341 | Colorectum | AD | regulation of chemokine (C-X-C motif) ligand 2 production | 11/3918 | 20/18723 | 8.39e-04 | 8.21e-03 | 11 |
| GO:2000117 | Colorectum | AD | negative regulation of cysteine-type endopeptidase activity | 31/3918 | 86/18723 | 8.67e-04 | 8.45e-03 | 31 |
| GO:0050673 | Colorectum | AD | epithelial cell proliferation | 119/3918 | 437/18723 | 8.75e-04 | 8.51e-03 | 119 |
| GO:0071900 | Colorectum | AD | regulation of protein serine/threonine kinase activity | 98/3918 | 359/18723 | 2.18e-03 | 1.73e-02 | 98 |
| GO:0043542 | Colorectum | AD | endothelial cell migration | 78/3918 | 279/18723 | 2.97e-03 | 2.22e-02 | 78 |
| GO:0071902 | Colorectum | AD | positive regulation of protein serine/threonine kinase activity | 58/3918 | 200/18723 | 4.09e-03 | 2.84e-02 | 58 |
| GO:0071498 | Colorectum | AD | cellular response to fluid shear stress | 10/3918 | 21/18723 | 5.71e-03 | 3.64e-02 | 10 |
| GO:0007369 | Colorectum | AD | gastrulation | 53/3918 | 185/18723 | 7.60e-03 | 4.60e-02 | 53 |
| Page: 1 2 3 4 5 6 7 8 9 10 11 12 13 14 15 |
| Pathway ID | Tissue | Disease Stage | Description | Gene Ratio | Bg Ratio | pvalue | p.adjust | qvalue | Count |
| hsa0541820 | Cervix | CC | Fluid shear stress and atherosclerosis | 50/1267 | 139/8465 | 5.71e-10 | 1.32e-08 | 7.81e-09 | 50 |
| hsa0472214 | Cervix | CC | Neurotrophin signaling pathway | 32/1267 | 119/8465 | 5.01e-04 | 2.42e-03 | 1.43e-03 | 32 |
| hsa040109 | Cervix | CC | MAPK signaling pathway | 62/1267 | 302/8465 | 4.89e-03 | 1.67e-02 | 9.86e-03 | 62 |
| hsa04540 | Cervix | CC | Gap junction | 22/1267 | 88/8465 | 9.07e-03 | 2.85e-02 | 1.69e-02 | 22 |
| hsa049218 | Cervix | CC | Oxytocin signaling pathway | 34/1267 | 154/8465 | 1.12e-02 | 3.42e-02 | 2.02e-02 | 34 |
| hsa05418110 | Cervix | CC | Fluid shear stress and atherosclerosis | 50/1267 | 139/8465 | 5.71e-10 | 1.32e-08 | 7.81e-09 | 50 |
| hsa0472215 | Cervix | CC | Neurotrophin signaling pathway | 32/1267 | 119/8465 | 5.01e-04 | 2.42e-03 | 1.43e-03 | 32 |
| hsa0401012 | Cervix | CC | MAPK signaling pathway | 62/1267 | 302/8465 | 4.89e-03 | 1.67e-02 | 9.86e-03 | 62 |
| hsa045401 | Cervix | CC | Gap junction | 22/1267 | 88/8465 | 9.07e-03 | 2.85e-02 | 1.69e-02 | 22 |
| hsa0492111 | Cervix | CC | Oxytocin signaling pathway | 34/1267 | 154/8465 | 1.12e-02 | 3.42e-02 | 2.02e-02 | 34 |
| hsa04722 | Colorectum | AD | Neurotrophin signaling pathway | 50/2092 | 119/8465 | 2.28e-05 | 2.24e-04 | 1.43e-04 | 50 |
| hsa05418 | Colorectum | AD | Fluid shear stress and atherosclerosis | 54/2092 | 139/8465 | 1.41e-04 | 1.16e-03 | 7.37e-04 | 54 |
| hsa047221 | Colorectum | AD | Neurotrophin signaling pathway | 50/2092 | 119/8465 | 2.28e-05 | 2.24e-04 | 1.43e-04 | 50 |
| hsa054181 | Colorectum | AD | Fluid shear stress and atherosclerosis | 54/2092 | 139/8465 | 1.41e-04 | 1.16e-03 | 7.37e-04 | 54 |
| hsa054184 | Colorectum | MSS | Fluid shear stress and atherosclerosis | 51/1875 | 139/8465 | 6.06e-05 | 5.80e-04 | 3.55e-04 | 51 |
| hsa047224 | Colorectum | MSS | Neurotrophin signaling pathway | 45/1875 | 119/8465 | 7.04e-05 | 6.55e-04 | 4.02e-04 | 45 |
| hsa054185 | Colorectum | MSS | Fluid shear stress and atherosclerosis | 51/1875 | 139/8465 | 6.06e-05 | 5.80e-04 | 3.55e-04 | 51 |
| hsa047225 | Colorectum | MSS | Neurotrophin signaling pathway | 45/1875 | 119/8465 | 7.04e-05 | 6.55e-04 | 4.02e-04 | 45 |
| hsa054188 | Colorectum | FAP | Fluid shear stress and atherosclerosis | 45/1404 | 139/8465 | 3.05e-06 | 4.63e-05 | 2.81e-05 | 45 |
| hsa047226 | Colorectum | FAP | Neurotrophin signaling pathway | 38/1404 | 119/8465 | 2.49e-05 | 2.78e-04 | 1.69e-04 | 38 |
| Page: 1 2 3 |
Top |
Cell-cell communication analysis |
| Identification of potential cell-cell interactions between two cell types and their ligand-receptor pairs for different disease states |
| Ligand | Receptor | LRpair | Pathway | Tissue | Disease Stage |
| Page: 1 |
Top |
Single-cell gene regulatory network inference analysis |
| Find out the significant the regulons (TFs) and the target genes of each regulon across cell types for different disease states |
| TF | Cell Type | Tissue | Disease Stage | Target Gene | RSS | Regulon Activity |
| ∗The dot plots of a searched regulon are shown for all cell subpopulations in each disease state of each tissue based on the regulon specific score inferred using pySCENIC and by calculating the average expression. |
| Page: 1 |
Top |
Somatic mutation of malignant transformation related genes |
| Annotation of somatic variants for genes involved in malignant transformation |
| Hugo Symbol | Variant Class | Variant Classification | dbSNP RS | HGVSc | HGVSp | HGVSp Short | SWISSPROT | BIOTYPE | SIFT | PolyPhen | Tumor Sample Barcode | Tissue | Histology | Sex | Age | Stage | Therapy Types | Drugs | Outcome |
| MAP2K5 | SNV | Missense_Mutation | rs766339386 | c.650N>G | p.Tyr217Cys | p.Y217C | Q13163 | protein_coding | deleterious(0.01) | probably_damaging(0.921) | TCGA-D8-A1J8-01 | Breast | breast invasive carcinoma | Female | >=65 | I/II | Hormone Therapy | nolvadex | SD |
| MAP2K5 | SNV | Missense_Mutation | novel | c.532N>T | p.Gly178Cys | p.G178C | Q13163 | protein_coding | deleterious(0) | probably_damaging(1) | TCGA-OL-A97C-01 | Breast | breast invasive carcinoma | Female | >=65 | I/II | Unknown | Unknown | PD |
| MAP2K5 | deletion | In_Frame_Del | c.78_83delNNNNNN | p.Ser26_Ala28delinsArg | p.S26_A28delinsR | Q13163 | protein_coding | TCGA-A8-A06Q-01 | Breast | breast invasive carcinoma | Female | <65 | III/IV | Unknown | Unknown | SD | |||
| MAP2K5 | SNV | Missense_Mutation | novel | c.218G>C | p.Arg73Thr | p.R73T | Q13163 | protein_coding | deleterious(0) | probably_damaging(0.977) | TCGA-HM-A4S6-01 | Cervix | cervical & endocervical cancer | Female | <65 | III/IV | Chemotherapy | cisplatin | CR |
| MAP2K5 | SNV | Missense_Mutation | rs532904399 | c.343N>T | p.Arg115Trp | p.R115W | Q13163 | protein_coding | deleterious(0) | probably_damaging(0.972) | TCGA-A6-5665-01 | Colorectum | colon adenocarcinoma | Female | >=65 | I/II | Unknown | Unknown | PD |
| MAP2K5 | SNV | Missense_Mutation | rs771473899 | c.320N>T | p.Arg107Ile | p.R107I | Q13163 | protein_coding | deleterious(0) | possibly_damaging(0.809) | TCGA-A6-6782-01 | Colorectum | colon adenocarcinoma | Male | >=65 | I/II | Unknown | Unknown | SD |
| MAP2K5 | SNV | Missense_Mutation | c.82G>A | p.Ala28Thr | p.A28T | Q13163 | protein_coding | tolerated(0.24) | benign(0.18) | TCGA-AA-3977-01 | Colorectum | colon adenocarcinoma | Male | >=65 | I/II | Unknown | Unknown | SD | |
| MAP2K5 | SNV | Missense_Mutation | novel | c.206N>A | p.Arg69Gln | p.R69Q | Q13163 | protein_coding | deleterious(0.01) | probably_damaging(0.939) | TCGA-AA-3984-01 | Colorectum | colon adenocarcinoma | Female | <65 | I/II | Unknown | Unknown | SD |
| MAP2K5 | SNV | Missense_Mutation | c.971N>T | p.Ala324Val | p.A324V | Q13163 | protein_coding | deleterious(0) | probably_damaging(0.999) | TCGA-AG-A002-01 | Colorectum | rectum adenocarcinoma | Male | <65 | I/II | Unknown | Unknown | SD | |
| MAP2K5 | SNV | Missense_Mutation | novel | c.40N>C | p.Asn14His | p.N14H | Q13163 | protein_coding | deleterious_low_confidence(0.02) | benign(0) | TCGA-F5-6814-01 | Colorectum | rectum adenocarcinoma | Male | <65 | I/II | Unknown | Unknown | SD |
| Page: 1 2 3 4 |
Top |
Related drugs of malignant transformation related genes |
| Identification of chemicals and drugs interact with genes involved in malignant transfromation |
| (DGIdb 4.0) |
| Entrez ID | Symbol | Category | Interaction Types | Drug Claim Name | Drug Name | PMIDs |
| 5607 | MAP2K5 | KINASE, SERINE THREONINE KINASE, TYROSINE KINASE, ENZYME, DRUGGABLE GENOME | inhibitor | AZD6244 | SELUMETINIB | |
| 5607 | MAP2K5 | KINASE, SERINE THREONINE KINASE, TYROSINE KINASE, ENZYME, DRUGGABLE GENOME | inhibitor | SELUMETINIB | SELUMETINIB | |
| 5607 | MAP2K5 | KINASE, SERINE THREONINE KINASE, TYROSINE KINASE, ENZYME, DRUGGABLE GENOME | WX-554 | WX-554 | ||
| 5607 | MAP2K5 | KINASE, SERINE THREONINE KINASE, TYROSINE KINASE, ENZYME, DRUGGABLE GENOME | inhibitor | TRAMETINIB | TRAMETINIB | |
| 5607 | MAP2K5 | KINASE, SERINE THREONINE KINASE, TYROSINE KINASE, ENZYME, DRUGGABLE GENOME | inhibitor | 328083482 | ||
| 5607 | MAP2K5 | KINASE, SERINE THREONINE KINASE, TYROSINE KINASE, ENZYME, DRUGGABLE GENOME | inhibitor | MEK162 | BINIMETINIB | |
| 5607 | MAP2K5 | KINASE, SERINE THREONINE KINASE, TYROSINE KINASE, ENZYME, DRUGGABLE GENOME | inhibitor | DABRAFENIB MESYLATE | ||
| 5607 | MAP2K5 | KINASE, SERINE THREONINE KINASE, TYROSINE KINASE, ENZYME, DRUGGABLE GENOME | inhibitor | 249565744 | ||
| 5607 | MAP2K5 | KINASE, SERINE THREONINE KINASE, TYROSINE KINASE, ENZYME, DRUGGABLE GENOME | inhibitor | GDC-0973 | COBIMETINIB | |
| 5607 | MAP2K5 | KINASE, SERINE THREONINE KINASE, TYROSINE KINASE, ENZYME, DRUGGABLE GENOME | inhibitor | BAY869766 |
| Page: 1 2 |

Copyright 2023-Present -The University of Texas Health Science Center at Houston |