
|
|||||
|
 | |
| |
| |
| |
| |
| |
|
Gene: MALSU1 |
Gene summary for MALSU1 |
| Gene information | Species | Human | Gene symbol | MALSU1 | Gene ID | 115416 |
| Gene name | mitochondrial assembly of ribosomal large subunit 1 | |
| Gene Alias | C7orf30 | |
| Cytomap | 7p15.3 | |
| Gene Type | protein-coding | GO ID | GO:0006412 | UniProtAcc | Q96EH3 |
Top |
Malignant transformation analysis |
| Identification of the aberrant gene expression in precancerous and cancerous lesions by comparing the gene expression of stem-like cells in diseased tissues with normal stem cells |
| Entrez ID | Symbol | Replicates | Species | Organ | Tissue | Adj P-value | Log2FC | Malignancy |
| 115416 | MALSU1 | LZE2T | Human | Esophagus | ESCC | 5.54e-08 | 8.20e-01 | 0.082 |
| 115416 | MALSU1 | LZE4T | Human | Esophagus | ESCC | 2.14e-19 | 6.39e-01 | 0.0811 |
| 115416 | MALSU1 | LZE7T | Human | Esophagus | ESCC | 4.09e-10 | 5.28e-01 | 0.0667 |
| 115416 | MALSU1 | LZE8T | Human | Esophagus | ESCC | 5.50e-14 | 3.88e-01 | 0.067 |
| 115416 | MALSU1 | LZE20T | Human | Esophagus | ESCC | 9.27e-13 | 3.81e-01 | 0.0662 |
| 115416 | MALSU1 | LZE22D1 | Human | Esophagus | HGIN | 1.58e-04 | 3.59e-01 | 0.0595 |
| 115416 | MALSU1 | LZE22T | Human | Esophagus | ESCC | 1.79e-06 | 5.92e-01 | 0.068 |
| 115416 | MALSU1 | LZE24T | Human | Esophagus | ESCC | 3.43e-26 | 7.40e-01 | 0.0596 |
| 115416 | MALSU1 | LZE6T | Human | Esophagus | ESCC | 5.82e-06 | 5.28e-01 | 0.0845 |
| 115416 | MALSU1 | P1T-E | Human | Esophagus | ESCC | 1.84e-10 | 5.52e-01 | 0.0875 |
| 115416 | MALSU1 | P2T-E | Human | Esophagus | ESCC | 4.67e-34 | 6.97e-01 | 0.1177 |
| 115416 | MALSU1 | P4T-E | Human | Esophagus | ESCC | 9.92e-41 | 1.18e+00 | 0.1323 |
| 115416 | MALSU1 | P5T-E | Human | Esophagus | ESCC | 1.49e-43 | 9.60e-01 | 0.1327 |
| 115416 | MALSU1 | P8T-E | Human | Esophagus | ESCC | 1.34e-32 | 7.57e-01 | 0.0889 |
| 115416 | MALSU1 | P9T-E | Human | Esophagus | ESCC | 3.68e-31 | 7.82e-01 | 0.1131 |
| 115416 | MALSU1 | P10T-E | Human | Esophagus | ESCC | 5.73e-34 | 6.64e-01 | 0.116 |
| 115416 | MALSU1 | P11T-E | Human | Esophagus | ESCC | 9.73e-21 | 9.30e-01 | 0.1426 |
| 115416 | MALSU1 | P12T-E | Human | Esophagus | ESCC | 3.93e-42 | 8.16e-01 | 0.1122 |
| 115416 | MALSU1 | P15T-E | Human | Esophagus | ESCC | 1.18e-37 | 8.16e-01 | 0.1149 |
| 115416 | MALSU1 | P16T-E | Human | Esophagus | ESCC | 2.95e-42 | 8.74e-01 | 0.1153 |
| Page: 1 2 3 4 5 6 7 |
| Tissue | Expression Dynamics | Abbreviation |
| Esophagus | 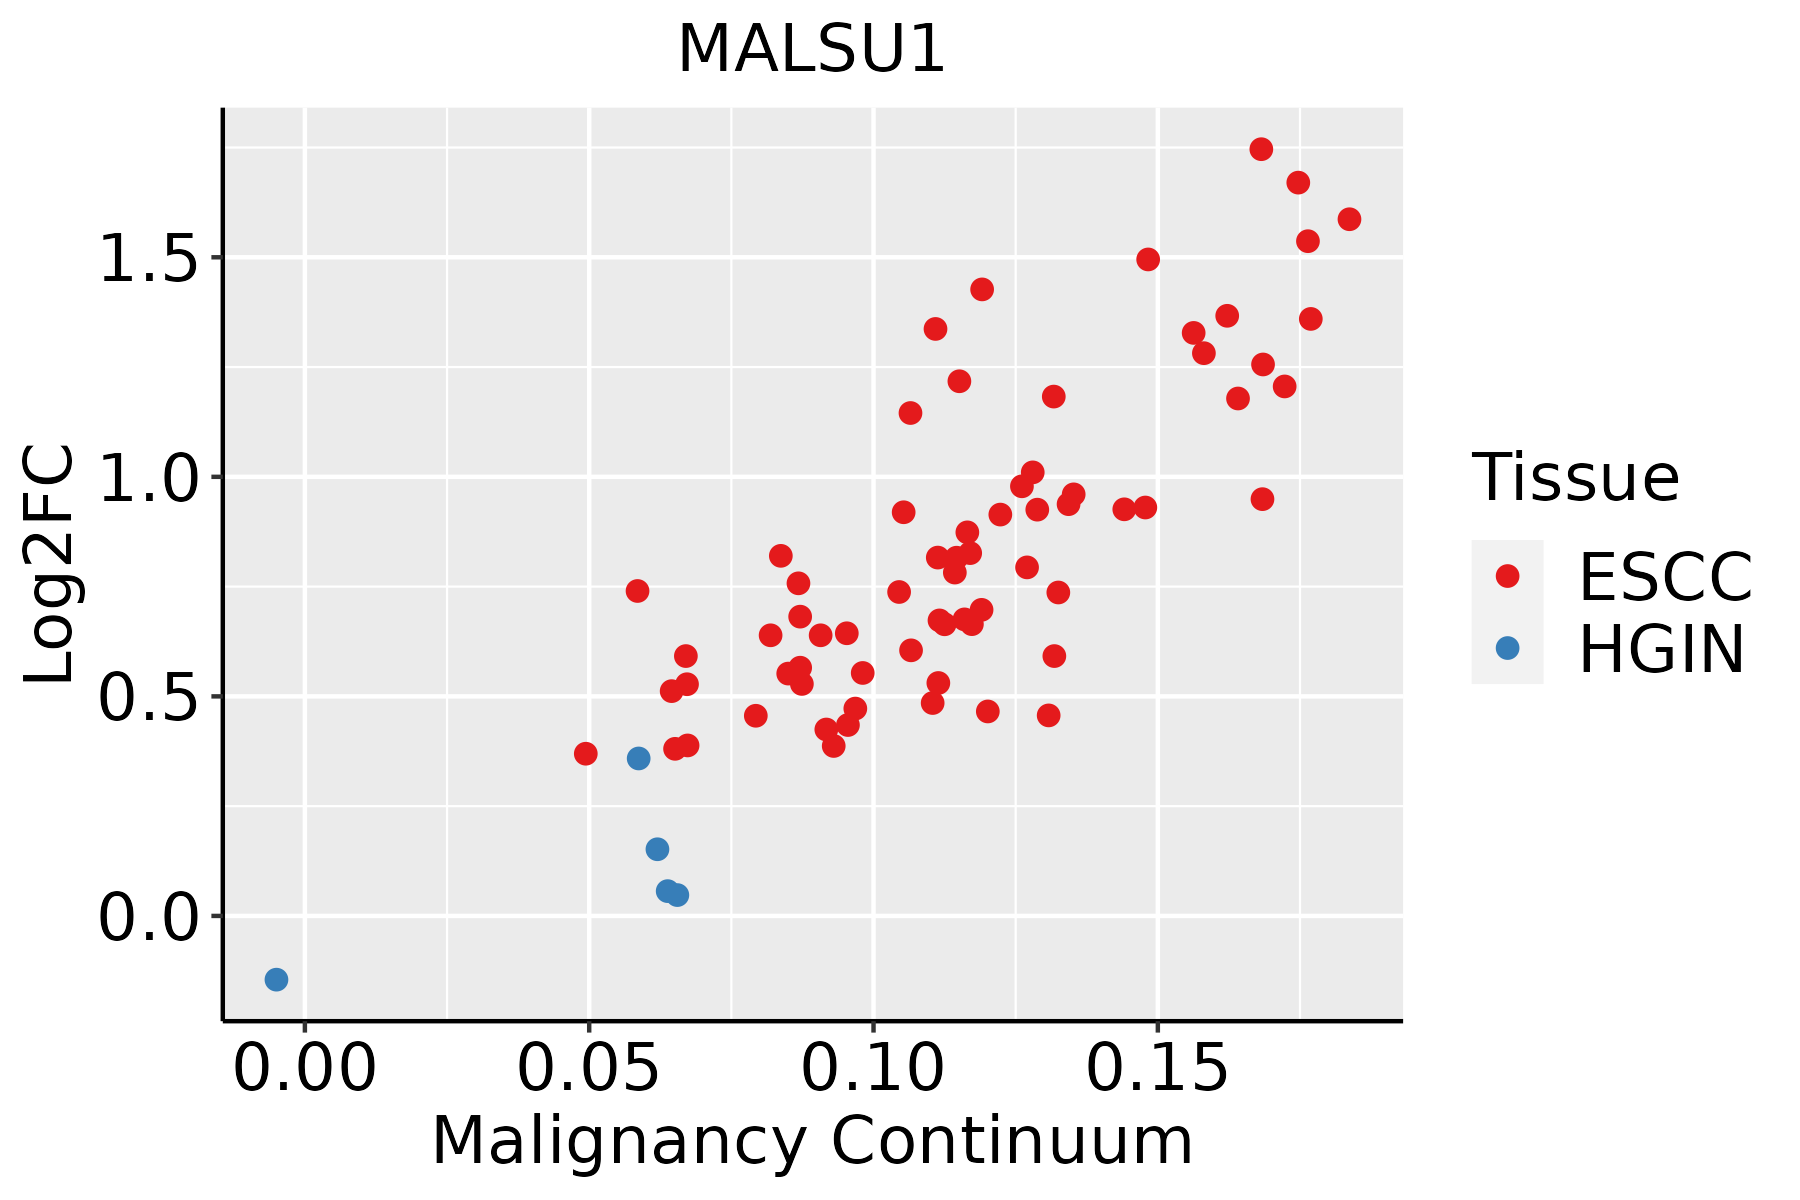 | ESCC: Esophageal squamous cell carcinoma |
| HGIN: High-grade intraepithelial neoplasias | ||
| LGIN: Low-grade intraepithelial neoplasias | ||
| Liver | 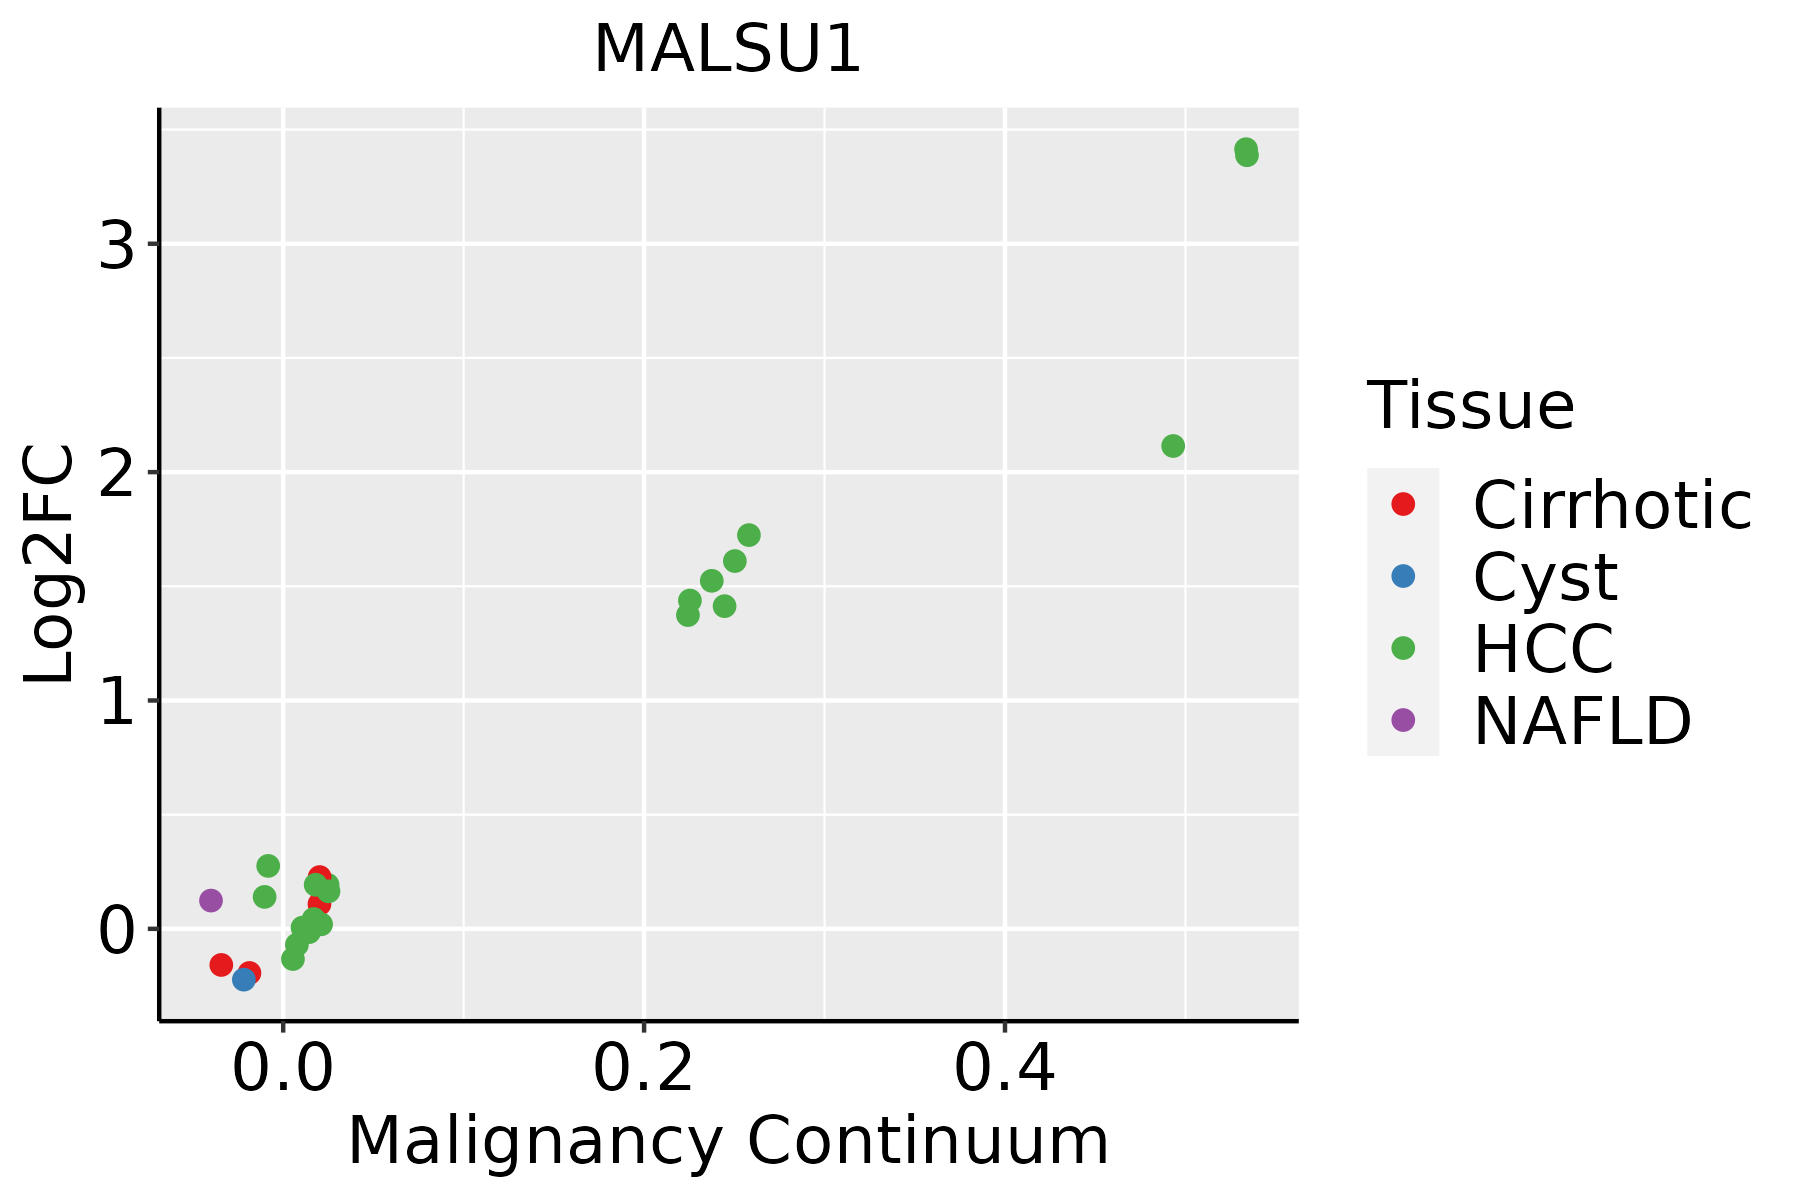 | HCC: Hepatocellular carcinoma |
| NAFLD: Non-alcoholic fatty liver disease | ||
| Oral Cavity | 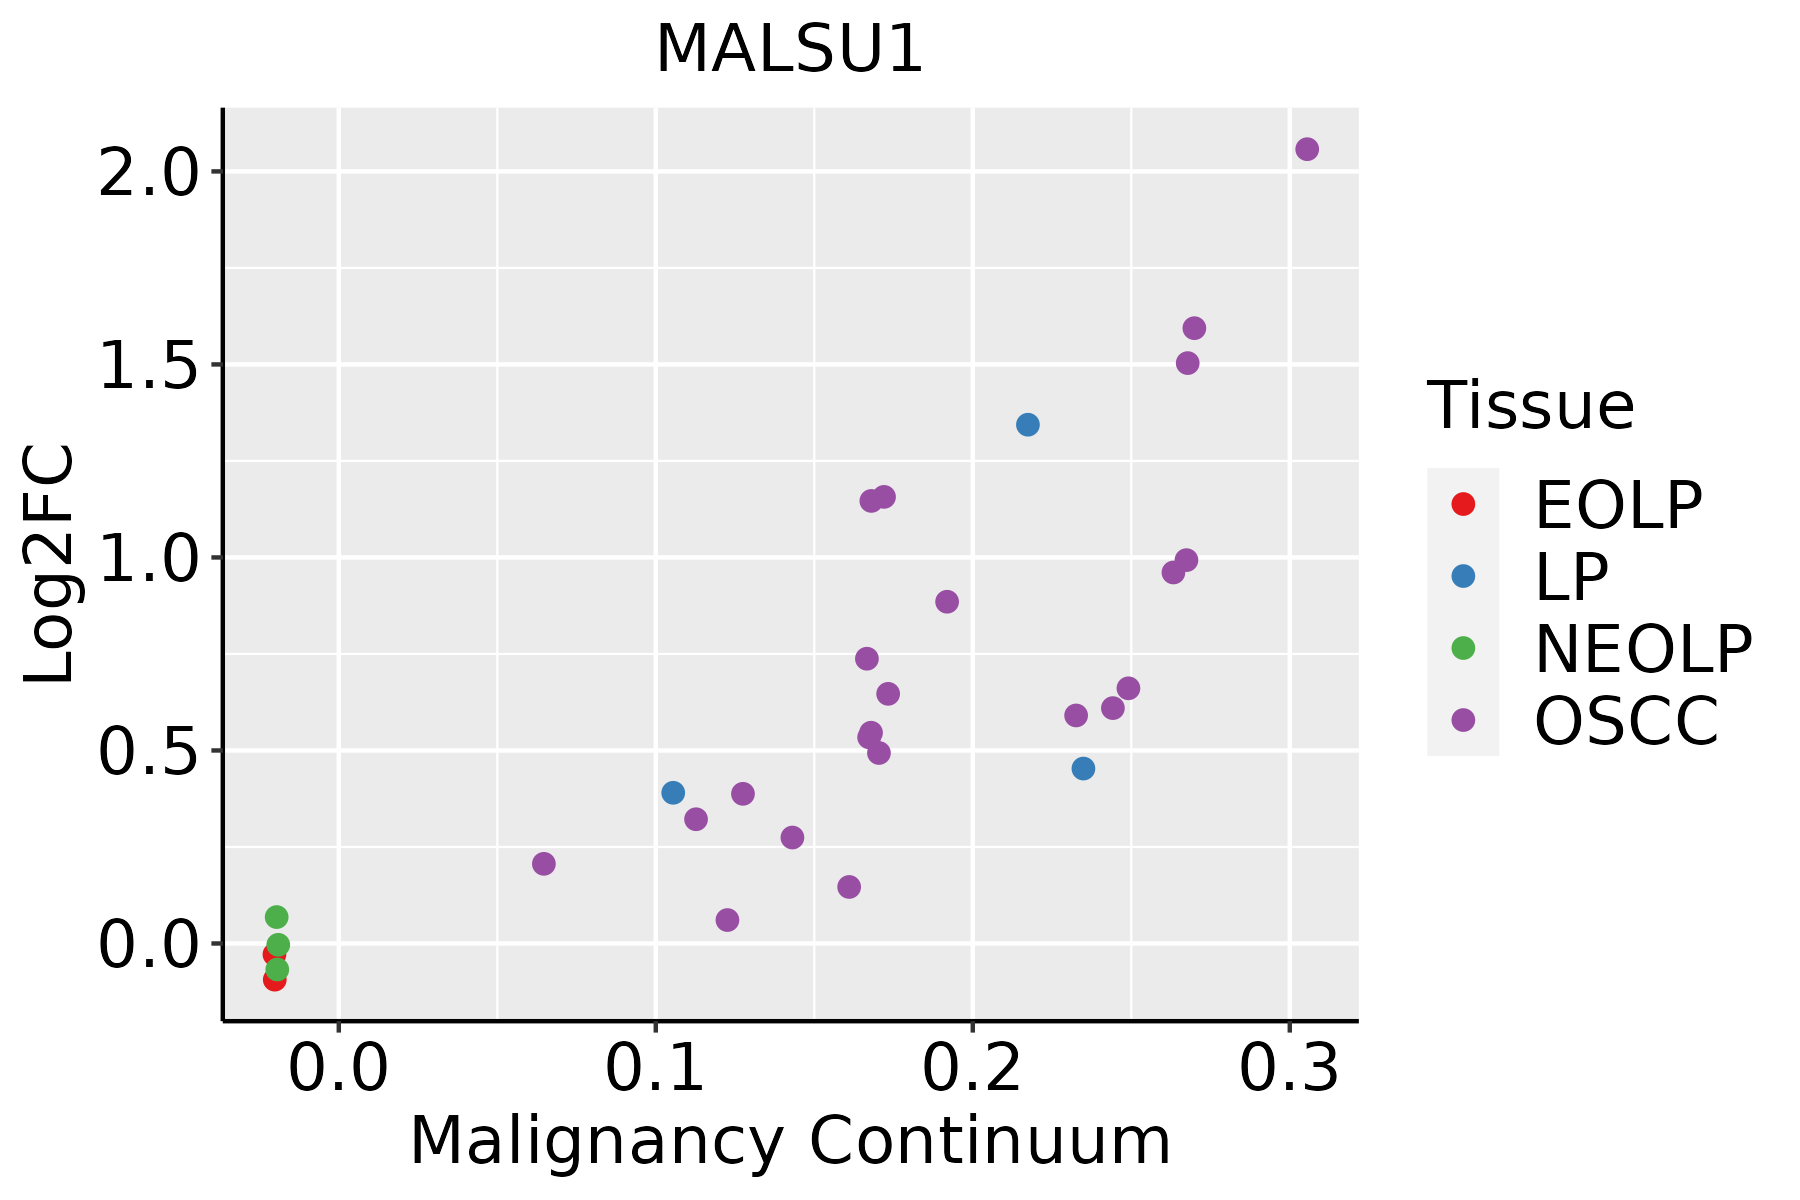 | EOLP: Erosive Oral lichen planus |
| LP: leukoplakia | ||
| NEOLP: Non-erosive oral lichen planus | ||
| OSCC: Oral squamous cell carcinoma | ||
| Skin | 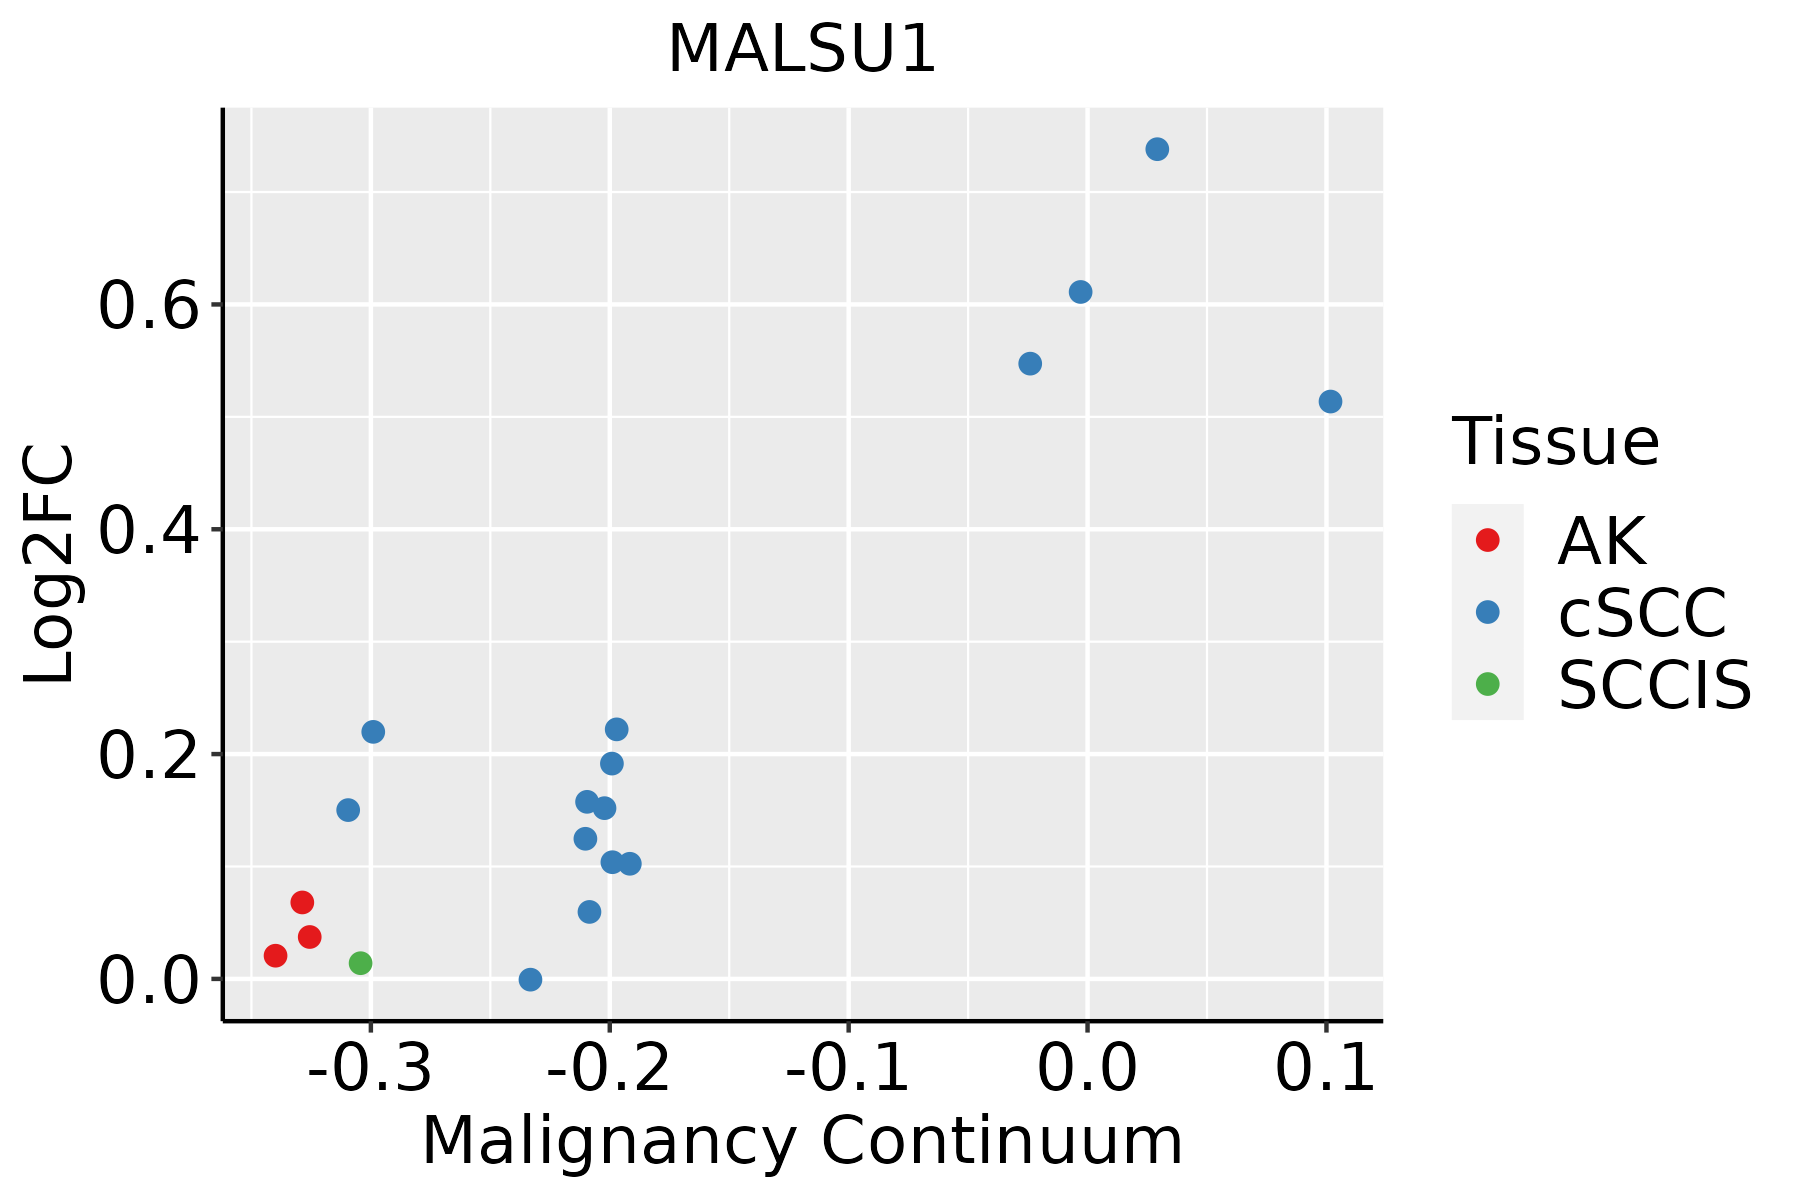 | AK: Actinic keratosis |
| cSCC: Cutaneous squamous cell carcinoma | ||
| SCCIS:squamous cell carcinoma in situ | ||
| Thyroid | 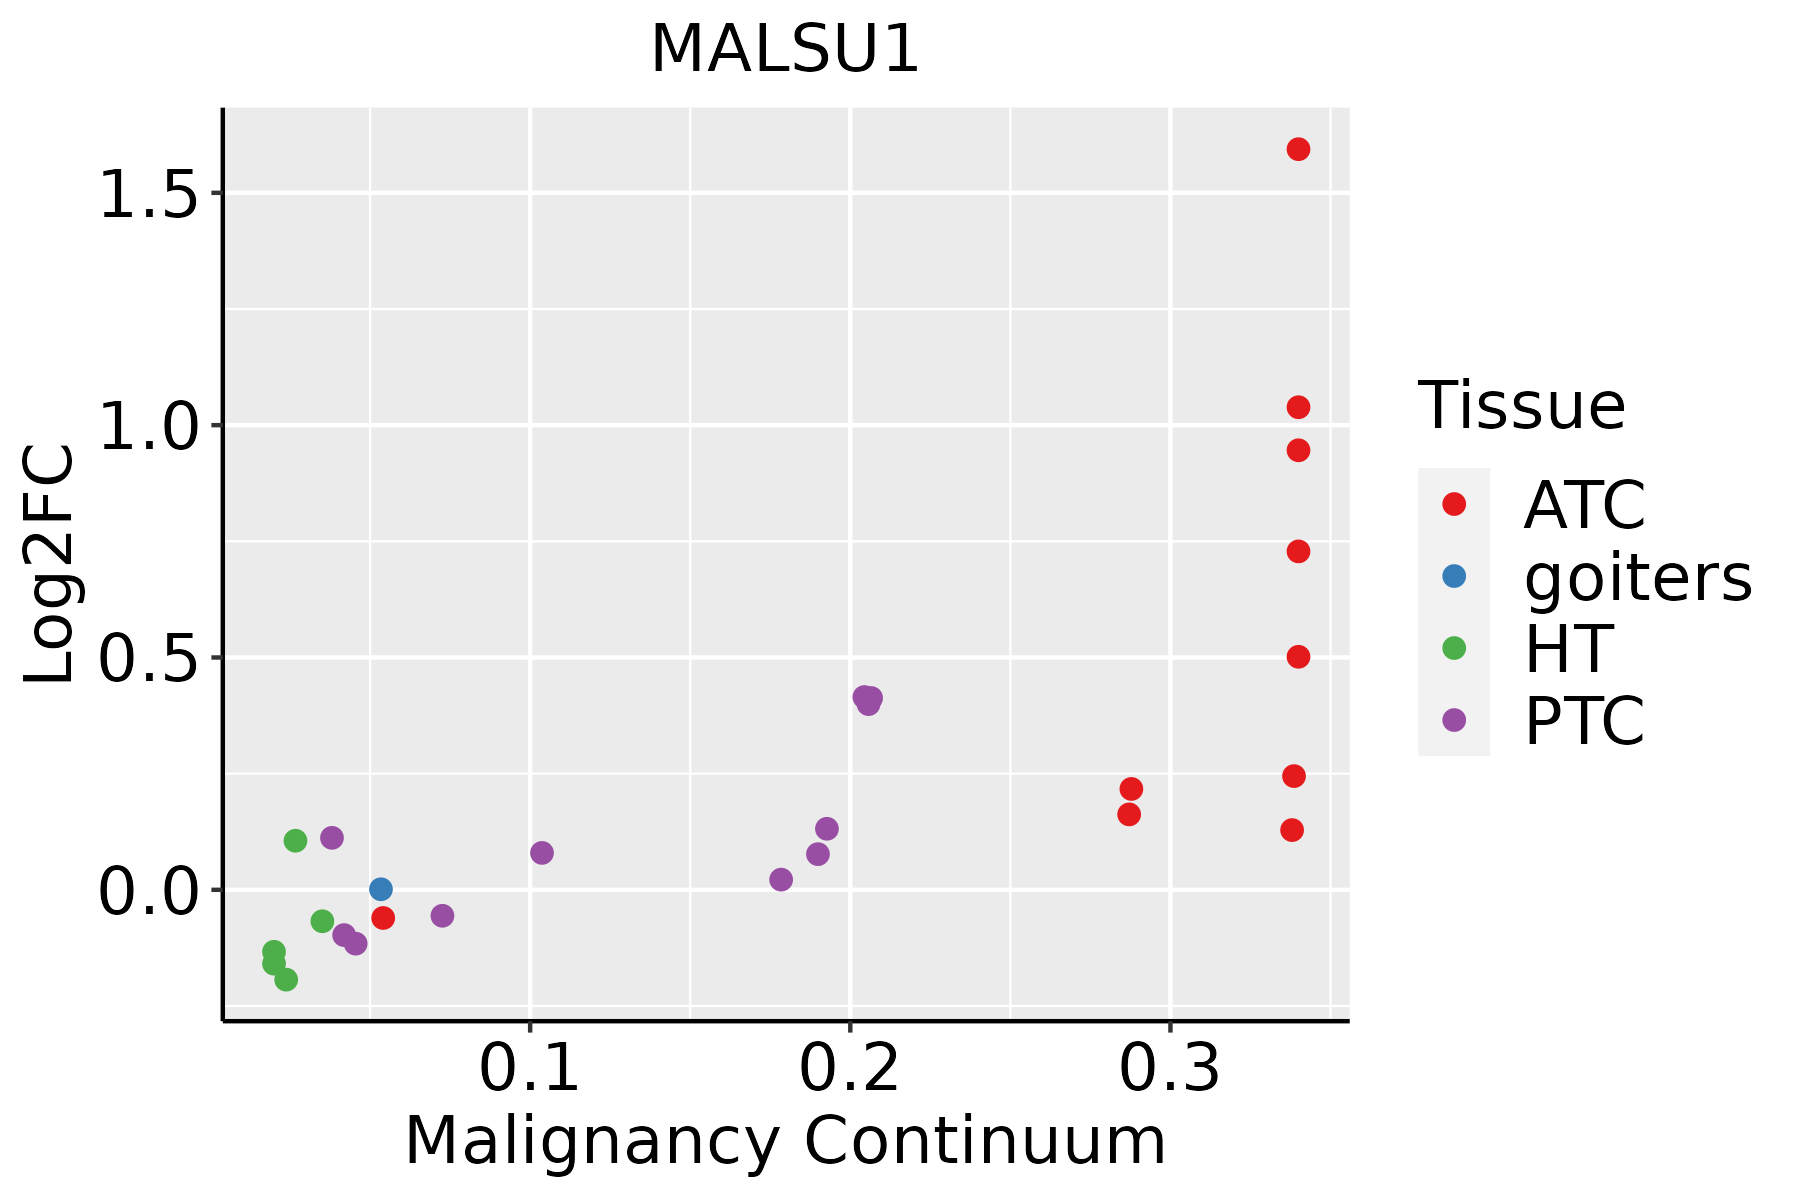 | ATC: Anaplastic thyroid cancer |
| HT: Hashimoto's thyroiditis | ||
| PTC: Papillary thyroid cancer |
| ∗log2FC in expression of this searched gene in stem-like cells from each diseased tissue sample relative to stem-like cells in normal samples in each tissue plotted against the malignancy continuum. Samples are colored based on if they are from different disease stage. |
Top |
Malignant transformation related pathway analysis |
| Find out the enriched GO biological processes and KEGG pathways involved in transition from healthy to precancer to cancer |
| Tissue | Disease Stage | Enriched GO biological Processes |
| Colorectum | AD |  |
| Colorectum | SER |  |
| Colorectum | MSS |  |
| Colorectum | MSI-H |  |
| Colorectum | FAP |  |
| ∗Top 15 enriched GO BP terms are showed in the bar plot of each disease state in each tissue. Each row represents a significant GO biological process which is colored according to the -log10(p.adjust). |
| Page: 1 2 3 4 5 6 7 8 9 |
| GO ID | Tissue | Disease Stage | Description | Gene Ratio | Bg Ratio | pvalue | p.adjust | Count |
| GO:00621253 | Skin | cSCC | regulation of mitochondrial gene expression | 14/4864 | 28/18723 | 5.47e-03 | 2.73e-02 | 14 |
| GO:0022613113 | Thyroid | PTC | ribonucleoprotein complex biogenesis | 292/5968 | 463/18723 | 3.24e-44 | 2.05e-40 | 292 |
| GO:0042254113 | Thyroid | PTC | ribosome biogenesis | 202/5968 | 299/18723 | 3.47e-37 | 5.47e-34 | 202 |
| GO:0006417113 | Thyroid | PTC | regulation of translation | 236/5968 | 468/18723 | 2.70e-17 | 2.52e-15 | 236 |
| GO:0042273113 | Thyroid | PTC | ribosomal large subunit biogenesis | 57/5968 | 72/18723 | 1.79e-16 | 1.51e-14 | 57 |
| GO:003424916 | Thyroid | PTC | negative regulation of cellular amide metabolic process | 122/5968 | 273/18723 | 5.50e-06 | 6.64e-05 | 122 |
| GO:001714815 | Thyroid | PTC | negative regulation of translation | 108/5968 | 245/18723 | 3.75e-05 | 3.48e-04 | 108 |
| GO:01400536 | Thyroid | PTC | mitochondrial gene expression | 51/5968 | 108/18723 | 6.04e-04 | 3.83e-03 | 51 |
| GO:00325437 | Thyroid | PTC | mitochondrial translation | 38/5968 | 76/18723 | 7.52e-04 | 4.67e-03 | 38 |
| GO:002261334 | Thyroid | ATC | ribonucleoprotein complex biogenesis | 292/6293 | 463/18723 | 3.05e-39 | 9.63e-36 | 292 |
| GO:004225434 | Thyroid | ATC | ribosome biogenesis | 203/6293 | 299/18723 | 3.63e-34 | 4.59e-31 | 203 |
| GO:004227335 | Thyroid | ATC | ribosomal large subunit biogenesis | 57/6293 | 72/18723 | 2.56e-15 | 1.82e-13 | 57 |
| GO:000641735 | Thyroid | ATC | regulation of translation | 236/6293 | 468/18723 | 2.39e-14 | 1.34e-12 | 236 |
| GO:003424923 | Thyroid | ATC | negative regulation of cellular amide metabolic process | 121/6293 | 273/18723 | 1.36e-04 | 9.57e-04 | 121 |
| GO:001714823 | Thyroid | ATC | negative regulation of translation | 107/6293 | 245/18723 | 6.17e-04 | 3.51e-03 | 107 |
| GO:014005314 | Thyroid | ATC | mitochondrial gene expression | 51/6293 | 108/18723 | 2.26e-03 | 1.06e-02 | 51 |
| GO:003254315 | Thyroid | ATC | mitochondrial translation | 38/6293 | 76/18723 | 2.26e-03 | 1.06e-02 | 38 |
| Page: 1 2 3 4 |
| Pathway ID | Tissue | Disease Stage | Description | Gene Ratio | Bg Ratio | pvalue | p.adjust | qvalue | Count |
| Page: 1 |
Top |
Cell-cell communication analysis |
| Identification of potential cell-cell interactions between two cell types and their ligand-receptor pairs for different disease states |
| Ligand | Receptor | LRpair | Pathway | Tissue | Disease Stage |
| Page: 1 |
Top |
Single-cell gene regulatory network inference analysis |
| Find out the significant the regulons (TFs) and the target genes of each regulon across cell types for different disease states |
| TF | Cell Type | Tissue | Disease Stage | Target Gene | RSS | Regulon Activity |
| ∗The dot plots of a searched regulon are shown for all cell subpopulations in each disease state of each tissue based on the regulon specific score inferred using pySCENIC and by calculating the average expression. |
| Page: 1 |
Top |
Somatic mutation of malignant transformation related genes |
| Annotation of somatic variants for genes involved in malignant transformation |
| Hugo Symbol | Variant Class | Variant Classification | dbSNP RS | HGVSc | HGVSp | HGVSp Short | SWISSPROT | BIOTYPE | SIFT | PolyPhen | Tumor Sample Barcode | Tissue | Histology | Sex | Age | Stage | Therapy Types | Drugs | Outcome |
| MALSU1 | SNV | Missense_Mutation | c.120N>T | p.Gln40His | p.Q40H | Q96EH3 | protein_coding | tolerated(0.13) | benign(0.066) | TCGA-AO-A128-01 | Breast | breast invasive carcinoma | Female | <65 | I/II | Chemotherapy | doxorubicin | SD | |
| MALSU1 | SNV | Missense_Mutation | c.410N>T | p.Ala137Val | p.A137V | Q96EH3 | protein_coding | deleterious(0) | probably_damaging(0.993) | TCGA-AA-A010-01 | Colorectum | colon adenocarcinoma | Female | <65 | I/II | Chemotherapy | folinic | CR | |
| MALSU1 | SNV | Missense_Mutation | novel | c.573G>T | p.Glu191Asp | p.E191D | Q96EH3 | protein_coding | deleterious(0) | probably_damaging(0.999) | TCGA-AG-A002-01 | Colorectum | rectum adenocarcinoma | Male | <65 | I/II | Unknown | Unknown | SD |
| MALSU1 | SNV | Missense_Mutation | c.410N>T | p.Ala137Val | p.A137V | Q96EH3 | protein_coding | deleterious(0) | probably_damaging(0.993) | TCGA-AX-A1CE-01 | Endometrium | uterine corpus endometrioid carcinoma | Female | <65 | I/II | Unspecific | Paclitaxel | SD | |
| MALSU1 | SNV | Missense_Mutation | novel | c.332N>C | p.Val111Ala | p.V111A | Q96EH3 | protein_coding | tolerated(0.06) | possibly_damaging(0.695) | TCGA-AX-A2HJ-01 | Endometrium | uterine corpus endometrioid carcinoma | Female | <65 | I/II | Unknown | Unknown | SD |
| MALSU1 | SNV | Missense_Mutation | novel | c.573N>T | p.Glu191Asp | p.E191D | Q96EH3 | protein_coding | deleterious(0) | probably_damaging(0.999) | TCGA-EO-A3B0-01 | Endometrium | uterine corpus endometrioid carcinoma | Female | <65 | III/IV | Unknown | Unknown | SD |
| MALSU1 | SNV | Missense_Mutation | novel | c.377T>G | p.Ile126Ser | p.I126S | Q96EH3 | protein_coding | deleterious(0) | probably_damaging(0.989) | TCGA-FI-A2D5-01 | Endometrium | uterine corpus endometrioid carcinoma | Female | <65 | III/IV | Chemotherapy | carboplatinum | PD |
| MALSU1 | SNV | Missense_Mutation | rs753431892 | c.490A>G | p.Thr164Ala | p.T164A | Q96EH3 | protein_coding | tolerated(0.25) | benign(0.033) | TCGA-2Y-A9GU-01 | Liver | liver hepatocellular carcinoma | Female | <65 | I/II | Unknown | Unknown | SD |
| MALSU1 | SNV | Missense_Mutation | c.19N>T | p.Val7Leu | p.V7L | Q96EH3 | protein_coding | tolerated_low_confidence(0.11) | benign(0.018) | TCGA-CC-A7II-01 | Liver | liver hepatocellular carcinoma | Male | <65 | III/IV | Unknown | Unknown | PD | |
| MALSU1 | SNV | Missense_Mutation | rs375849242 | c.16C>T | p.Arg6Cys | p.R6C | Q96EH3 | protein_coding | tolerated_low_confidence(0.49) | benign(0) | TCGA-G3-AAV5-01 | Liver | liver hepatocellular carcinoma | Male | >=65 | I/II | Chemotherapy | hec.1 | SD |
| Page: 1 2 |
Top |
Related drugs of malignant transformation related genes |
| Identification of chemicals and drugs interact with genes involved in malignant transfromation |
| (DGIdb 4.0) |
| Entrez ID | Symbol | Category | Interaction Types | Drug Claim Name | Drug Name | PMIDs |
| Page: 1 |

Copyright 2023-Present -The University of Texas Health Science Center at Houston |