| Tissue | Expression Dynamics | Abbreviation |
| Colorectum (GSE201348) |  | FAP: Familial adenomatous polyposis |
| CRC: Colorectal cancer |
| Colorectum (HTA11) | 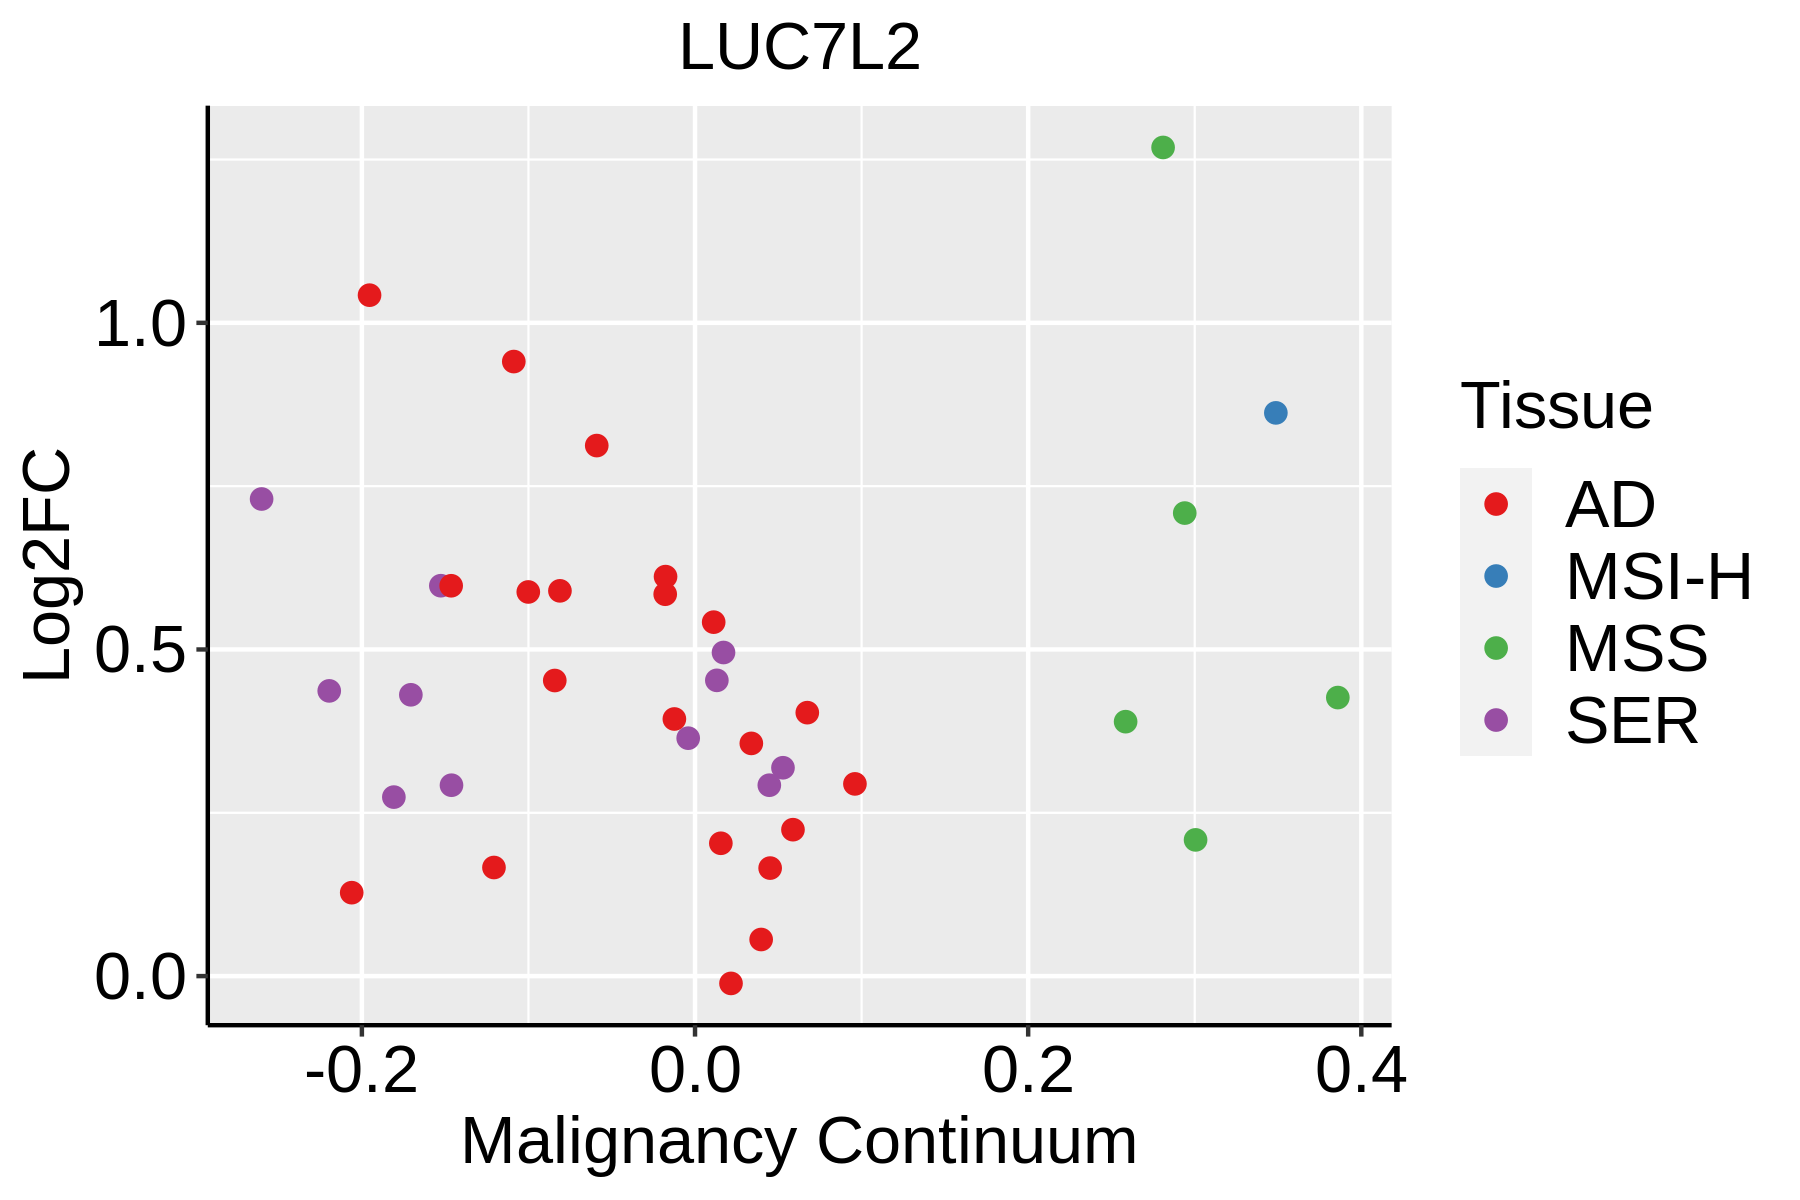 | AD: Adenomas |
| SER: Sessile serrated lesions |
| MSI-H: Microsatellite-high colorectal cancer |
| MSS: Microsatellite stable colorectal cancer |
| Esophagus | 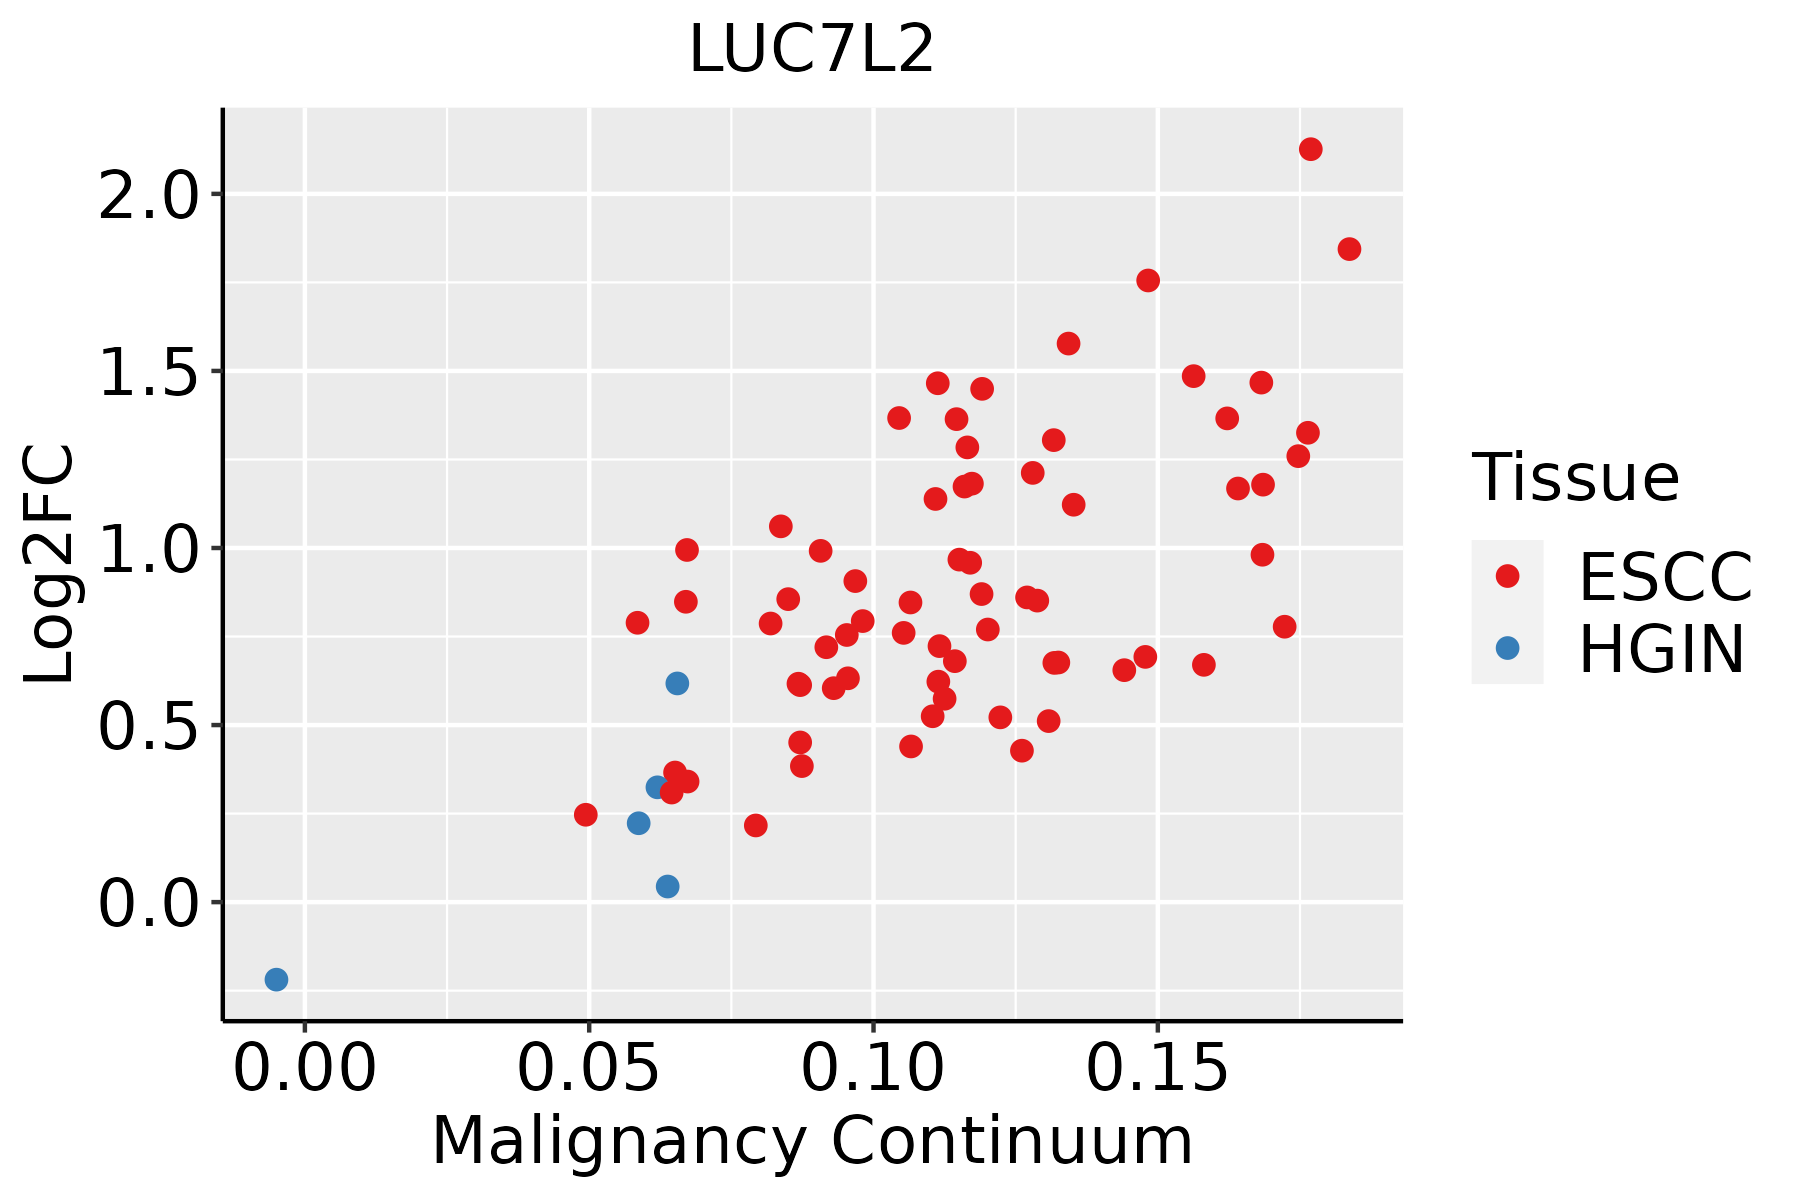 | ESCC: Esophageal squamous cell carcinoma |
| HGIN: High-grade intraepithelial neoplasias |
| LGIN: Low-grade intraepithelial neoplasias |
| Liver |  | HCC: Hepatocellular carcinoma |
| NAFLD: Non-alcoholic fatty liver disease |
| Lung | 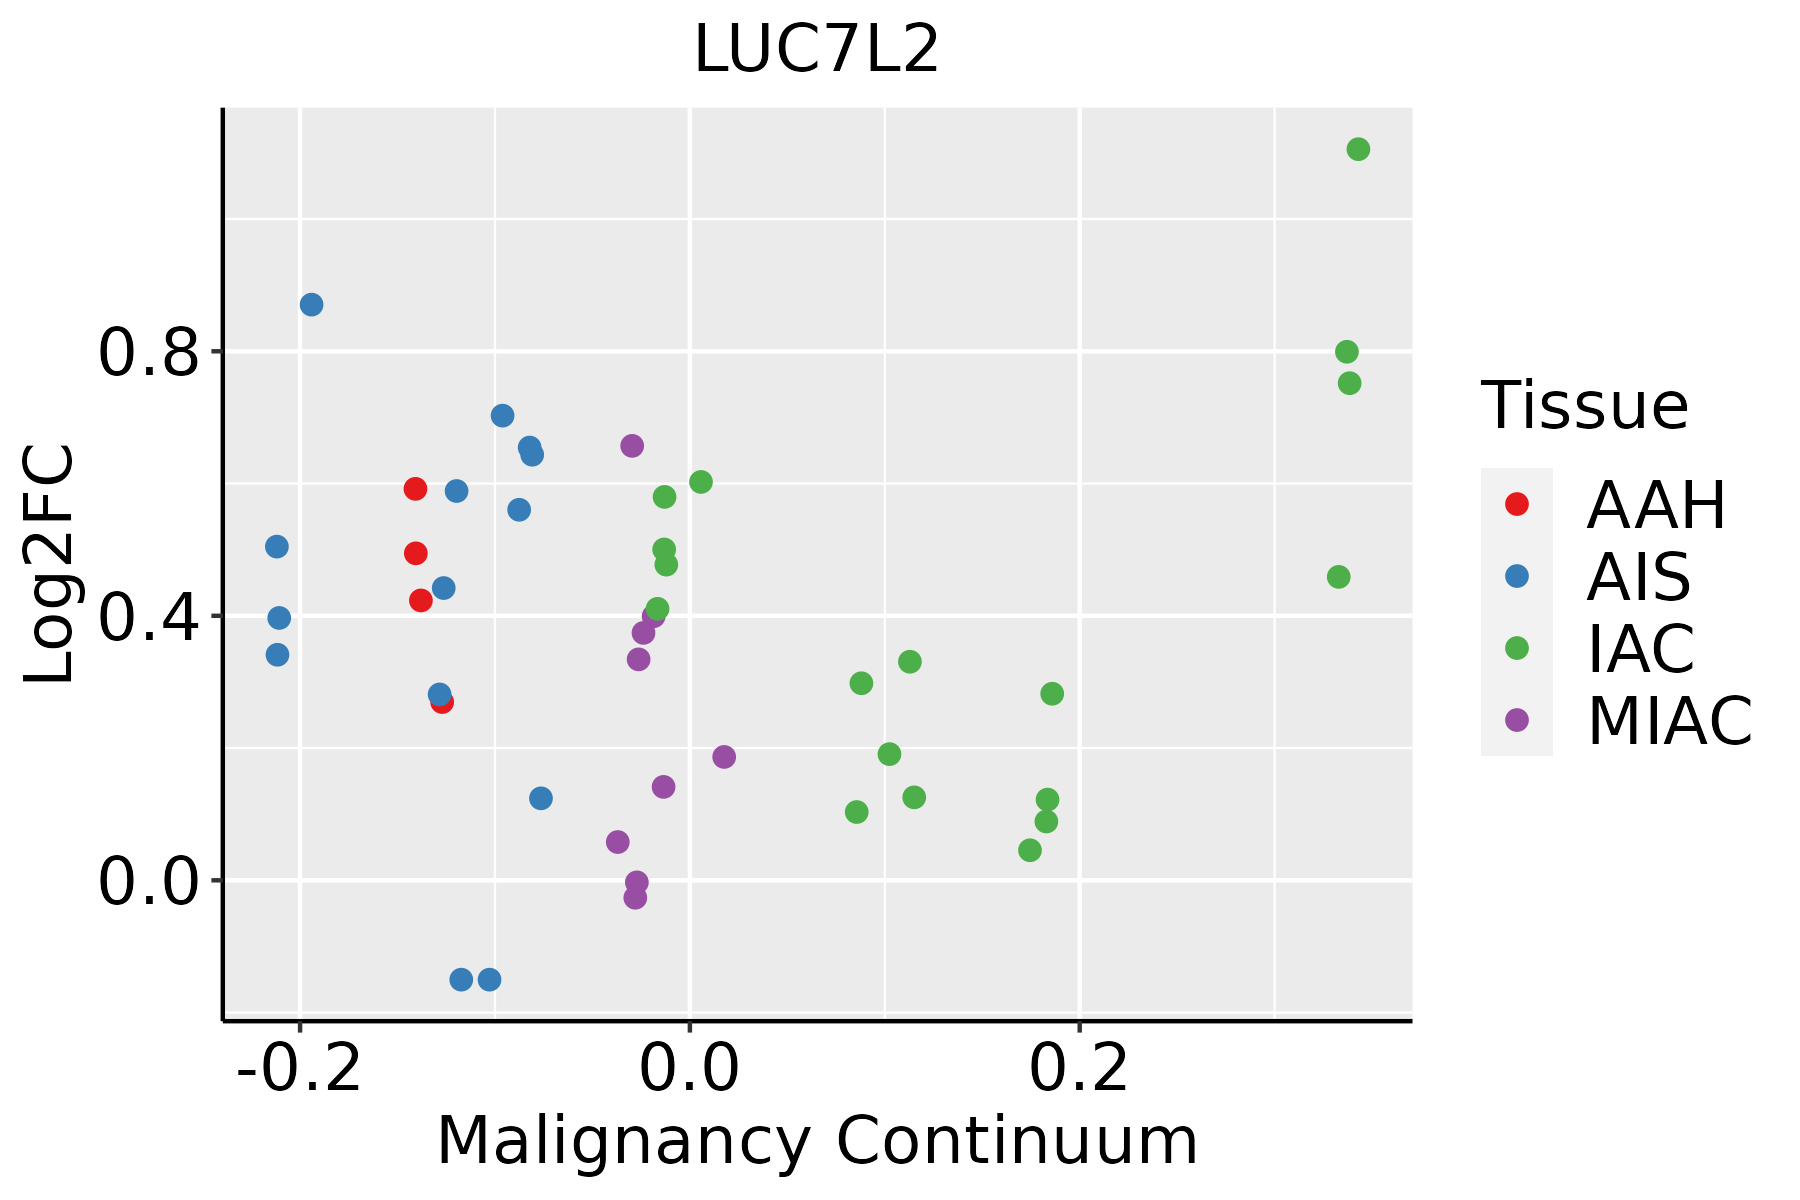 | AAH: Atypical adenomatous hyperplasia |
| AIS: Adenocarcinoma in situ |
| IAC: Invasive lung adenocarcinoma |
| MIA: Minimally invasive adenocarcinoma |
| Oral Cavity | 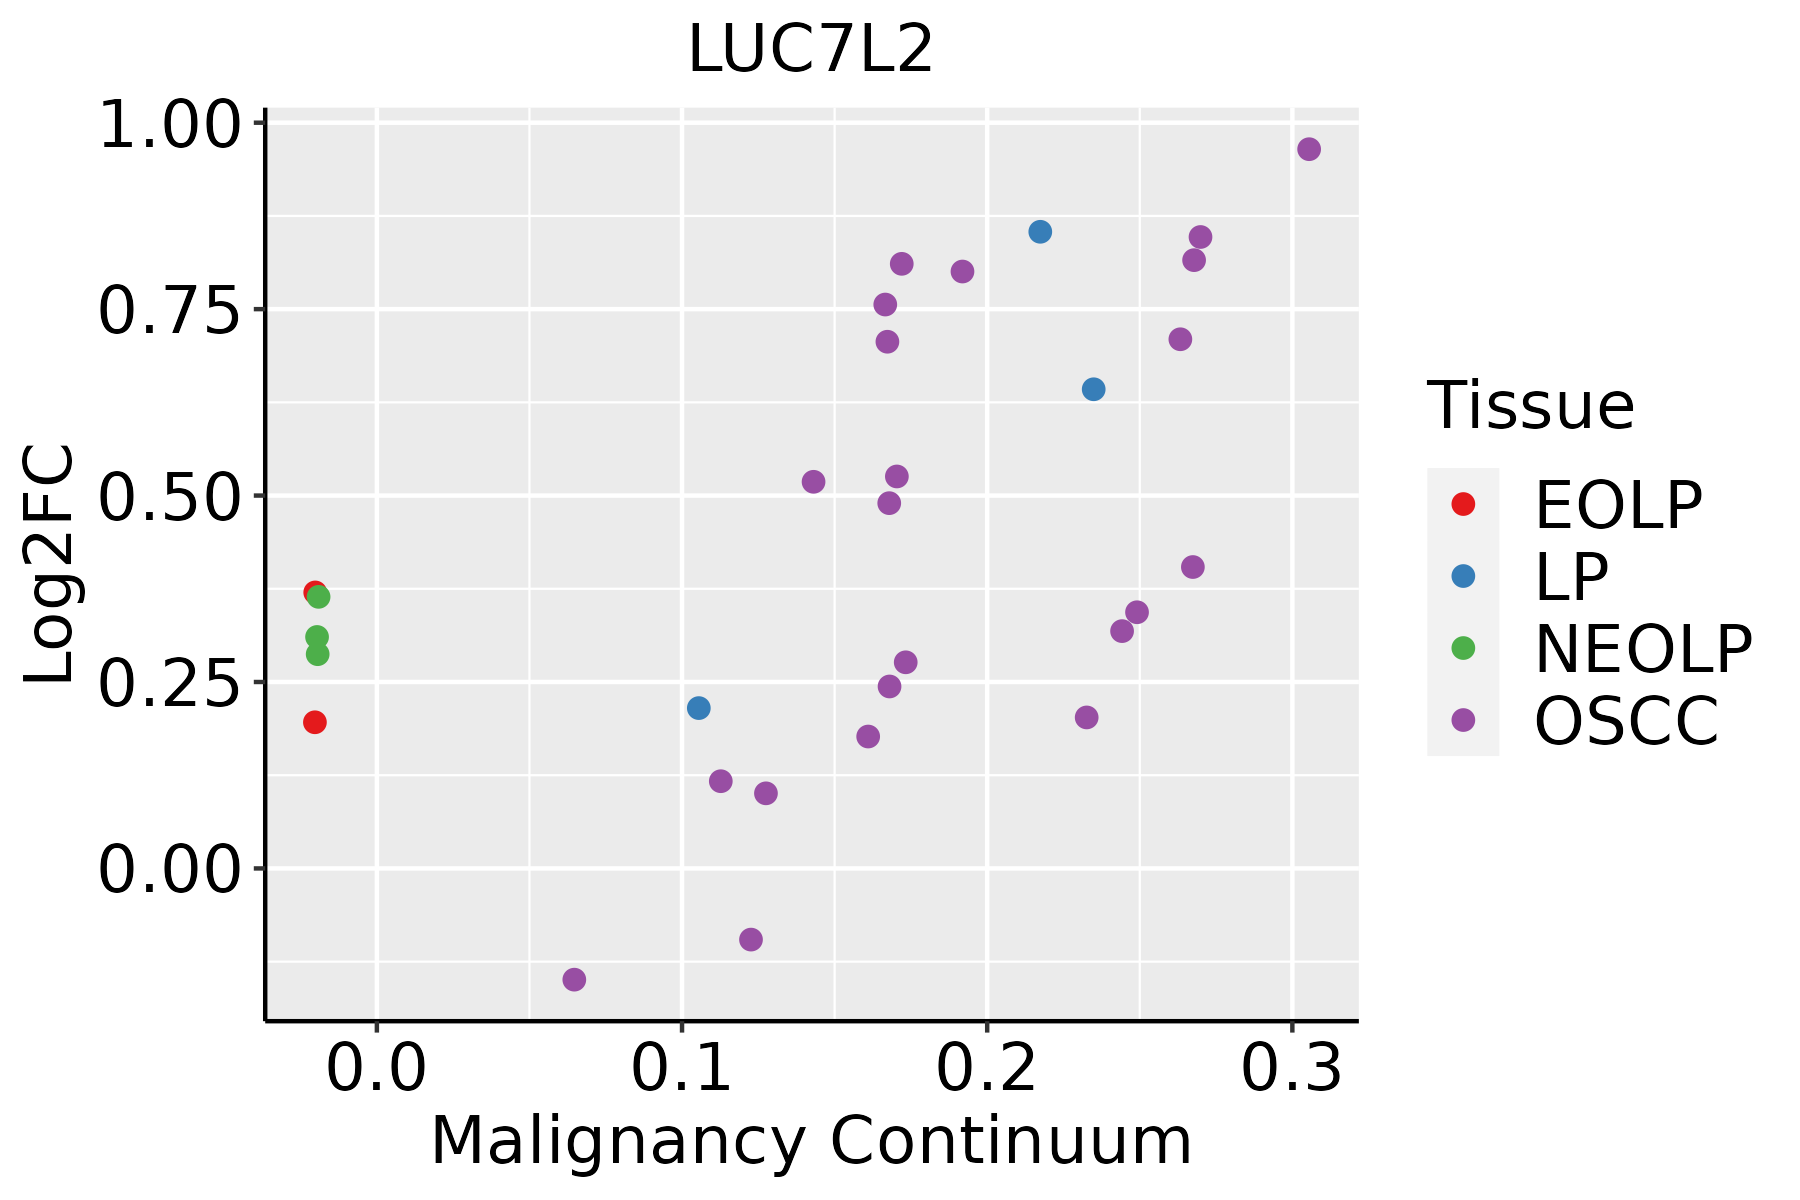 | EOLP: Erosive Oral lichen planus |
| LP: leukoplakia |
| NEOLP: Non-erosive oral lichen planus |
| OSCC: Oral squamous cell carcinoma |
| Skin |  | AK: Actinic keratosis |
| cSCC: Cutaneous squamous cell carcinoma |
| SCCIS:squamous cell carcinoma in situ |
| Thyroid |  | ATC: Anaplastic thyroid cancer |
| HT: Hashimoto's thyroiditis |
| PTC: Papillary thyroid cancer |
| GO ID | Tissue | Disease Stage | Description | Gene Ratio | Bg Ratio | pvalue | p.adjust | Count |
| GO:0000377111 | Esophagus | ESCC | RNA splicing, via transesterification reactions with bulged adenosine as nucleophile | 244/8552 | 320/18723 | 2.52e-29 | 1.07e-26 | 244 |
| GO:0000398111 | Esophagus | ESCC | mRNA splicing, via spliceosome | 244/8552 | 320/18723 | 2.52e-29 | 1.07e-26 | 244 |
| GO:0071826111 | Esophagus | ESCC | ribonucleoprotein complex subunit organization | 166/8552 | 227/18723 | 2.94e-17 | 2.42e-15 | 166 |
| GO:0022618111 | Esophagus | ESCC | ribonucleoprotein complex assembly | 159/8552 | 220/18723 | 8.19e-16 | 5.71e-14 | 159 |
| GO:000024514 | Esophagus | ESCC | spliceosomal complex assembly | 48/8552 | 79/18723 | 4.93e-03 | 1.89e-02 | 48 |
| GO:000838012 | Liver | Cirrhotic | RNA splicing | 229/4634 | 434/18723 | 9.13e-37 | 2.86e-33 | 229 |
| GO:002261312 | Liver | Cirrhotic | ribonucleoprotein complex biogenesis | 231/4634 | 463/18723 | 3.28e-32 | 6.86e-29 | 231 |
| GO:000037512 | Liver | Cirrhotic | RNA splicing, via transesterification reactions | 175/4634 | 324/18723 | 5.95e-30 | 7.47e-27 | 175 |
| GO:000037712 | Liver | Cirrhotic | RNA splicing, via transesterification reactions with bulged adenosine as nucleophile | 172/4634 | 320/18723 | 4.02e-29 | 3.60e-26 | 172 |
| GO:000039812 | Liver | Cirrhotic | mRNA splicing, via spliceosome | 172/4634 | 320/18723 | 4.02e-29 | 3.60e-26 | 172 |
| GO:007182612 | Liver | Cirrhotic | ribonucleoprotein complex subunit organization | 115/4634 | 227/18723 | 2.67e-17 | 3.63e-15 | 115 |
| GO:002261812 | Liver | Cirrhotic | ribonucleoprotein complex assembly | 112/4634 | 220/18723 | 4.35e-17 | 5.81e-15 | 112 |
| GO:00002454 | Liver | Cirrhotic | spliceosomal complex assembly | 34/4634 | 79/18723 | 2.78e-04 | 2.46e-03 | 34 |
| GO:00063762 | Liver | Cirrhotic | mRNA splice site selection | 20/4634 | 49/18723 | 9.60e-03 | 4.35e-02 | 20 |
| GO:002261322 | Liver | HCC | ribonucleoprotein complex biogenesis | 355/7958 | 463/18723 | 7.76e-52 | 4.92e-48 | 355 |
| GO:000838022 | Liver | HCC | RNA splicing | 313/7958 | 434/18723 | 1.36e-36 | 1.73e-33 | 313 |
| GO:000037522 | Liver | HCC | RNA splicing, via transesterification reactions | 228/7958 | 324/18723 | 1.47e-24 | 4.06e-22 | 228 |
| GO:000037722 | Liver | HCC | RNA splicing, via transesterification reactions with bulged adenosine as nucleophile | 224/7958 | 320/18723 | 1.16e-23 | 2.62e-21 | 224 |
| GO:000039822 | Liver | HCC | mRNA splicing, via spliceosome | 224/7958 | 320/18723 | 1.16e-23 | 2.62e-21 | 224 |
| GO:007182622 | Liver | HCC | ribonucleoprotein complex subunit organization | 159/7958 | 227/18723 | 3.14e-17 | 3.06e-15 | 159 |
| Hugo Symbol | Variant Class | Variant Classification | dbSNP RS | HGVSc | HGVSp | HGVSp Short | SWISSPROT | BIOTYPE | SIFT | PolyPhen | Tumor Sample Barcode | Tissue | Histology | Sex | Age | Stage | Therapy Types | Drugs | Outcome |
| LUC7L2 | SNV | Missense_Mutation | novel | c.5N>T | p.Ser2Leu | p.S2L | Q9Y383 | protein_coding | deleterious(0) | probably_damaging(0.963) | TCGA-5L-AAT1-01 | Breast | breast invasive carcinoma | Female | <65 | III/IV | Hormone Therapy | letrozol | SD |
| LUC7L2 | SNV | Missense_Mutation | | c.700N>A | p.Glu234Lys | p.E234K | Q9Y383 | protein_coding | tolerated(0.19) | benign(0.025) | TCGA-A8-A06Q-01 | Breast | breast invasive carcinoma | Female | <65 | III/IV | Unknown | Unknown | SD |
| LUC7L2 | SNV | Missense_Mutation | | c.935G>A | p.Arg312His | p.R312H | Q9Y383 | protein_coding | tolerated_low_confidence(0.07) | probably_damaging(0.964) | TCGA-C8-A26V-01 | Breast | breast invasive carcinoma | Female | <65 | III/IV | Hormone Therapy | tamoxiphen | CR |
| LUC7L2 | SNV | Missense_Mutation | | c.705N>C | p.Lys235Asn | p.K235N | Q9Y383 | protein_coding | deleterious(0.03) | probably_damaging(0.987) | TCGA-D8-A1JM-01 | Breast | breast invasive carcinoma | Female | <65 | I/II | ChemotherapyHormone Therapy | doxorubicine | SD |
| LUC7L2 | SNV | Missense_Mutation | rs761427902 | c.899N>A | p.Arg300His | p.R300H | Q9Y383 | protein_coding | tolerated_low_confidence(0.19) | probably_damaging(0.964) | TCGA-E2-A14T-01 | Breast | breast invasive carcinoma | Female | <65 | I/II | Chemotherapy | doxorubicin | SD |
| LUC7L2 | SNV | Missense_Mutation | novel | c.488G>A | p.Arg163Gln | p.R163Q | Q9Y383 | protein_coding | deleterious(0.02) | possibly_damaging(0.59) | TCGA-2W-A8YY-01 | Cervix | cervical & endocervical cancer | Female | <65 | I/II | Chemotherapy | cisplatin | CR |
| LUC7L2 | SNV | Missense_Mutation | | c.527C>A | p.Ser176Tyr | p.S176Y | Q9Y383 | protein_coding | deleterious(0) | probably_damaging(0.969) | TCGA-A6-2675-01 | Colorectum | colon adenocarcinoma | Male | >=65 | I/II | Unknown | Unknown | SD |
| LUC7L2 | SNV | Missense_Mutation | rs754703629 | c.1105C>T | p.Arg369Trp | p.R369W | Q9Y383 | protein_coding | tolerated_low_confidence(0.15) | probably_damaging(0.973) | TCGA-AA-3867-01 | Colorectum | colon adenocarcinoma | Male | >=65 | III/IV | Unknown | Unknown | PD |
| LUC7L2 | SNV | Missense_Mutation | rs761427902 | c.899N>A | p.Arg300His | p.R300H | Q9Y383 | protein_coding | tolerated_low_confidence(0.19) | probably_damaging(0.964) | TCGA-AD-6895-01 | Colorectum | colon adenocarcinoma | Male | >=65 | III/IV | Unknown | Unknown | SD |
| LUC7L2 | SNV | Missense_Mutation | | c.214G>A | p.Glu72Lys | p.E72K | Q9Y383 | protein_coding | deleterious(0.02) | possibly_damaging(0.679) | TCGA-CA-6717-01 | Colorectum | colon adenocarcinoma | Male | <65 | I/II | Chemotherapy | oxaliplatin | CR |


