
|
|||||
|
 | |
| |
| |
| |
| |
| |
|
Gene: LIPC |
Gene summary for LIPC |
| Gene information | Species | Human | Gene symbol | LIPC | Gene ID | 3990 |
| Gene name | lipase C, hepatic type | |
| Gene Alias | HDLCQ12 | |
| Cytomap | 15q21.3 | |
| Gene Type | protein-coding | GO ID | GO:0006066 | UniProtAcc | A6H8L5 |
Top |
Malignant transformation analysis |
| Identification of the aberrant gene expression in precancerous and cancerous lesions by comparing the gene expression of stem-like cells in diseased tissues with normal stem cells |
| Entrez ID | Symbol | Replicates | Species | Organ | Tissue | Adj P-value | Log2FC | Malignancy |
| 3990 | LIPC | NAFLD1 | Human | Liver | NAFLD | 3.04e-12 | 1.05e+00 | -0.04 |
| 3990 | LIPC | S43 | Human | Liver | Cirrhotic | 3.42e-05 | -1.39e-01 | -0.0187 |
| 3990 | LIPC | HCC1_Meng | Human | Liver | HCC | 5.64e-53 | -5.50e-02 | 0.0246 |
| 3990 | LIPC | HCC2_Meng | Human | Liver | HCC | 2.33e-07 | -2.01e-01 | 0.0107 |
| 3990 | LIPC | cirrhotic1 | Human | Liver | Cirrhotic | 5.50e-03 | -6.83e-02 | 0.0202 |
| 3990 | LIPC | HCC1 | Human | Liver | HCC | 4.70e-17 | 4.81e+00 | 0.5336 |
| 3990 | LIPC | HCC2 | Human | Liver | HCC | 1.24e-16 | 3.69e+00 | 0.5341 |
| 3990 | LIPC | Pt13.a | Human | Liver | HCC | 1.23e-02 | 2.65e-01 | 0.021 |
| 3990 | LIPC | Pt13.b | Human | Liver | HCC | 2.74e-19 | 3.47e-01 | 0.0251 |
| 3990 | LIPC | Pt14.a | Human | Liver | HCC | 6.27e-06 | 3.65e-01 | 0.0169 |
| 3990 | LIPC | Pt14.b | Human | Liver | HCC | 1.75e-04 | 2.98e-01 | 0.018 |
| 3990 | LIPC | S027 | Human | Liver | HCC | 4.63e-18 | 1.95e+00 | 0.2446 |
| 3990 | LIPC | S028 | Human | Liver | HCC | 3.97e-39 | 2.00e+00 | 0.2503 |
| 3990 | LIPC | S029 | Human | Liver | HCC | 1.65e-40 | 2.03e+00 | 0.2581 |
| Page: 1 |
| Tissue | Expression Dynamics | Abbreviation |
| Liver | 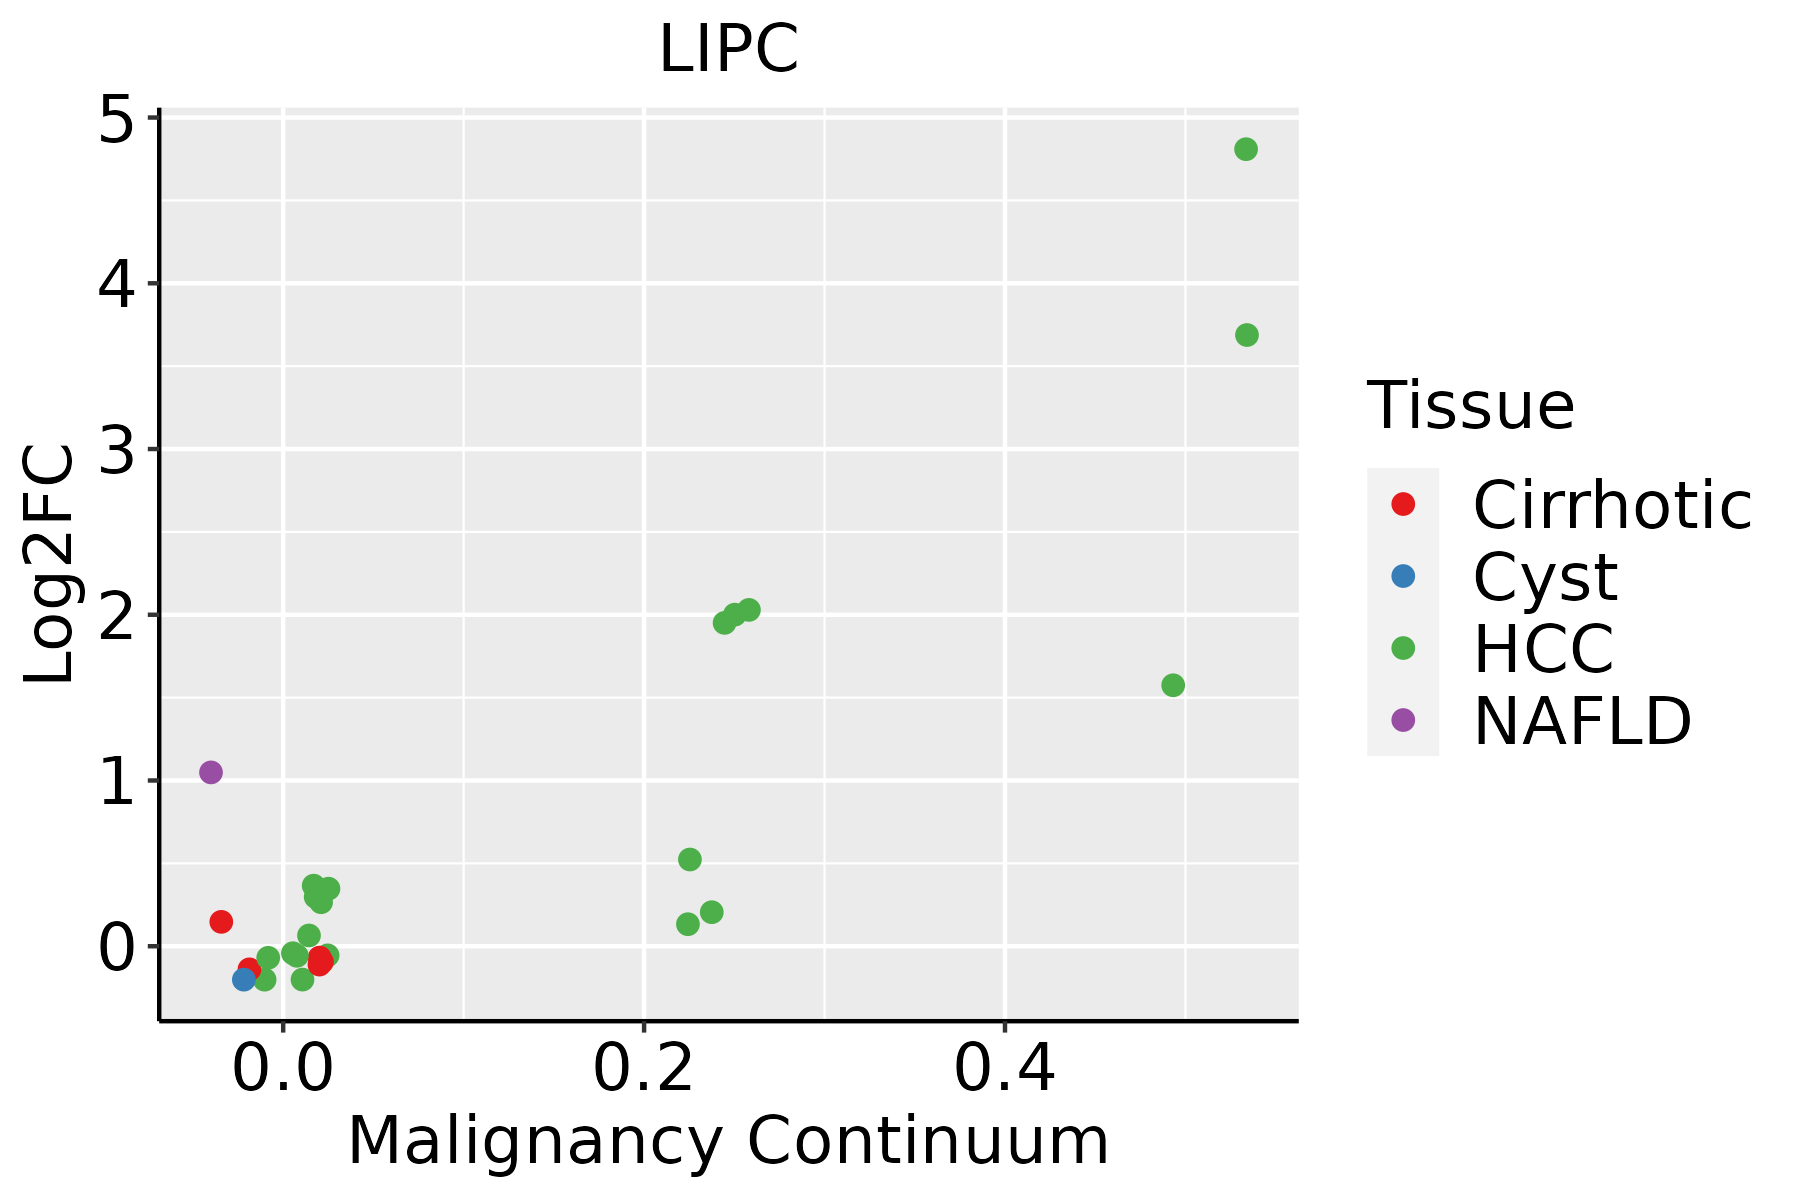 | HCC: Hepatocellular carcinoma |
| NAFLD: Non-alcoholic fatty liver disease |
| ∗log2FC in expression of this searched gene in stem-like cells from each diseased tissue sample relative to stem-like cells in normal samples in each tissue plotted against the malignancy continuum. Samples are colored based on if they are from different disease stage. |
Top |
Malignant transformation related pathway analysis |
| Find out the enriched GO biological processes and KEGG pathways involved in transition from healthy to precancer to cancer |
| Tissue | Disease Stage | Enriched GO biological Processes |
| Colorectum | AD |  |
| Colorectum | SER |  |
| Colorectum | MSS |  |
| Colorectum | MSI-H |  |
| Colorectum | FAP |  |
| ∗Top 15 enriched GO BP terms are showed in the bar plot of each disease state in each tissue. Each row represents a significant GO biological process which is colored according to the -log10(p.adjust). |
| Page: 1 2 3 4 5 6 7 8 9 |
| GO ID | Tissue | Disease Stage | Description | Gene Ratio | Bg Ratio | pvalue | p.adjust | Count |
| GO:00343681 | Liver | Cirrhotic | protein-lipid complex remodeling | 16/4634 | 30/18723 | 7.20e-04 | 5.36e-03 | 16 |
| GO:00343691 | Liver | Cirrhotic | plasma lipoprotein particle remodeling | 16/4634 | 30/18723 | 7.20e-04 | 5.36e-03 | 16 |
| GO:001591811 | Liver | Cirrhotic | sterol transport | 48/4634 | 130/18723 | 1.32e-03 | 8.83e-03 | 48 |
| GO:003030111 | Liver | Cirrhotic | cholesterol transport | 44/4634 | 117/18723 | 1.34e-03 | 8.98e-03 | 44 |
| GO:00343671 | Liver | Cirrhotic | protein-containing complex remodeling | 16/4634 | 32/18723 | 1.77e-03 | 1.13e-02 | 16 |
| GO:00718251 | Liver | Cirrhotic | protein-lipid complex subunit organization | 22/4634 | 50/18723 | 2.26e-03 | 1.37e-02 | 22 |
| GO:00436911 | Liver | Cirrhotic | reverse cholesterol transport | 11/4634 | 20/18723 | 3.61e-03 | 1.99e-02 | 11 |
| GO:00718271 | Liver | Cirrhotic | plasma lipoprotein particle organization | 20/4634 | 46/18723 | 4.15e-03 | 2.22e-02 | 20 |
| GO:00343751 | Liver | Cirrhotic | high-density lipoprotein particle remodeling | 9/4634 | 16/18723 | 6.94e-03 | 3.38e-02 | 9 |
| GO:00550901 | Liver | Cirrhotic | acylglycerol homeostasis | 18/4634 | 42/18723 | 7.64e-03 | 3.61e-02 | 18 |
| GO:00703281 | Liver | Cirrhotic | triglyceride homeostasis | 18/4634 | 42/18723 | 7.64e-03 | 3.61e-02 | 18 |
| GO:00464341 | Liver | Cirrhotic | organophosphate catabolic process | 52/4634 | 155/18723 | 8.42e-03 | 3.91e-02 | 52 |
| GO:001605321 | Liver | HCC | organic acid biosynthetic process | 200/7958 | 316/18723 | 5.24e-14 | 3.22e-12 | 200 |
| GO:000663122 | Liver | HCC | fatty acid metabolic process | 238/7958 | 390/18723 | 8.24e-14 | 4.84e-12 | 238 |
| GO:004639421 | Liver | HCC | carboxylic acid biosynthetic process | 198/7958 | 314/18723 | 1.19e-13 | 6.78e-12 | 198 |
| GO:000606621 | Liver | HCC | alcohol metabolic process | 208/7958 | 353/18723 | 2.80e-10 | 9.50e-09 | 208 |
| GO:19026522 | Liver | HCC | secondary alcohol metabolic process | 100/7958 | 147/18723 | 3.26e-10 | 1.09e-08 | 100 |
| GO:00082032 | Liver | HCC | cholesterol metabolic process | 94/7958 | 137/18723 | 5.39e-10 | 1.72e-08 | 94 |
| GO:00082022 | Liver | HCC | steroid metabolic process | 188/7958 | 319/18723 | 1.96e-09 | 5.63e-08 | 188 |
| GO:00161252 | Liver | HCC | sterol metabolic process | 101/7958 | 152/18723 | 1.99e-09 | 5.63e-08 | 101 |
| Page: 1 2 3 4 5 |
| Pathway ID | Tissue | Disease Stage | Description | Gene Ratio | Bg Ratio | pvalue | p.adjust | qvalue | Count |
| hsa049796 | Liver | NAFLD | Cholesterol metabolism | 20/1043 | 51/8465 | 9.73e-07 | 4.56e-05 | 3.67e-05 | 20 |
| hsa0497911 | Liver | NAFLD | Cholesterol metabolism | 20/1043 | 51/8465 | 9.73e-07 | 4.56e-05 | 3.67e-05 | 20 |
| hsa049792 | Liver | Cirrhotic | Cholesterol metabolism | 30/2530 | 51/8465 | 1.59e-05 | 1.39e-04 | 8.60e-05 | 30 |
| hsa049793 | Liver | Cirrhotic | Cholesterol metabolism | 30/2530 | 51/8465 | 1.59e-05 | 1.39e-04 | 8.60e-05 | 30 |
| hsa049794 | Liver | HCC | Cholesterol metabolism | 41/4020 | 51/8465 | 1.33e-06 | 1.35e-05 | 7.49e-06 | 41 |
| hsa005615 | Liver | HCC | Glycerolipid metabolism | 41/4020 | 63/8465 | 3.59e-03 | 1.12e-02 | 6.22e-03 | 41 |
| hsa049795 | Liver | HCC | Cholesterol metabolism | 41/4020 | 51/8465 | 1.33e-06 | 1.35e-05 | 7.49e-06 | 41 |
| hsa0056112 | Liver | HCC | Glycerolipid metabolism | 41/4020 | 63/8465 | 3.59e-03 | 1.12e-02 | 6.22e-03 | 41 |
| Page: 1 |
Top |
Cell-cell communication analysis |
| Identification of potential cell-cell interactions between two cell types and their ligand-receptor pairs for different disease states |
| Ligand | Receptor | LRpair | Pathway | Tissue | Disease Stage |
| Page: 1 |
Top |
Single-cell gene regulatory network inference analysis |
| Find out the significant the regulons (TFs) and the target genes of each regulon across cell types for different disease states |
| TF | Cell Type | Tissue | Disease Stage | Target Gene | RSS | Regulon Activity |
| ∗The dot plots of a searched regulon are shown for all cell subpopulations in each disease state of each tissue based on the regulon specific score inferred using pySCENIC and by calculating the average expression. |
| Page: 1 |
Top |
Somatic mutation of malignant transformation related genes |
| Annotation of somatic variants for genes involved in malignant transformation |
| Hugo Symbol | Variant Class | Variant Classification | dbSNP RS | HGVSc | HGVSp | HGVSp Short | SWISSPROT | BIOTYPE | SIFT | PolyPhen | Tumor Sample Barcode | Tissue | Histology | Sex | Age | Stage | Therapy Types | Drugs | Outcome |
| LIPC | SNV | Missense_Mutation | c.152G>C | p.Arg51Thr | p.R51T | P11150 | protein_coding | tolerated(0.09) | benign(0.046) | TCGA-BH-A18T-01 | Breast | breast invasive carcinoma | Female | >=65 | I/II | Unknown | Unknown | PD | |
| LIPC | SNV | Missense_Mutation | novel | c.90N>T | p.Glu30Asp | p.E30D | P11150 | protein_coding | tolerated(0.16) | benign(0.027) | TCGA-AA-3664-01 | Colorectum | colon adenocarcinoma | Female | >=65 | I/II | Unknown | Unknown | SD |
| LIPC | SNV | Missense_Mutation | c.817N>A | p.Gln273Lys | p.Q273K | P11150 | protein_coding | tolerated(0.11) | benign(0.038) | TCGA-AA-3715-01 | Colorectum | colon adenocarcinoma | Male | >=65 | I/II | Unknown | Unknown | PD | |
| LIPC | SNV | Missense_Mutation | c.680N>G | p.His227Arg | p.H227R | P11150 | protein_coding | tolerated(0.27) | benign(0.038) | TCGA-AA-3811-01 | Colorectum | colon adenocarcinoma | Female | >=65 | III/IV | Unknown | Unknown | PD | |
| LIPC | SNV | Missense_Mutation | c.845N>T | p.Ser282Leu | p.S282L | P11150 | protein_coding | deleterious(0) | probably_damaging(0.93) | TCGA-AA-3984-01 | Colorectum | colon adenocarcinoma | Female | <65 | I/II | Unknown | Unknown | SD | |
| LIPC | SNV | Missense_Mutation | c.878C>T | p.Ala293Val | p.A293V | P11150 | protein_coding | tolerated(0.09) | benign(0.215) | TCGA-AZ-6598-01 | Colorectum | colon adenocarcinoma | Female | >=65 | I/II | Unknown | Unknown | SD | |
| LIPC | SNV | Missense_Mutation | rs776463699 | c.791C>T | p.Ala264Val | p.A264V | P11150 | protein_coding | deleterious(0.03) | benign(0.305) | TCGA-CK-4951-01 | Colorectum | colon adenocarcinoma | Female | >=65 | I/II | Unknown | Unknown | PD |
| LIPC | SNV | Missense_Mutation | c.219G>T | p.Gln73His | p.Q73H | P11150 | protein_coding | tolerated(0.06) | probably_damaging(0.925) | TCGA-G4-6628-01 | Colorectum | colon adenocarcinoma | Male | >=65 | I/II | Unknown | Unknown | SD | |
| LIPC | SNV | Missense_Mutation | novel | c.1472C>A | p.Ser491Tyr | p.S491Y | P11150 | protein_coding | tolerated(1) | benign(0.316) | TCGA-AG-3892-01 | Colorectum | rectum adenocarcinoma | Female | <65 | I/II | Unknown | Unknown | SD |
| LIPC | SNV | Missense_Mutation | rs761575901 | c.862N>A | p.Asp288Asn | p.D288N | P11150 | protein_coding | deleterious(0) | probably_damaging(0.997) | TCGA-AG-4022-01 | Colorectum | rectum adenocarcinoma | Female | <65 | I/II | Chemotherapy | 5-fluorouracil | CR |
| Page: 1 2 3 4 5 6 |
Top |
Related drugs of malignant transformation related genes |
| Identification of chemicals and drugs interact with genes involved in malignant transfromation |
| (DGIdb 4.0) |
| Entrez ID | Symbol | Category | Interaction Types | Drug Claim Name | Drug Name | PMIDs |
| 3990 | LIPC | ENZYME, PHOSPHOLIPASE, LIPASE, DRUGGABLE GENOME | ETHANOL | ALCOHOL | 7163806 | |
| 3990 | LIPC | ENZYME, PHOSPHOLIPASE, LIPASE, DRUGGABLE GENOME | pravastatin | PRAVASTATIN | 16103896,16115483 | |
| 3990 | LIPC | ENZYME, PHOSPHOLIPASE, LIPASE, DRUGGABLE GENOME | fluvastatin | FLUVASTATIN | 16103896 | |
| 3990 | LIPC | ENZYME, PHOSPHOLIPASE, LIPASE, DRUGGABLE GENOME | HEMOCLAR | PENTOSAN POLYSULFATE SODIUM | 2433786 | |
| 3990 | LIPC | ENZYME, PHOSPHOLIPASE, LIPASE, DRUGGABLE GENOME | ATORVASTATIN | ATORVASTATIN | 12547874 | |
| 3990 | LIPC | ENZYME, PHOSPHOLIPASE, LIPASE, DRUGGABLE GENOME | HEPARIN | HEPARIN | 4082106,3360217 | |
| 3990 | LIPC | ENZYME, PHOSPHOLIPASE, LIPASE, DRUGGABLE GENOME | simvastatin | SIMVASTATIN | 16103896 |
| Page: 1 |

Copyright 2023-Present -The University of Texas Health Science Center at Houston |