Schematic overview of the cellular and molecular mechanisms involved in the cancer progression, including the proposed cellular and molecular mechanisms in cancer cells trajectory. AT1: alveolar type 1 cells; AT2: alveolar type 2 cells; AAH: atypical adenomatous hyperplasia; AIS: adenocarcinoma in situ; MIA: minimally invasive adenocarcinoma; IA: invasive adenocarcinoma; EMT: epithelial-mesenchymal transition

Home

Download

Statistics

Help

Contact

Center for Computational Systems Medicine
leaf

Gene summary

leaf

Malignant transformation analysis

leaf

Malignant transformation related pathway analysis

leaf

Cell-cell communication analysis

leaf

Single-cell gene regulatory network inference analysis

leaf

Somatic mutation of malignant transformation related genes

leaf

Related drugs of malignant transformation related genes

Gene: KIF20B

Gene summary for KIF20B

check button Gene summary.

Gene informationSpeciesHuman
Gene symbol

KIF20B

Gene ID

9585

Gene namekinesin family member 20B
Gene AliasCT90
Cytomap10q23.31
Gene Typeprotein-coding
GO ID

GO:0000278

UniProtAcc

Q96Q89


Top

Malignant transformation analysis

check button Identification of the aberrant gene expression in precancerous and cancerous lesions by comparing the gene expression of stem-like cells in diseased tissues with normal stem cells
check button Malignant transformation involving gene list.
Entrez IDSymbolReplicatesSpeciesOrganTissueAdj P-valueLog2FCMalignancy
9585KIF20BLZE2THumanEsophagusESCC4.17e-049.77e-010.082
9585KIF20BLZE4THumanEsophagusESCC2.08e-022.19e-010.0811
9585KIF20BLZE22THumanEsophagusESCC4.65e-033.92e-010.068
9585KIF20BLZE24THumanEsophagusESCC3.73e-032.23e-010.0596
9585KIF20BP2T-EHumanEsophagusESCC1.02e-247.92e-010.1177
9585KIF20BP4T-EHumanEsophagusESCC1.57e-115.96e-010.1323
9585KIF20BP5T-EHumanEsophagusESCC5.68e-144.72e-010.1327
9585KIF20BP8T-EHumanEsophagusESCC5.95e-082.92e-010.0889
9585KIF20BP10T-EHumanEsophagusESCC1.37e-072.65e-010.116
9585KIF20BP12T-EHumanEsophagusESCC2.45e-092.48e-010.1122
9585KIF20BP15T-EHumanEsophagusESCC1.27e-022.18e-010.1149
9585KIF20BP16T-EHumanEsophagusESCC6.89e-093.06e-010.1153
9585KIF20BP19T-EHumanEsophagusESCC4.25e-022.91e-010.1662
9585KIF20BP20T-EHumanEsophagusESCC2.65e-053.40e-010.1124
9585KIF20BP21T-EHumanEsophagusESCC5.45e-144.89e-010.1617
9585KIF20BP22T-EHumanEsophagusESCC1.81e-021.30e-010.1236
9585KIF20BP23T-EHumanEsophagusESCC4.61e-032.26e-010.108
9585KIF20BP24T-EHumanEsophagusESCC4.40e-042.65e-010.1287
9585KIF20BP26T-EHumanEsophagusESCC2.17e-114.18e-010.1276
9585KIF20BP27T-EHumanEsophagusESCC4.31e-072.95e-010.1055
Page: 1 2 3 4 

check button Transcriptomic changes along malignancy continuum.
TissueExpression DynamicsAbbreviation
EsophagusThe image shows the transcriptomic changes along malignancy continuum.log2FC in expression of this searched gene in stem-like cells from each diseased tissue sample relative to stem-like cells in normal samples in each tissue plotted against the malignancy continuum. Samples are colored based on if they are from different disease stage.
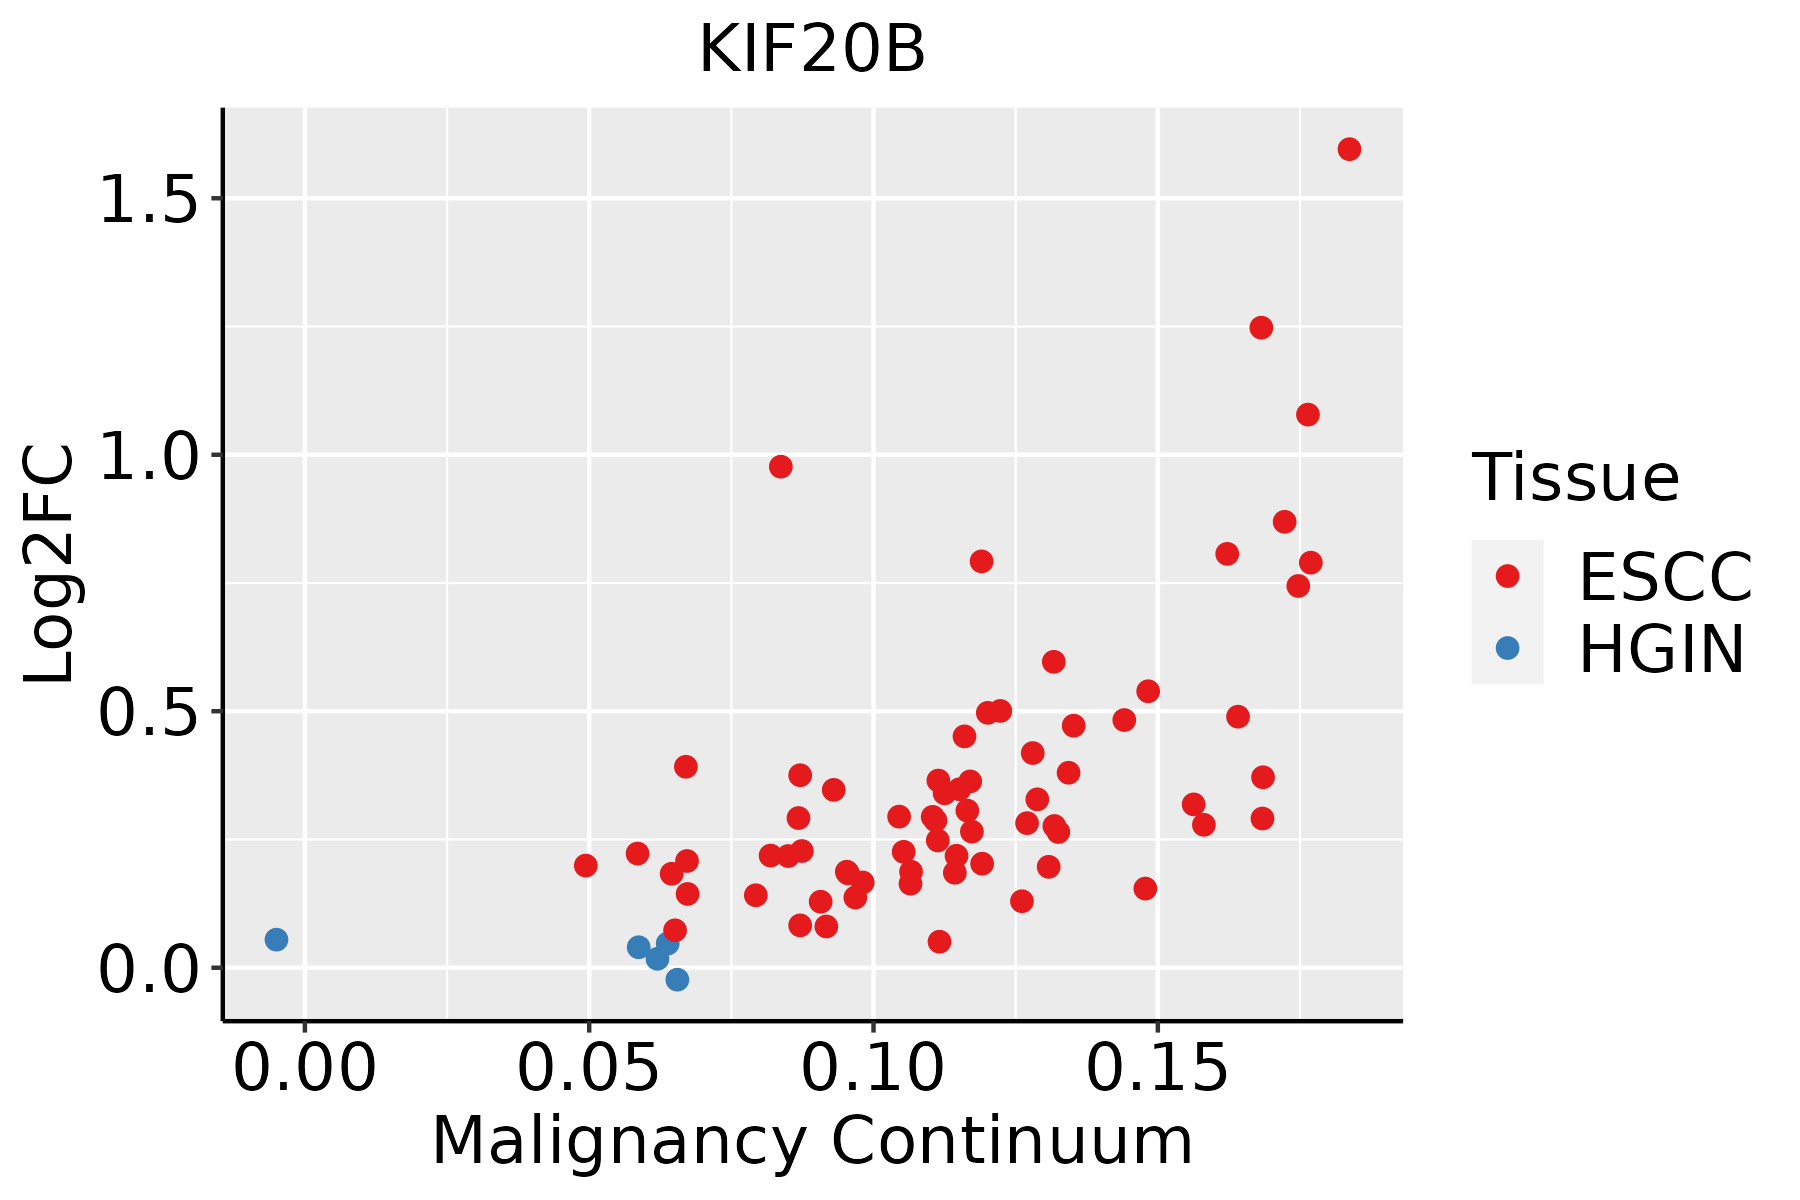
ESCC: Esophageal squamous cell carcinoma
HGIN: High-grade intraepithelial neoplasias
LGIN: Low-grade intraepithelial neoplasias
LiverThe image shows the transcriptomic changes along malignancy continuum.log2FC in expression of this searched gene in stem-like cells from each diseased tissue sample relative to stem-like cells in normal samples in each tissue plotted against the malignancy continuum. Samples are colored based on if they are from different disease stage.
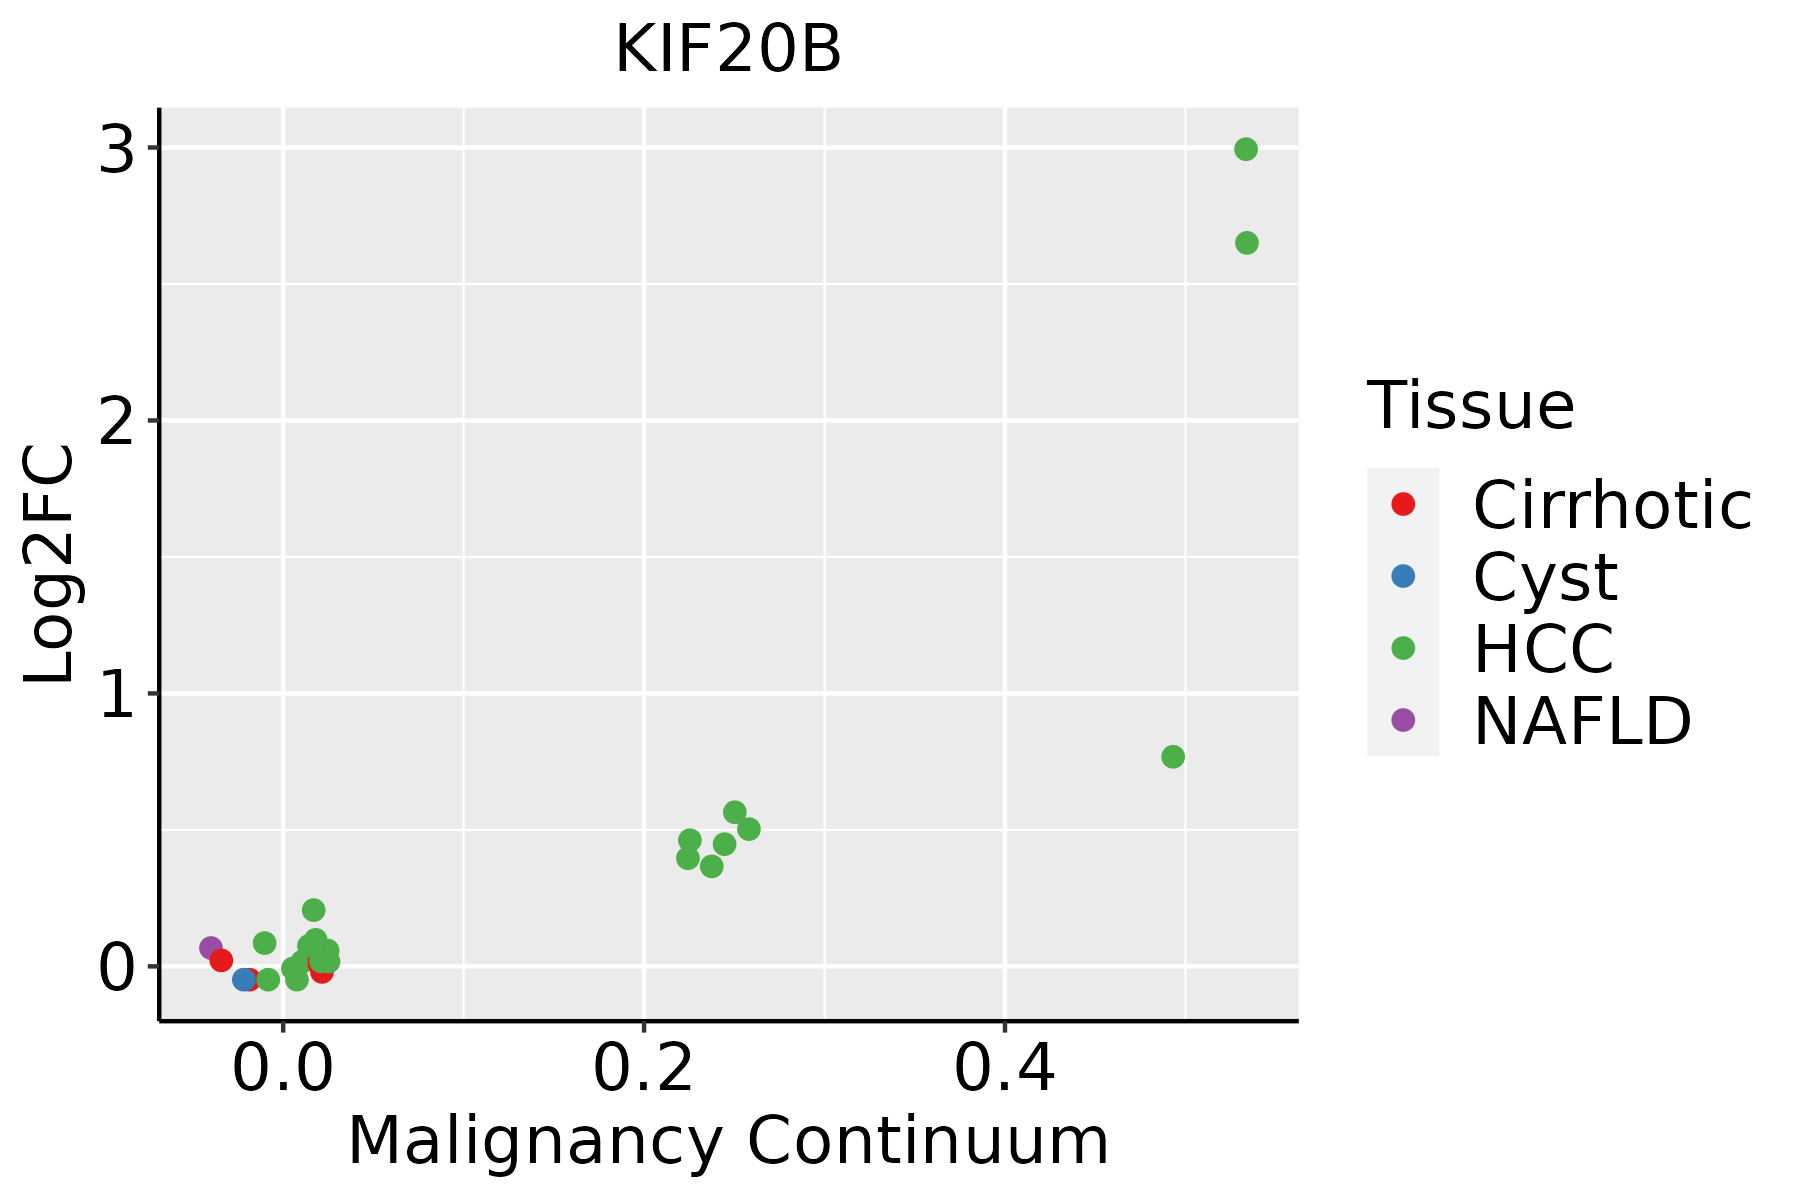
HCC: Hepatocellular carcinoma
NAFLD: Non-alcoholic fatty liver disease
Oral CavityThe image shows the transcriptomic changes along malignancy continuum.log2FC in expression of this searched gene in stem-like cells from each diseased tissue sample relative to stem-like cells in normal samples in each tissue plotted against the malignancy continuum. Samples are colored based on if they are from different disease stage.
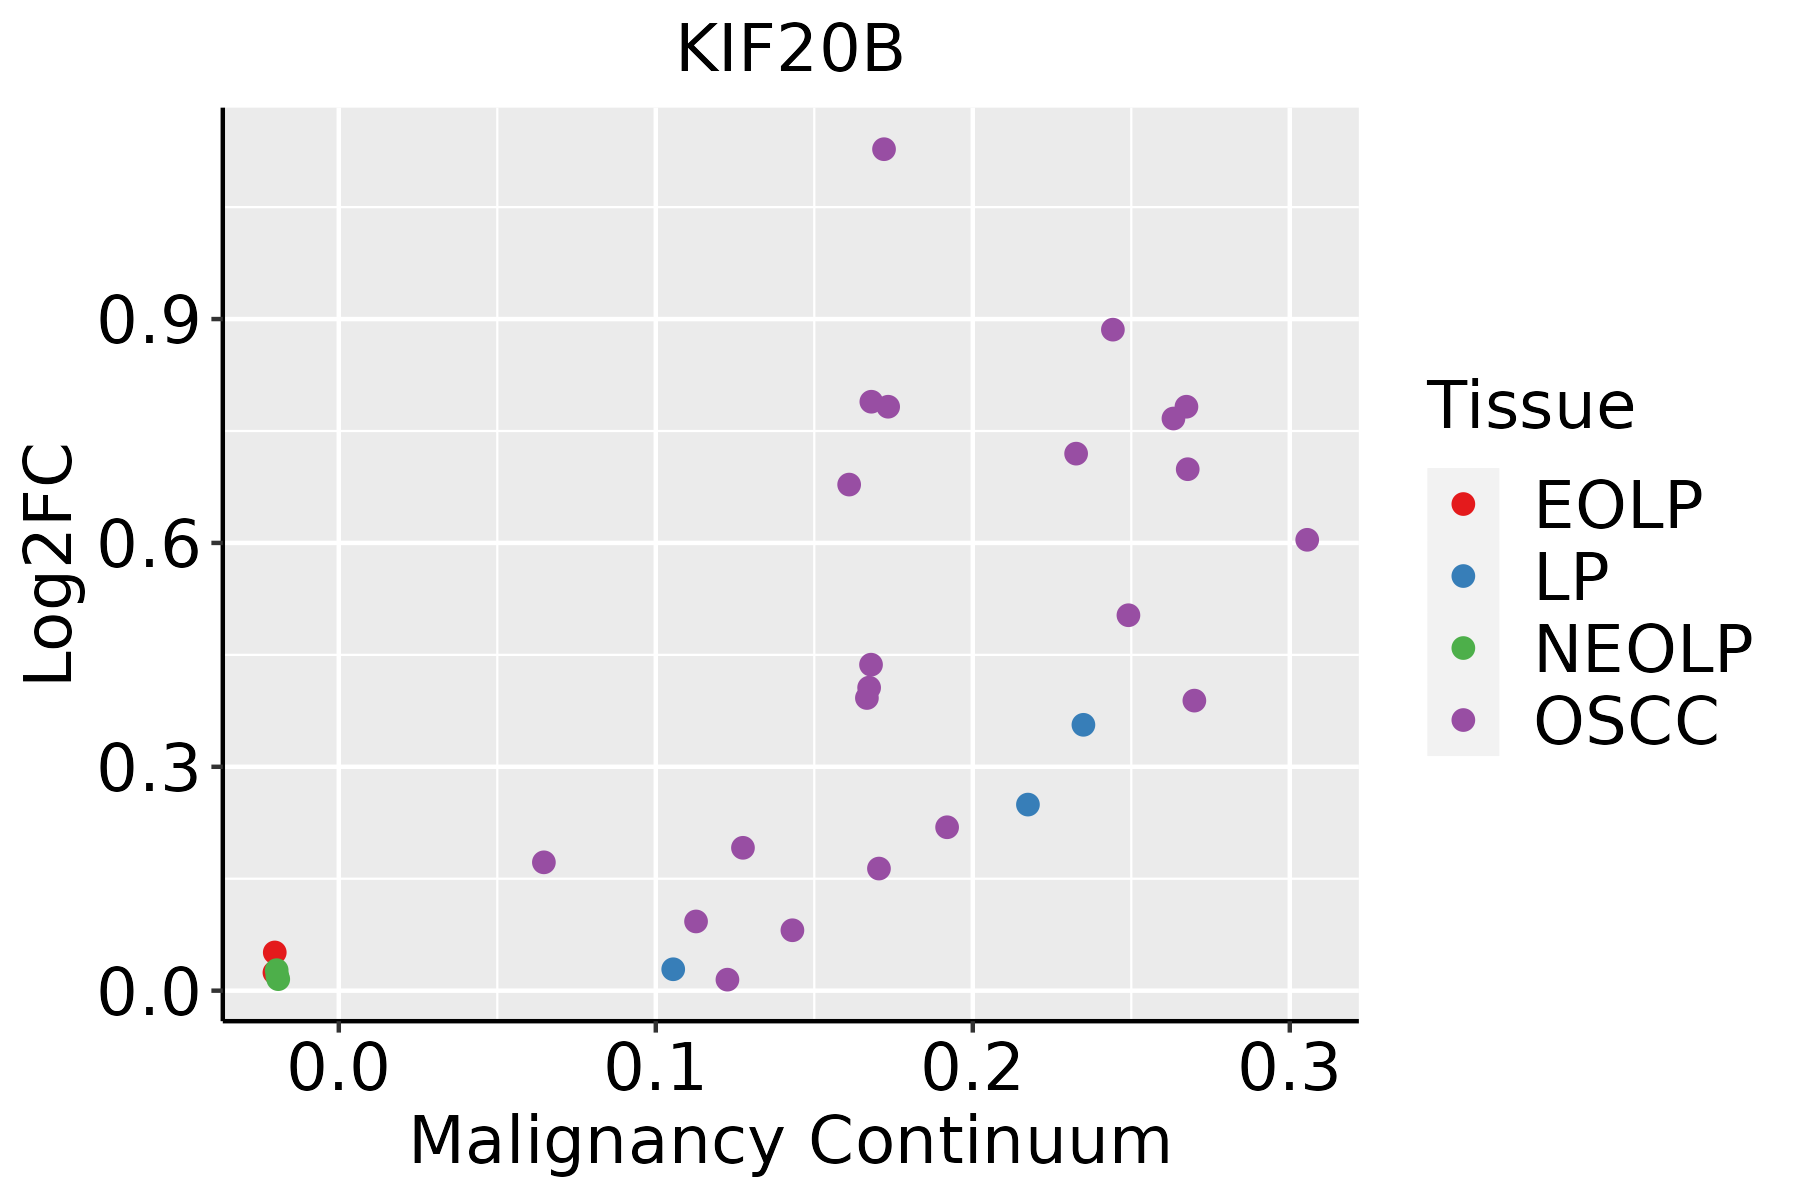
EOLP: Erosive Oral lichen planus
LP: leukoplakia
NEOLP: Non-erosive oral lichen planus
OSCC: Oral squamous cell carcinoma
SkinThe image shows the transcriptomic changes along malignancy continuum.log2FC in expression of this searched gene in stem-like cells from each diseased tissue sample relative to stem-like cells in normal samples in each tissue plotted against the malignancy continuum. Samples are colored based on if they are from different disease stage.AK: Actinic keratosis
cSCC: Cutaneous squamous cell carcinoma
SCCIS:squamous cell carcinoma in situ
ThyroidThe image shows the transcriptomic changes along malignancy continuum.log2FC in expression of this searched gene in stem-like cells from each diseased tissue sample relative to stem-like cells in normal samples in each tissue plotted against the malignancy continuum. Samples are colored based on if they are from different disease stage.
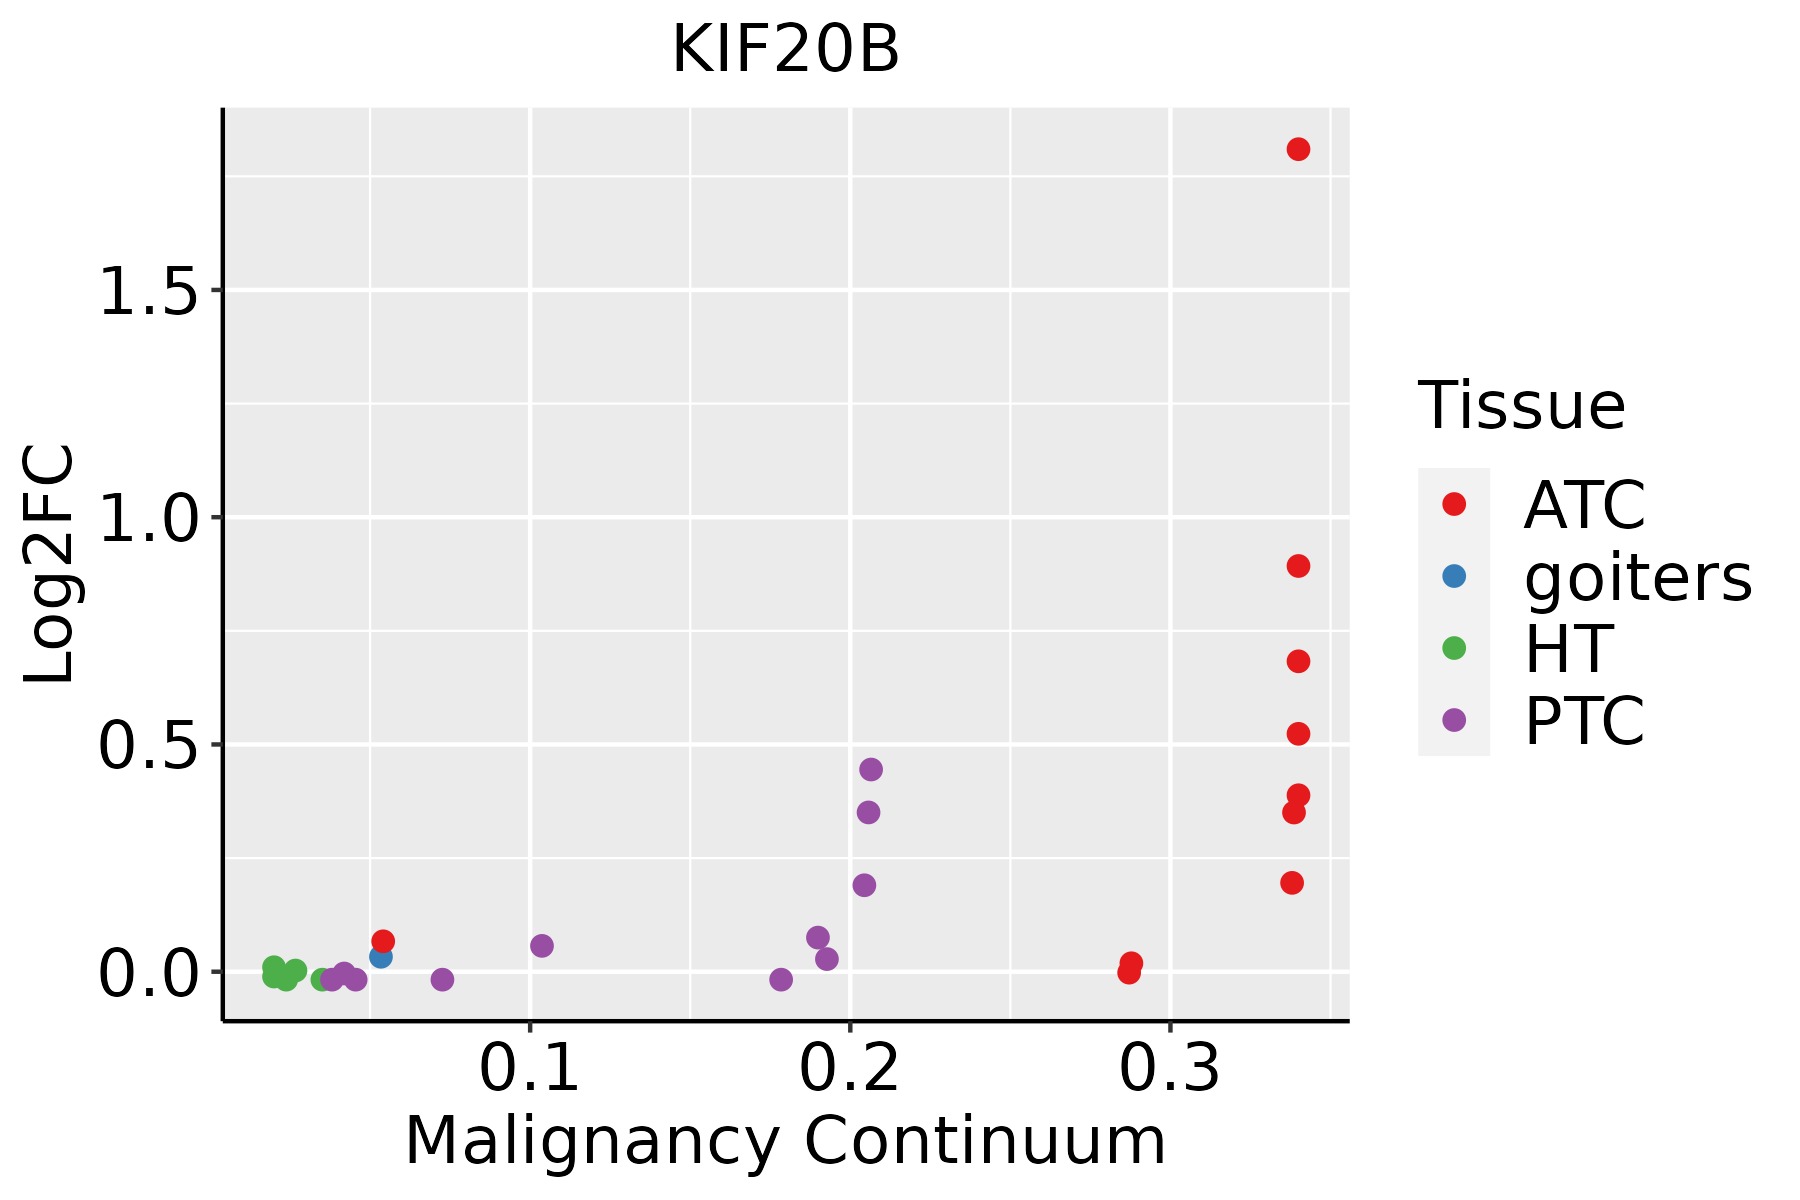
ATC: Anaplastic thyroid cancer
HT: Hashimoto's thyroiditis
PTC: Papillary thyroid cancer
∗log2FC in expression of this searched gene in stem-like cells from each diseased tissue sample relative to stem-like cells in normal samples in each tissue plotted against the malignancy continuum. Samples are colored based on if they are from different disease stage.

Top

Malignant transformation related pathway analysis

check buttonFind out the enriched GO biological processes and KEGG pathways involved in transition from healthy to precancer to cancer
check button Figure of enriched GO biological processes.
TissueDisease StageEnriched GO biological Processes
ColorectumADGO analysis - Figure of enriched GO biological processes: Top 15 enriched GO BP terms are showed in the bar plot of each disease state in each tissue. Each row represents a significant GO biological process which is colored according to the -log10(p.adjust).
ColorectumSERGO analysis - Figure of enriched GO biological processes: Top 15 enriched GO BP terms are showed in the bar plot of each disease state in each tissue. Each row represents a significant GO biological process which is colored according to the -log10(p.adjust).
ColorectumMSSGO analysis - Figure of enriched GO biological processes: Top 15 enriched GO BP terms are showed in the bar plot of each disease state in each tissue. Each row represents a significant GO biological process which is colored according to the -log10(p.adjust).
ColorectumMSI-HGO analysis - Figure of enriched GO biological processes: Top 15 enriched GO BP terms are showed in the bar plot of each disease state in each tissue. Each row represents a significant GO biological process which is colored according to the -log10(p.adjust).
ColorectumFAPGO analysis - Figure of enriched GO biological processes: Top 15 enriched GO BP terms are showed in the bar plot of each disease state in each tissue. Each row represents a significant GO biological process which is colored according to the -log10(p.adjust).
∗Top 15 enriched GO BP terms are showed in the bar plot of each disease state in each tissue. Each row represents a significant GO biological process which is colored according to the -log10(p.adjust).
Page: 1 2 3 4 5 6 7 8 9 

check button Enriched GO biological processes.
GO IDTissueDisease StageDescriptionGene RatioBg Ratiopvaluep.adjustCount
GO:007269811LiverHCCprotein localization to microtubule cytoskeleton35/795854/187237.73e-044.65e-0335
GO:00606063LiverHCCtube closure53/795889/187238.67e-045.14e-0353
GO:0007088LiverHCCregulation of mitotic nuclear division63/7958110/187231.24e-036.85e-0363
GO:00219154LiverHCCneural tube development82/7958152/187232.83e-031.33e-0282
GO:00018384LiverHCCembryonic epithelial tube formation66/7958121/187234.94e-032.07e-0266
GO:00721754LiverHCCepithelial tube formation70/7958132/187239.29e-033.57e-0270
GO:00351484LiverHCCtube formation77/7958148/187231.20e-024.39e-0277
GO:003238615Oral cavityOSCCregulation of intracellular transport218/7305337/187236.91e-221.41e-19218
GO:01400145Oral cavityOSCCmitotic nuclear division191/7305287/187231.99e-213.70e-19191
GO:003315718Oral cavityOSCCregulation of intracellular protein transport155/7305229/187231.05e-181.28e-16155
GO:00073469Oral cavityOSCCregulation of mitotic cell cycle266/7305457/187233.87e-173.41e-15266
GO:190495119Oral cavityOSCCpositive regulation of establishment of protein localization196/7305319/187232.89e-162.20e-14196
GO:005122219Oral cavityOSCCpositive regulation of protein transport187/7305303/187237.37e-165.49e-14187
GO:003238818Oral cavityOSCCpositive regulation of intracellular transport134/7305202/187232.82e-151.88e-13134
GO:009031610Oral cavityOSCCpositive regulation of intracellular protein transport110/7305160/187232.10e-141.19e-12110
GO:00482852Oral cavityOSCCorganelle fission265/7305488/187233.22e-121.27e-10265
GO:00002801Oral cavityOSCCnuclear division237/7305439/187239.62e-112.90e-09237
GO:000716318Oral cavityOSCCestablishment or maintenance of cell polarity129/7305218/187231.16e-092.86e-08129
GO:00457879Oral cavityOSCCpositive regulation of cell cycle173/7305313/187233.28e-097.44e-08173
GO:00325065Oral cavityOSCCcytokinetic process33/730539/187235.91e-091.26e-0733
Page: 1 2 3 4 5 6 7 8 9 10 11 

check button Enriched KEGG pathways.
Pathway IDTissueDisease StageDescriptionGene RatioBg Ratiopvaluep.adjustqvalueCount
Page: 1 

Top

Cell-cell communication analysis

check buttonIdentification of potential cell-cell interactions between two cell types and their ligand-receptor pairs for different disease states
LigandReceptorLRpairPathwayTissueDisease Stage
Page: 1 

Top

Single-cell gene regulatory network inference analysis

check buttonFind out the significant the regulons (TFs) and the target genes of each regulon across cell types for different disease states
TFCell TypeTissueDisease StageTarget GeneRSSRegulon Activity
∗The dot plots of a searched regulon are shown for all cell subpopulations in each disease state of each tissue based on the regulon specific score inferred using pySCENIC and by calculating the average expression.
Page: 1 

Top

Somatic mutation of malignant transformation related genes

check buttonAnnotation of somatic variants for genes involved in malignant transformation
Hugo SymbolVariant ClassVariant ClassificationdbSNP RSHGVScHGVSpHGVSp ShortSWISSPROTBIOTYPESIFTPolyPhenTumor Sample BarcodeTissueHistologySexAgeStageTherapy TypesDrugsOutcome
KIF20BSNVMissense_Mutationc.2560N>Tp.Ser854Cysp.S854CQ96Q89protein_codingtolerated(0.12)possibly_damaging(0.887)TCGA-A8-A09A-01Breastbreast invasive carcinomaFemale<65I/IIHormone TherapytamoxiphenSD
KIF20BSNVMissense_Mutationc.5099T>Ap.Ile1700Lysp.I1700KQ96Q89protein_codingtolerated(0.05)benign(0.01)TCGA-AC-A23H-01Breastbreast invasive carcinomaFemale>=65I/IIUnknownUnknownPD
KIF20BSNVMissense_Mutationc.3128N>Ap.Arg1043Glnp.R1043QQ96Q89protein_codingtolerated(0.61)benign(0)TCGA-AN-A046-01Breastbreast invasive carcinomaFemale>=65I/IIUnknownUnknownSD
KIF20BSNVMissense_Mutationnovelc.3230N>Cp.Gln1077Prop.Q1077PQ96Q89protein_codingdeleterious(0.01)benign(0.278)TCGA-AN-A046-01Breastbreast invasive carcinomaFemale>=65I/IIUnknownUnknownSD
KIF20BSNVMissense_Mutationnovelc.2411C>Gp.Ser804Cysp.S804CQ96Q89protein_codingdeleterious(0.02)benign(0.439)TCGA-BH-A0B6-01Breastbreast invasive carcinomaFemale<65I/IIUnknownUnknownSD
KIF20BSNVMissense_Mutationnovelc.825N>Gp.Phe275Leup.F275LQ96Q89protein_codingdeleterious(0)probably_damaging(0.987)TCGA-E9-A3X8-01Breastbreast invasive carcinomaFemale<65I/IIChemotherapycyclophosphaneCR
KIF20BSNVMissense_Mutationnovelc.1783N>Ap.Leu595Ilep.L595IQ96Q89protein_codingdeleterious(0.01)probably_damaging(0.913)TCGA-Z7-A8R5-01Breastbreast invasive carcinomaFemale<65III/IVChemotherapyadriamycinPD
KIF20BinsertionNonsense_Mutationnovelc.1385_1386insATTTTAGGp.Tyr463PhefsTer2p.Y463Ffs*2Q96Q89protein_codingTCGA-A7-A0CJ-01Breastbreast invasive carcinomaFemale<65I/IIChemotherapycytoxanSD
KIF20BinsertionNonsense_Mutationnovelc.1387_1388insGAGTAAATATAAATCAGCCTTCp.Tyr463Terp.Y463*Q96Q89protein_codingTCGA-A7-A0CJ-01Breastbreast invasive carcinomaFemale<65I/IIChemotherapycytoxanSD
KIF20BinsertionNonsense_Mutationnovelc.4957_4958insGAGGAGGCTGAGATp.Ala1653GlyfsTer4p.A1653Gfs*4Q96Q89protein_codingTCGA-AO-A128-01Breastbreast invasive carcinomaFemale<65I/IIChemotherapydoxorubicinSD
Page: 1 2 3 4 5 6 7 8 9 10 11 12 13 14 15 16 17 18 19 20 21 

Top

Related drugs of malignant transformation related genes

check buttonIdentification of chemicals and drugs interact with genes involved in malignant transfromation
(DGIdb 4.0)
Entrez IDSymbolCategoryInteraction TypesDrug Claim NameDrug NamePMIDs
Page: 1