
|
|||||
|
 | |
| |
| |
| |
| |
| |
|
Gene: KHDC4 |
Gene summary for KHDC4 |
| Gene information | Species | Human | Gene symbol | KHDC4 | Gene ID | 22889 |
| Gene name | KH domain containing 4, pre-mRNA splicing factor | |
| Gene Alias | BLOM7 | |
| Cytomap | 1q22 | |
| Gene Type | protein-coding | GO ID | GO:0000245 | UniProtAcc | Q7Z7F0 |
Top |
Malignant transformation analysis |
| Identification of the aberrant gene expression in precancerous and cancerous lesions by comparing the gene expression of stem-like cells in diseased tissues with normal stem cells |
| Entrez ID | Symbol | Replicates | Species | Organ | Tissue | Adj P-value | Log2FC | Malignancy |
| 22889 | KHDC4 | CCI_1 | Human | Cervix | CC | 9.09e-12 | 1.04e+00 | 0.528 |
| 22889 | KHDC4 | CCI_2 | Human | Cervix | CC | 7.47e-06 | 7.68e-01 | 0.5249 |
| 22889 | KHDC4 | CCI_3 | Human | Cervix | CC | 6.68e-04 | 6.48e-01 | 0.516 |
| 22889 | KHDC4 | Tumor | Human | Cervix | CC | 4.13e-06 | -1.75e-01 | 0.1241 |
| 22889 | KHDC4 | HTA11_3410_2000001011 | Human | Colorectum | AD | 1.45e-03 | -3.23e-01 | 0.0155 |
| 22889 | KHDC4 | HTA11_99999970781_79442 | Human | Colorectum | MSS | 5.44e-33 | -5.26e-01 | 0.294 |
| 22889 | KHDC4 | HTA11_99999965104_69814 | Human | Colorectum | MSS | 2.69e-10 | -5.26e-01 | 0.281 |
| 22889 | KHDC4 | HTA11_99999971662_82457 | Human | Colorectum | MSS | 1.38e-30 | -5.26e-01 | 0.3859 |
| 22889 | KHDC4 | HTA11_99999973899_84307 | Human | Colorectum | MSS | 1.13e-07 | -5.26e-01 | 0.2585 |
| 22889 | KHDC4 | HTA11_99999974143_84620 | Human | Colorectum | MSS | 8.80e-32 | -5.26e-01 | 0.3005 |
| 22889 | KHDC4 | A002-C-010 | Human | Colorectum | FAP | 1.31e-03 | -1.99e-01 | 0.242 |
| 22889 | KHDC4 | A001-C-207 | Human | Colorectum | FAP | 1.03e-02 | -2.14e-01 | 0.1278 |
| 22889 | KHDC4 | A015-C-203 | Human | Colorectum | FAP | 1.52e-21 | -4.26e-01 | -0.1294 |
| 22889 | KHDC4 | A015-C-204 | Human | Colorectum | FAP | 4.22e-04 | -2.82e-01 | -0.0228 |
| 22889 | KHDC4 | A014-C-040 | Human | Colorectum | FAP | 3.56e-02 | -3.38e-01 | -0.1184 |
| 22889 | KHDC4 | A002-C-201 | Human | Colorectum | FAP | 4.09e-13 | -3.83e-01 | 0.0324 |
| 22889 | KHDC4 | A002-C-203 | Human | Colorectum | FAP | 2.78e-04 | -2.16e-01 | 0.2786 |
| 22889 | KHDC4 | A001-C-119 | Human | Colorectum | FAP | 3.19e-06 | -3.59e-01 | -0.1557 |
| 22889 | KHDC4 | A001-C-108 | Human | Colorectum | FAP | 1.32e-11 | -2.32e-01 | -0.0272 |
| 22889 | KHDC4 | A002-C-205 | Human | Colorectum | FAP | 9.57e-16 | -3.53e-01 | -0.1236 |
| Page: 1 2 3 4 5 6 |
| Tissue | Expression Dynamics | Abbreviation |
| Cervix |  | CC: Cervix cancer |
| HSIL_HPV: HPV-infected high-grade squamous intraepithelial lesions | ||
| N_HPV: HPV-infected normal cervix | ||
| Colorectum (GSE201348) |  | FAP: Familial adenomatous polyposis |
| CRC: Colorectal cancer | ||
| Colorectum (HTA11) |  | AD: Adenomas |
| SER: Sessile serrated lesions | ||
| MSI-H: Microsatellite-high colorectal cancer | ||
| MSS: Microsatellite stable colorectal cancer | ||
| Endometrium | 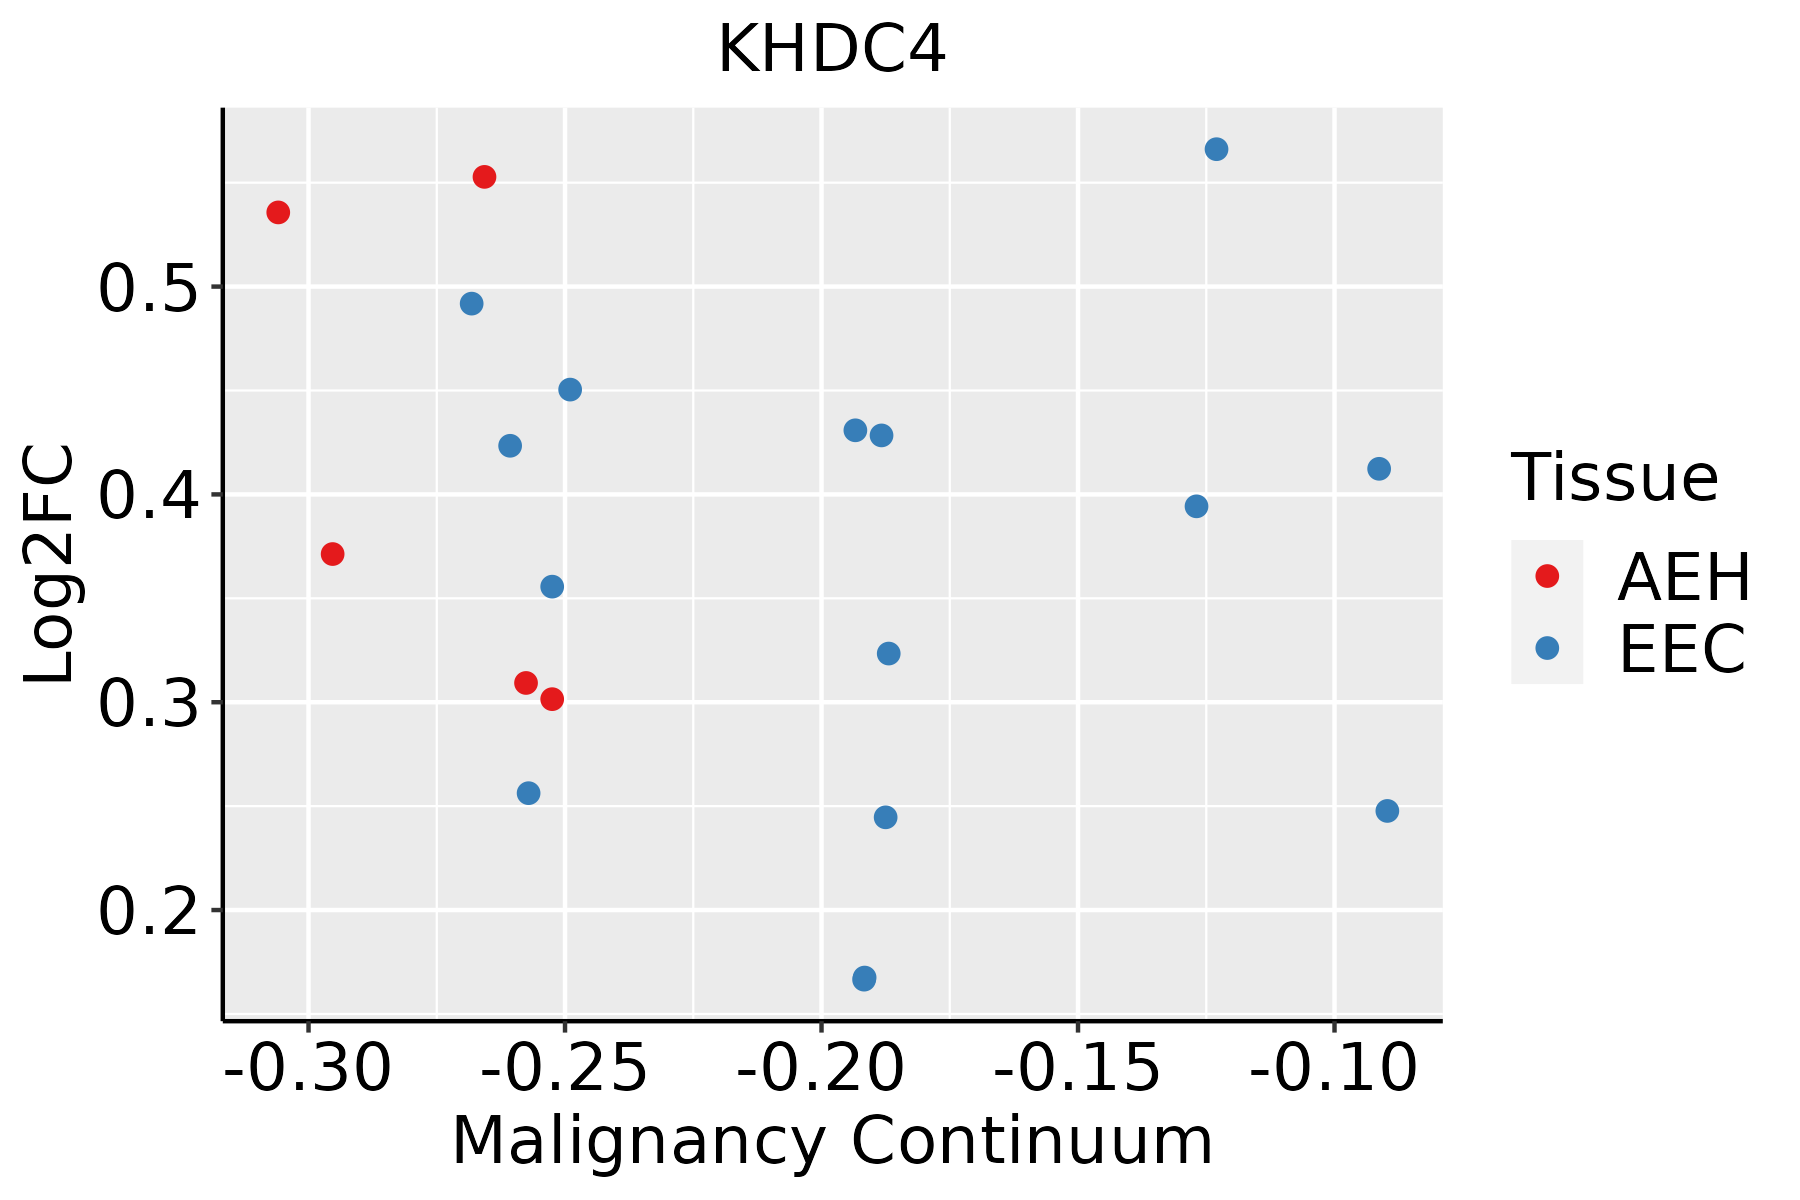 | AEH: Atypical endometrial hyperplasia |
| EEC: Endometrioid Cancer | ||
| Esophagus | 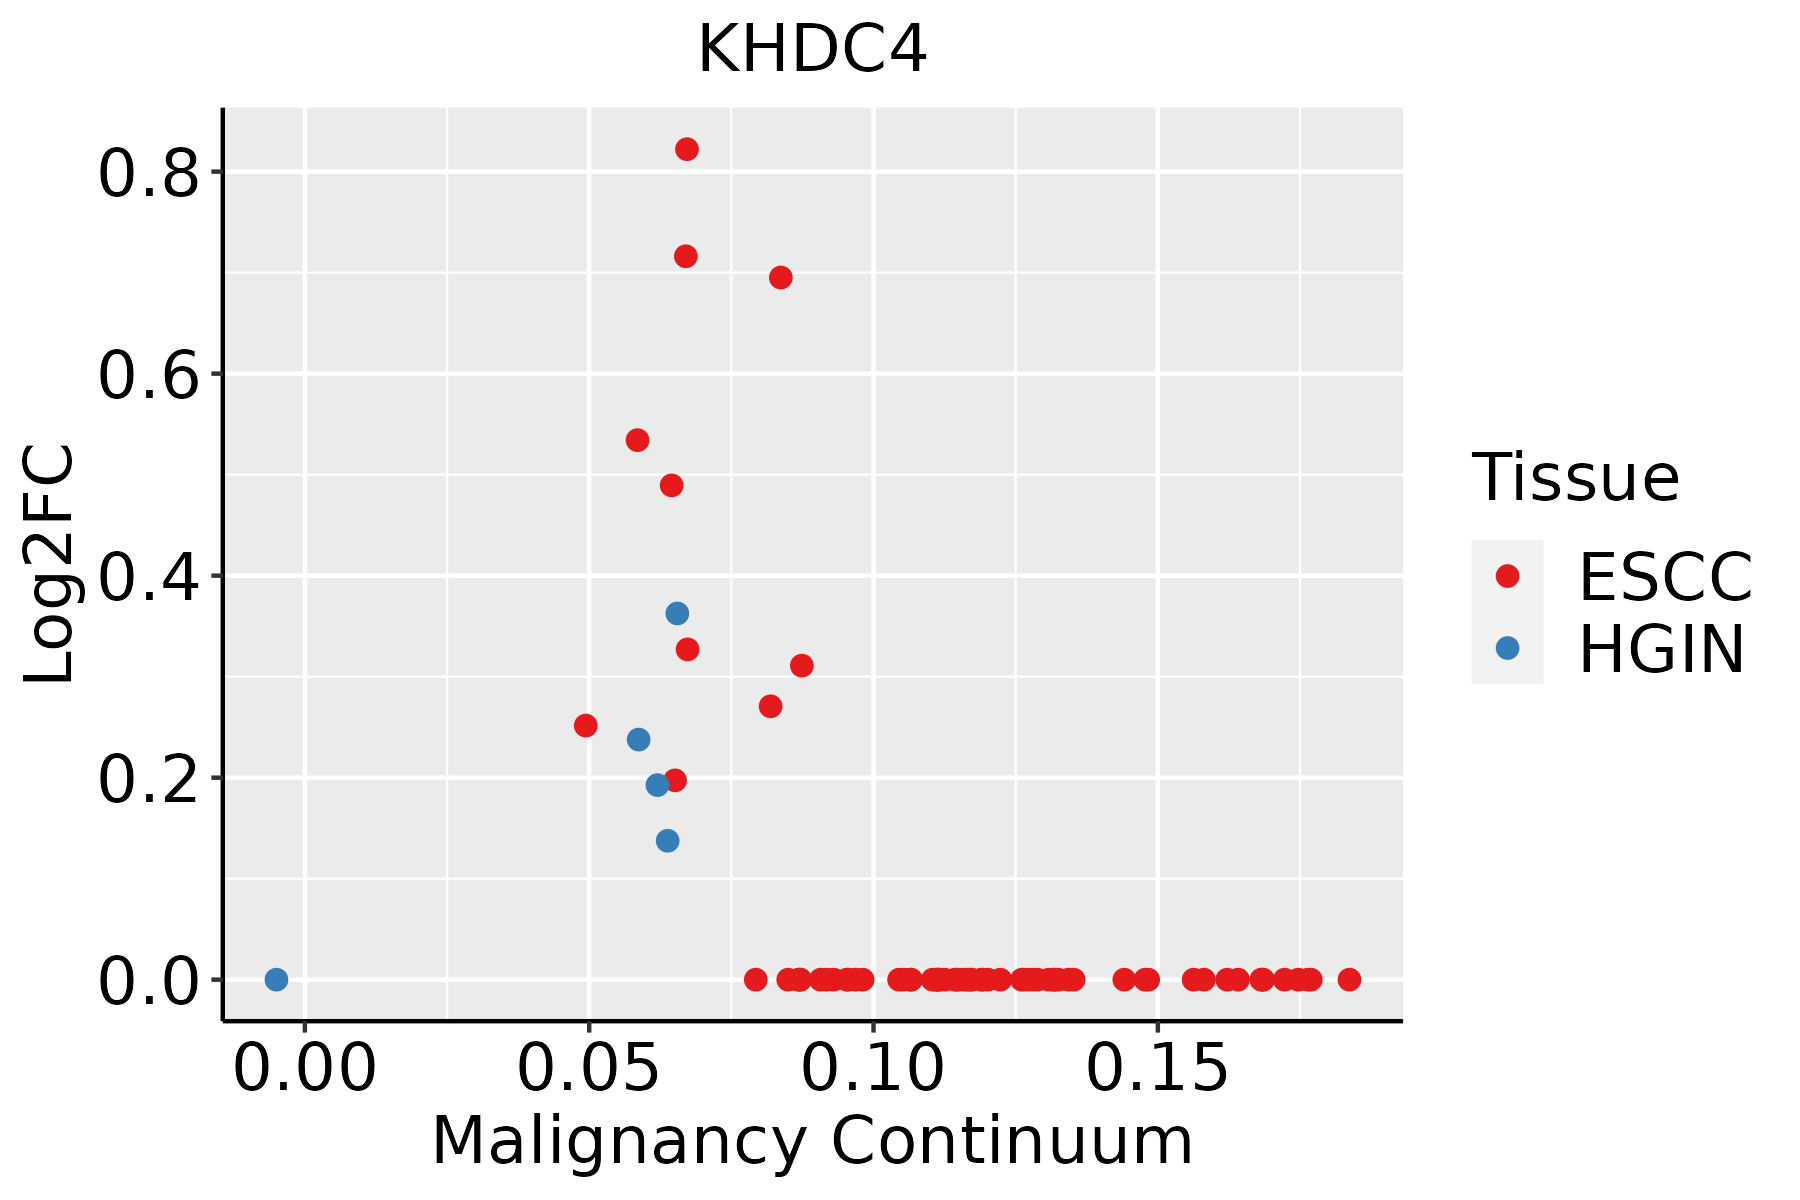 | ESCC: Esophageal squamous cell carcinoma |
| HGIN: High-grade intraepithelial neoplasias | ||
| LGIN: Low-grade intraepithelial neoplasias | ||
| Liver | 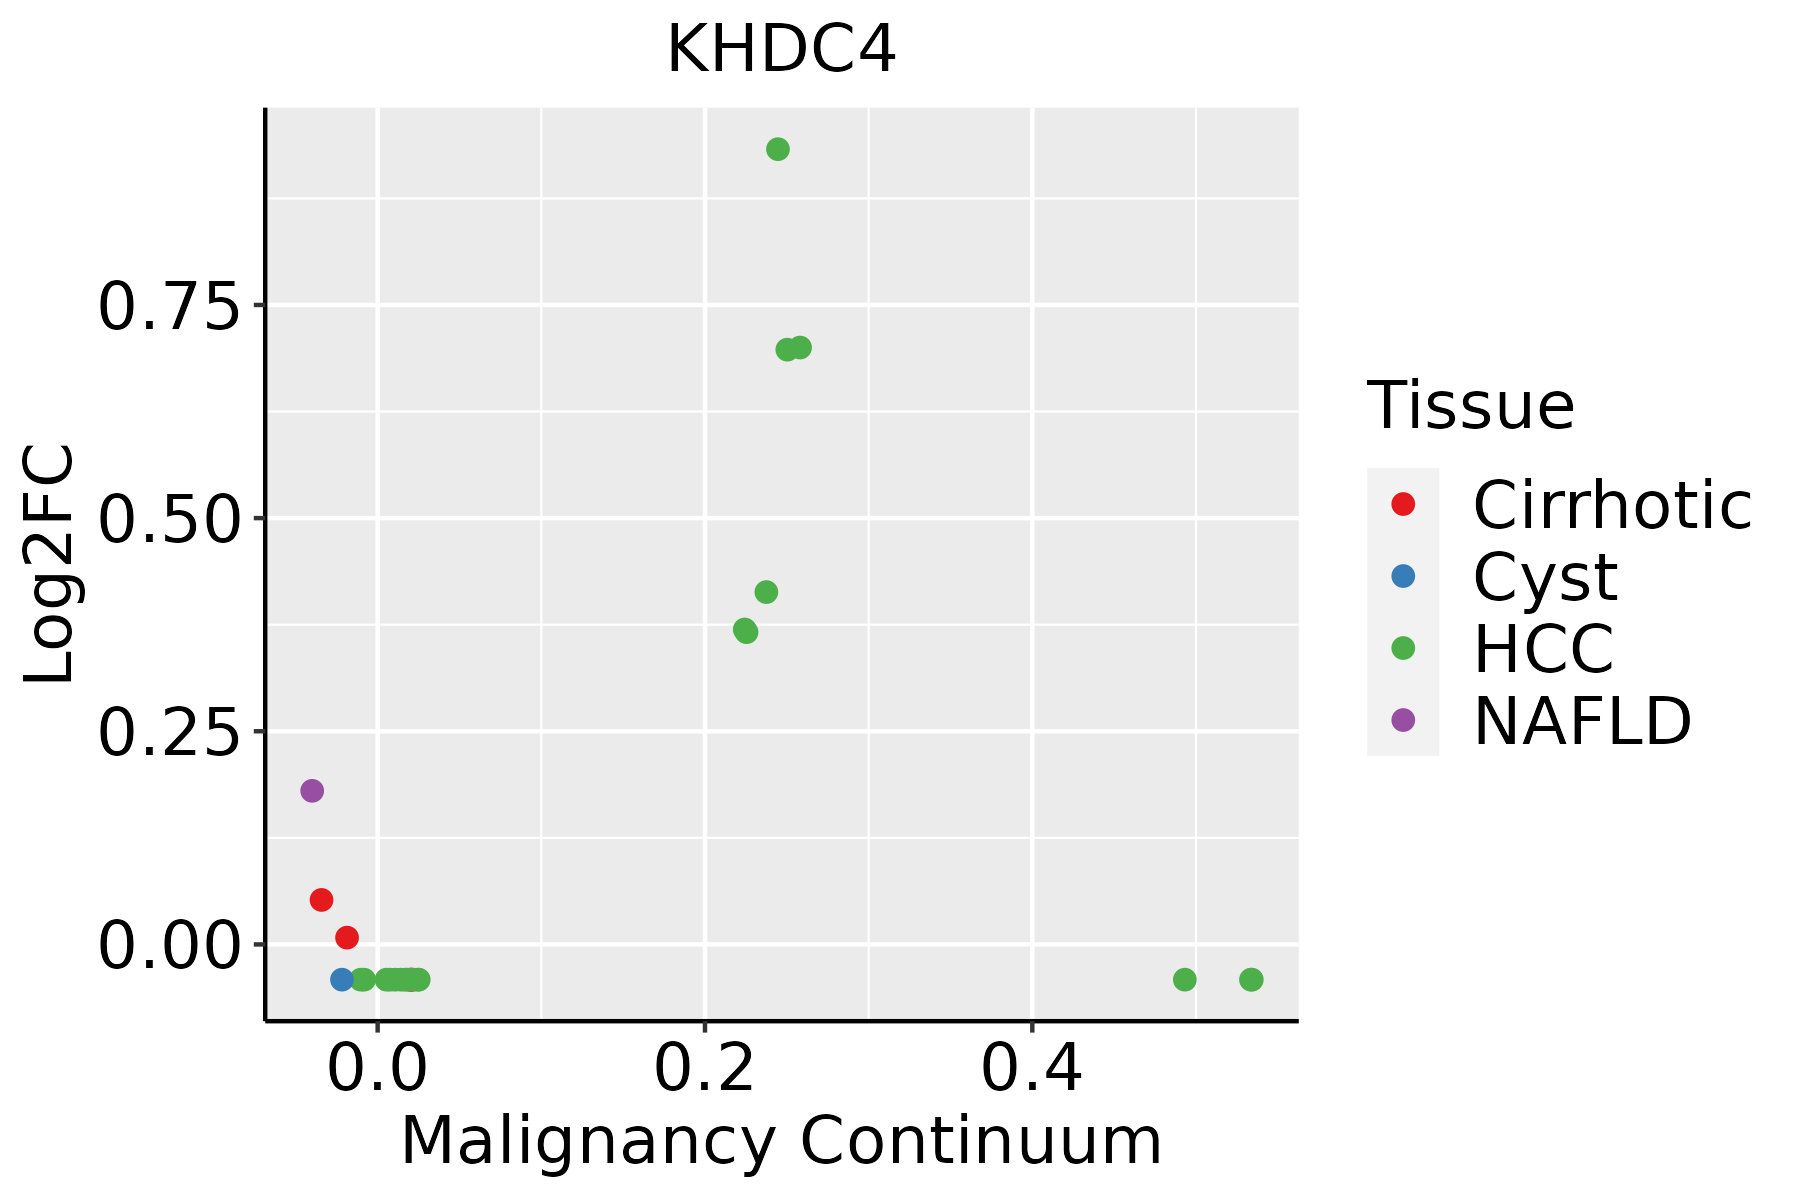 | HCC: Hepatocellular carcinoma |
| NAFLD: Non-alcoholic fatty liver disease | ||
| Lung | 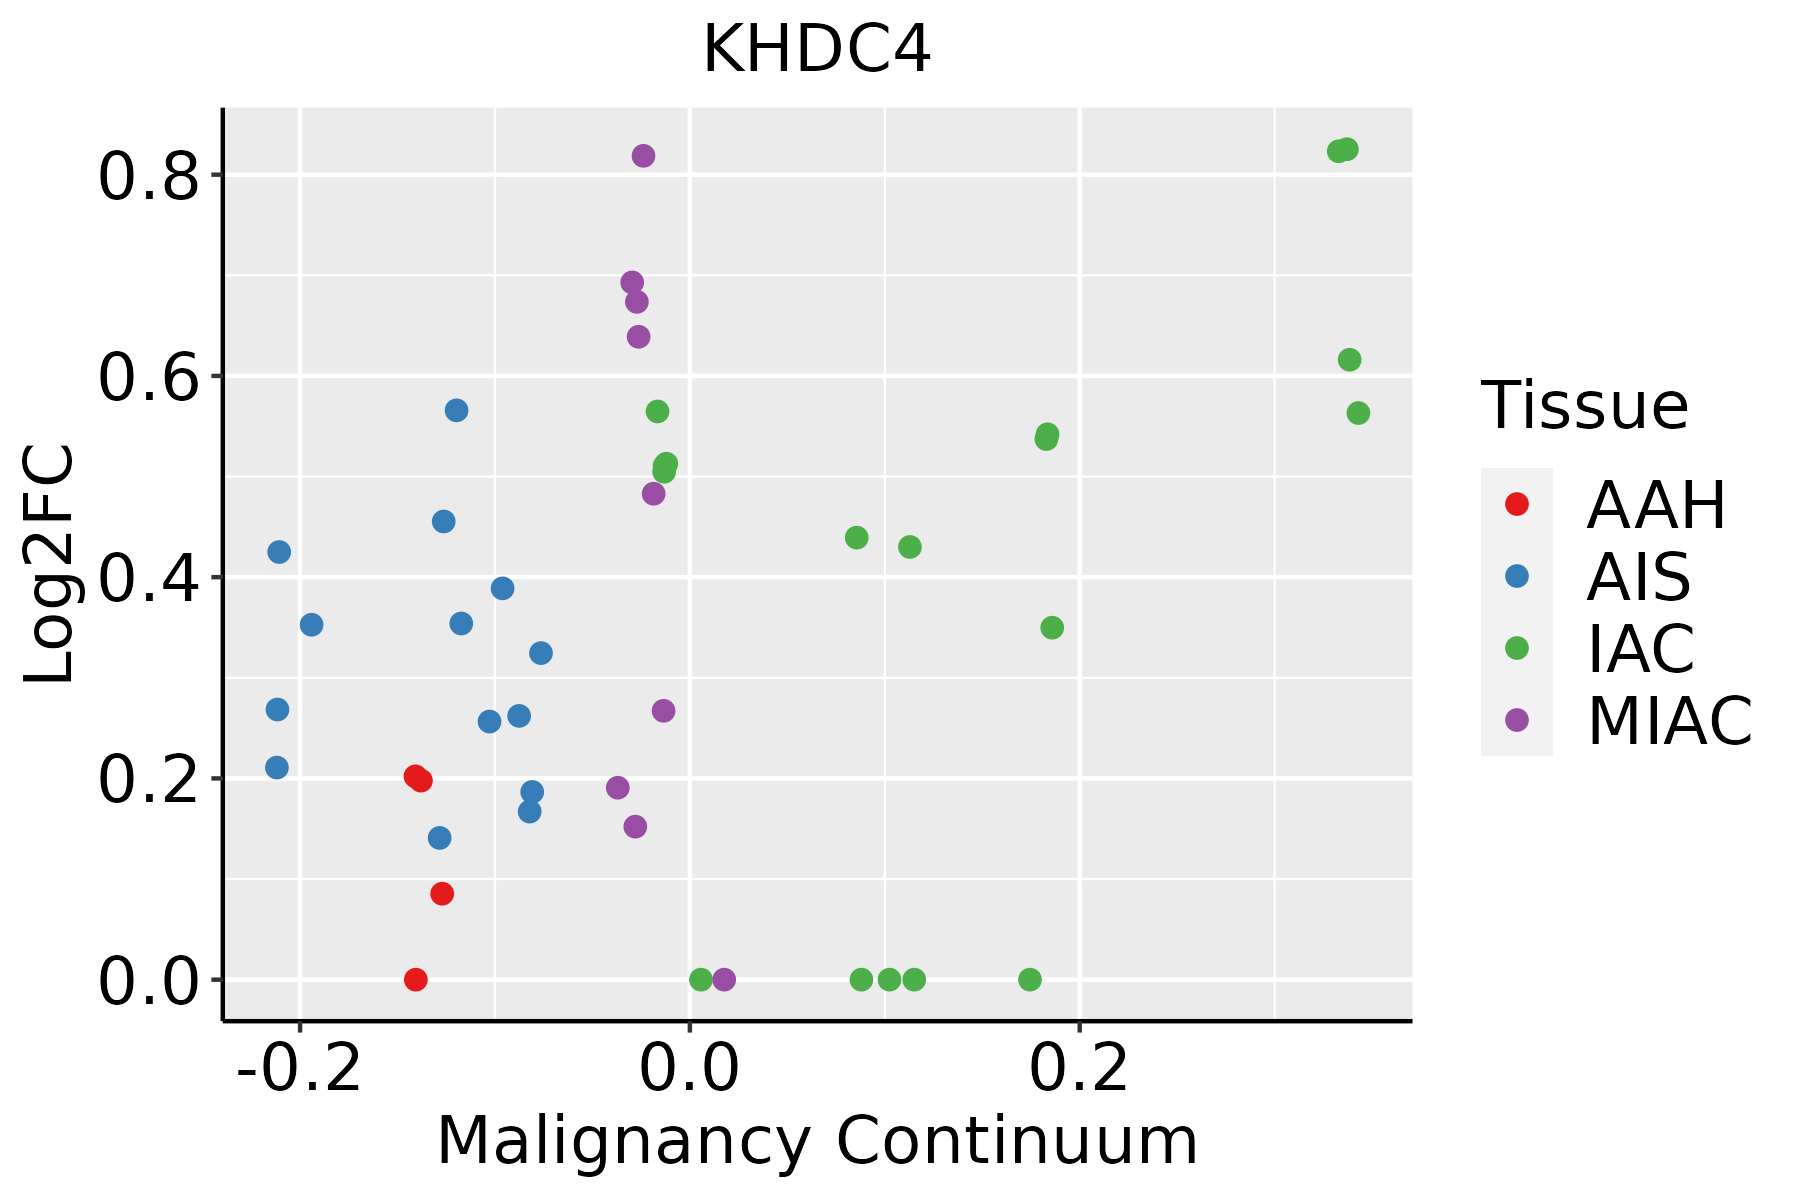 | AAH: Atypical adenomatous hyperplasia |
| AIS: Adenocarcinoma in situ | ||
| IAC: Invasive lung adenocarcinoma | ||
| MIA: Minimally invasive adenocarcinoma | ||
| Thyroid |  | ATC: Anaplastic thyroid cancer |
| HT: Hashimoto's thyroiditis | ||
| PTC: Papillary thyroid cancer |
| ∗log2FC in expression of this searched gene in stem-like cells from each diseased tissue sample relative to stem-like cells in normal samples in each tissue plotted against the malignancy continuum. Samples are colored based on if they are from different disease stage. |
Top |
Malignant transformation related pathway analysis |
| Find out the enriched GO biological processes and KEGG pathways involved in transition from healthy to precancer to cancer |
| Tissue | Disease Stage | Enriched GO biological Processes |
| Colorectum | AD |  |
| Colorectum | SER |  |
| Colorectum | MSS |  |
| Colorectum | MSI-H |  |
| Colorectum | FAP |  |
| ∗Top 15 enriched GO BP terms are showed in the bar plot of each disease state in each tissue. Each row represents a significant GO biological process which is colored according to the -log10(p.adjust). |
| Page: 1 2 3 4 5 6 7 8 9 |
| GO ID | Tissue | Disease Stage | Description | Gene Ratio | Bg Ratio | pvalue | p.adjust | Count |
| GO:002261827 | Esophagus | HGIN | ribonucleoprotein complex assembly | 82/2587 | 220/18723 | 2.07e-18 | 7.36e-16 | 82 |
| GO:00002457 | Esophagus | HGIN | spliceosomal complex assembly | 25/2587 | 79/18723 | 3.74e-05 | 9.30e-04 | 25 |
| GO:00063764 | Esophagus | HGIN | mRNA splice site selection | 15/2587 | 49/18723 | 1.88e-03 | 2.01e-02 | 15 |
| GO:0022613111 | Esophagus | ESCC | ribonucleoprotein complex biogenesis | 365/8552 | 463/18723 | 1.74e-49 | 1.11e-45 | 365 |
| GO:0008380111 | Esophagus | ESCC | RNA splicing | 336/8552 | 434/18723 | 1.74e-42 | 3.67e-39 | 336 |
| GO:0000375111 | Esophagus | ESCC | RNA splicing, via transesterification reactions | 248/8552 | 324/18723 | 3.05e-30 | 1.49e-27 | 248 |
| GO:0000377111 | Esophagus | ESCC | RNA splicing, via transesterification reactions with bulged adenosine as nucleophile | 244/8552 | 320/18723 | 2.52e-29 | 1.07e-26 | 244 |
| GO:0000398111 | Esophagus | ESCC | mRNA splicing, via spliceosome | 244/8552 | 320/18723 | 2.52e-29 | 1.07e-26 | 244 |
| GO:0071826111 | Esophagus | ESCC | ribonucleoprotein complex subunit organization | 166/8552 | 227/18723 | 2.94e-17 | 2.42e-15 | 166 |
| GO:0022618111 | Esophagus | ESCC | ribonucleoprotein complex assembly | 159/8552 | 220/18723 | 8.19e-16 | 5.71e-14 | 159 |
| GO:000024514 | Esophagus | ESCC | spliceosomal complex assembly | 48/8552 | 79/18723 | 4.93e-03 | 1.89e-02 | 48 |
| GO:002261322 | Liver | HCC | ribonucleoprotein complex biogenesis | 355/7958 | 463/18723 | 7.76e-52 | 4.92e-48 | 355 |
| GO:000838022 | Liver | HCC | RNA splicing | 313/7958 | 434/18723 | 1.36e-36 | 1.73e-33 | 313 |
| GO:000037522 | Liver | HCC | RNA splicing, via transesterification reactions | 228/7958 | 324/18723 | 1.47e-24 | 4.06e-22 | 228 |
| GO:000037722 | Liver | HCC | RNA splicing, via transesterification reactions with bulged adenosine as nucleophile | 224/7958 | 320/18723 | 1.16e-23 | 2.62e-21 | 224 |
| GO:000039822 | Liver | HCC | mRNA splicing, via spliceosome | 224/7958 | 320/18723 | 1.16e-23 | 2.62e-21 | 224 |
| GO:007182622 | Liver | HCC | ribonucleoprotein complex subunit organization | 159/7958 | 227/18723 | 3.14e-17 | 3.06e-15 | 159 |
| GO:002261822 | Liver | HCC | ribonucleoprotein complex assembly | 153/7958 | 220/18723 | 3.44e-16 | 2.91e-14 | 153 |
| GO:000024511 | Liver | HCC | spliceosomal complex assembly | 46/7958 | 79/18723 | 3.45e-03 | 1.56e-02 | 46 |
| GO:00718268 | Lung | IAC | ribonucleoprotein complex subunit organization | 46/2061 | 227/18723 | 3.02e-05 | 7.79e-04 | 46 |
| Page: 1 2 3 4 5 6 |
| Pathway ID | Tissue | Disease Stage | Description | Gene Ratio | Bg Ratio | pvalue | p.adjust | qvalue | Count |
| Page: 1 |
Top |
Cell-cell communication analysis |
| Identification of potential cell-cell interactions between two cell types and their ligand-receptor pairs for different disease states |
| Ligand | Receptor | LRpair | Pathway | Tissue | Disease Stage |
| Page: 1 |
Top |
Single-cell gene regulatory network inference analysis |
| Find out the significant the regulons (TFs) and the target genes of each regulon across cell types for different disease states |
| TF | Cell Type | Tissue | Disease Stage | Target Gene | RSS | Regulon Activity |
| ∗The dot plots of a searched regulon are shown for all cell subpopulations in each disease state of each tissue based on the regulon specific score inferred using pySCENIC and by calculating the average expression. |
| Page: 1 |
Top |
Somatic mutation of malignant transformation related genes |
| Annotation of somatic variants for genes involved in malignant transformation |
| Hugo Symbol | Variant Class | Variant Classification | dbSNP RS | HGVSc | HGVSp | HGVSp Short | SWISSPROT | BIOTYPE | SIFT | PolyPhen | Tumor Sample Barcode | Tissue | Histology | Sex | Age | Stage | Therapy Types | Drugs | Outcome |
| Page: 1 |
Top |
Related drugs of malignant transformation related genes |
| Identification of chemicals and drugs interact with genes involved in malignant transfromation |
| (DGIdb 4.0) |
| Entrez ID | Symbol | Category | Interaction Types | Drug Claim Name | Drug Name | PMIDs |
| Page: 1 |

Copyright 2023-Present -The University of Texas Health Science Center at Houston |