| Tissue | Expression Dynamics | Abbreviation |
| Cervix | 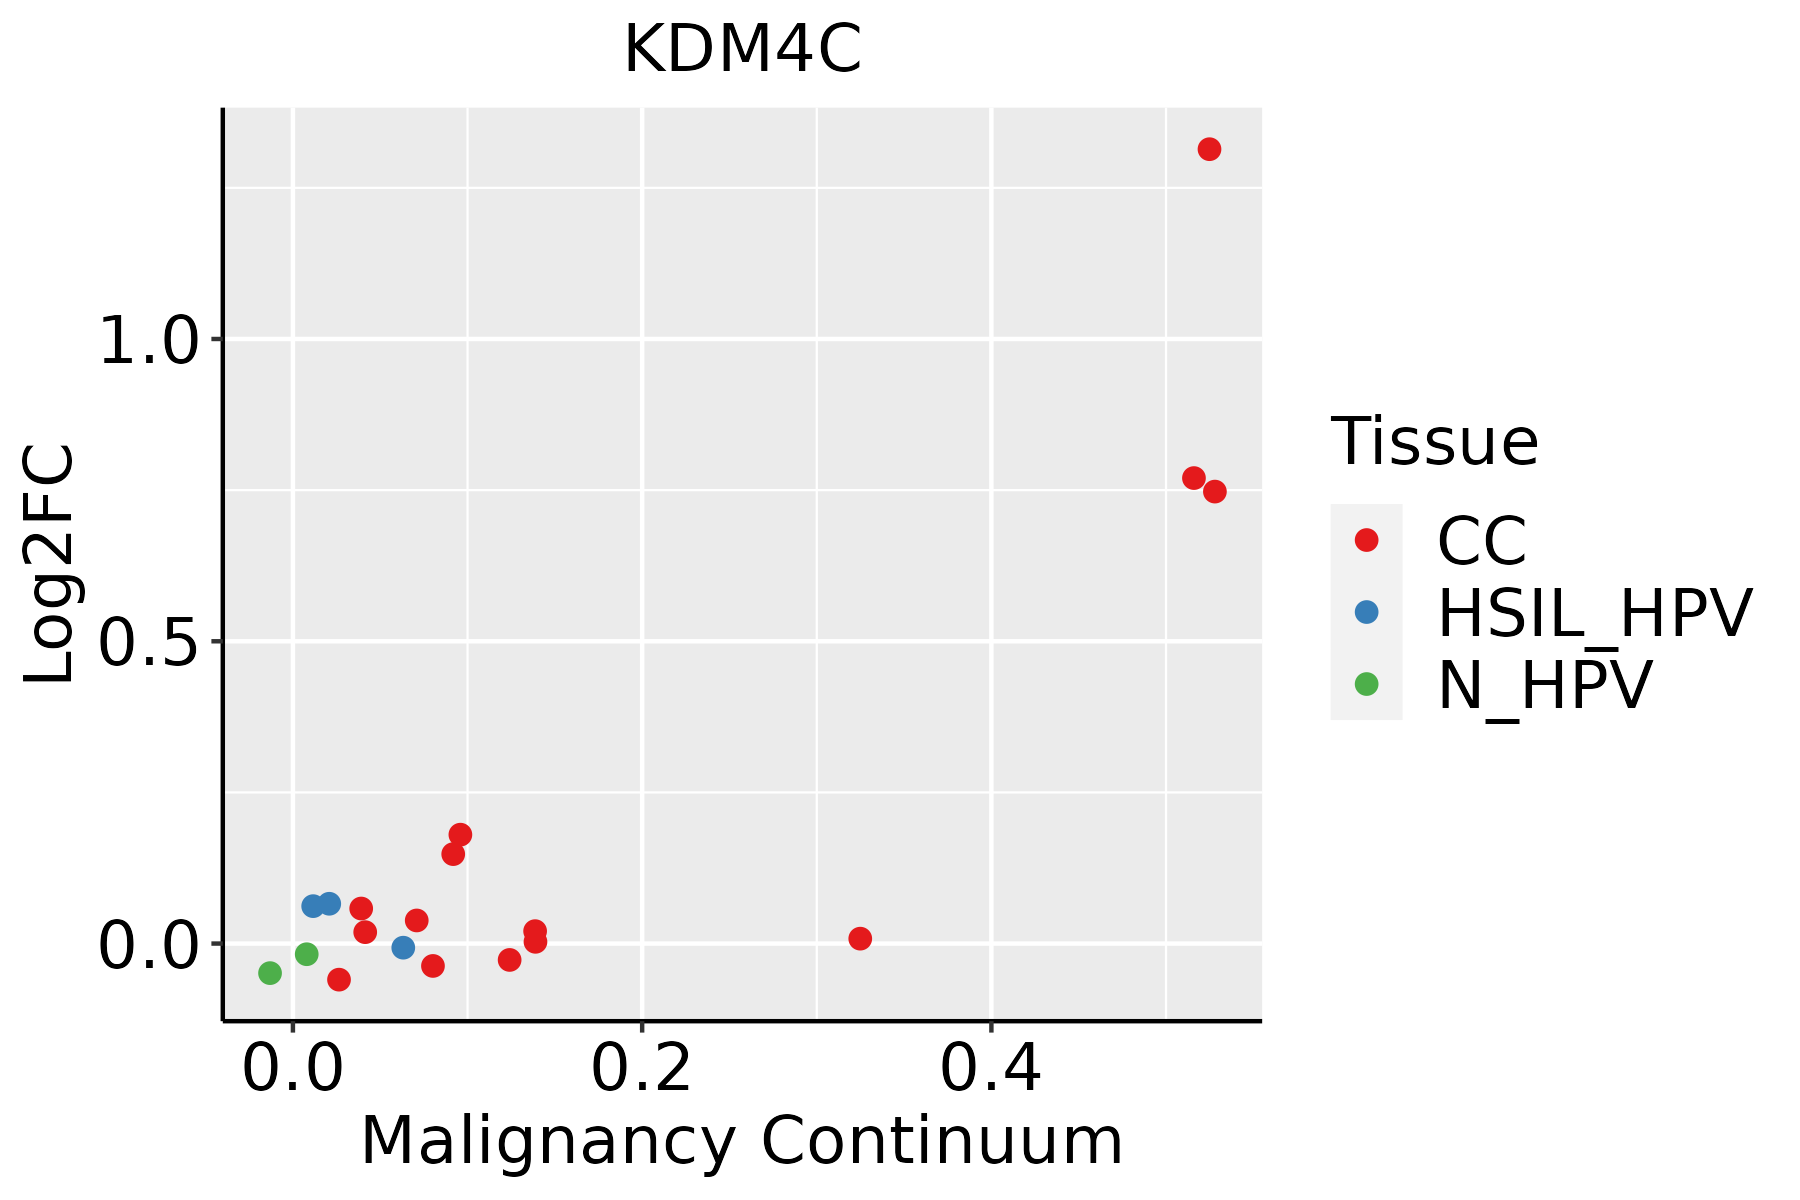 | CC: Cervix cancer |
| HSIL_HPV: HPV-infected high-grade squamous intraepithelial lesions |
| N_HPV: HPV-infected normal cervix |
| Colorectum (GSE201348) |  | FAP: Familial adenomatous polyposis |
| CRC: Colorectal cancer |
| Colorectum (HTA11) | 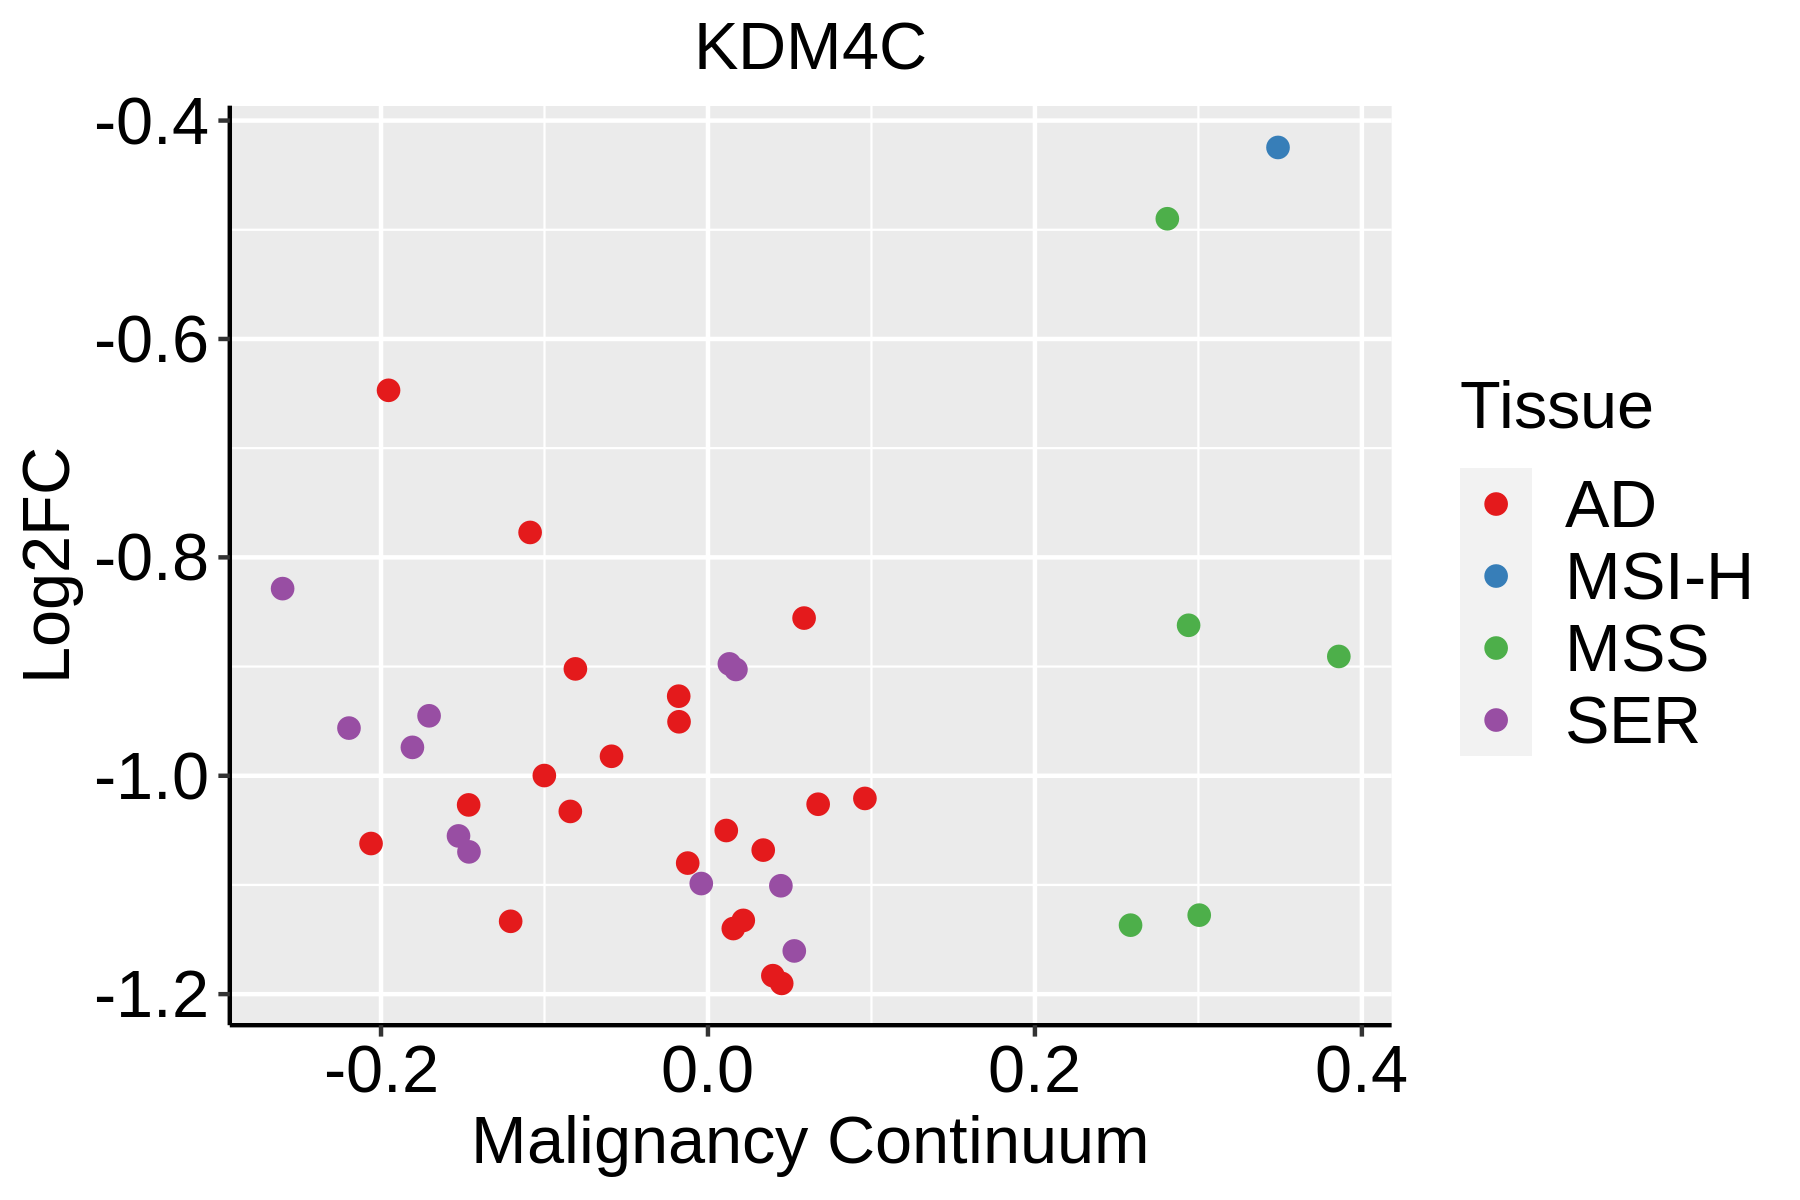 | AD: Adenomas |
| SER: Sessile serrated lesions |
| MSI-H: Microsatellite-high colorectal cancer |
| MSS: Microsatellite stable colorectal cancer |
| Endometrium | 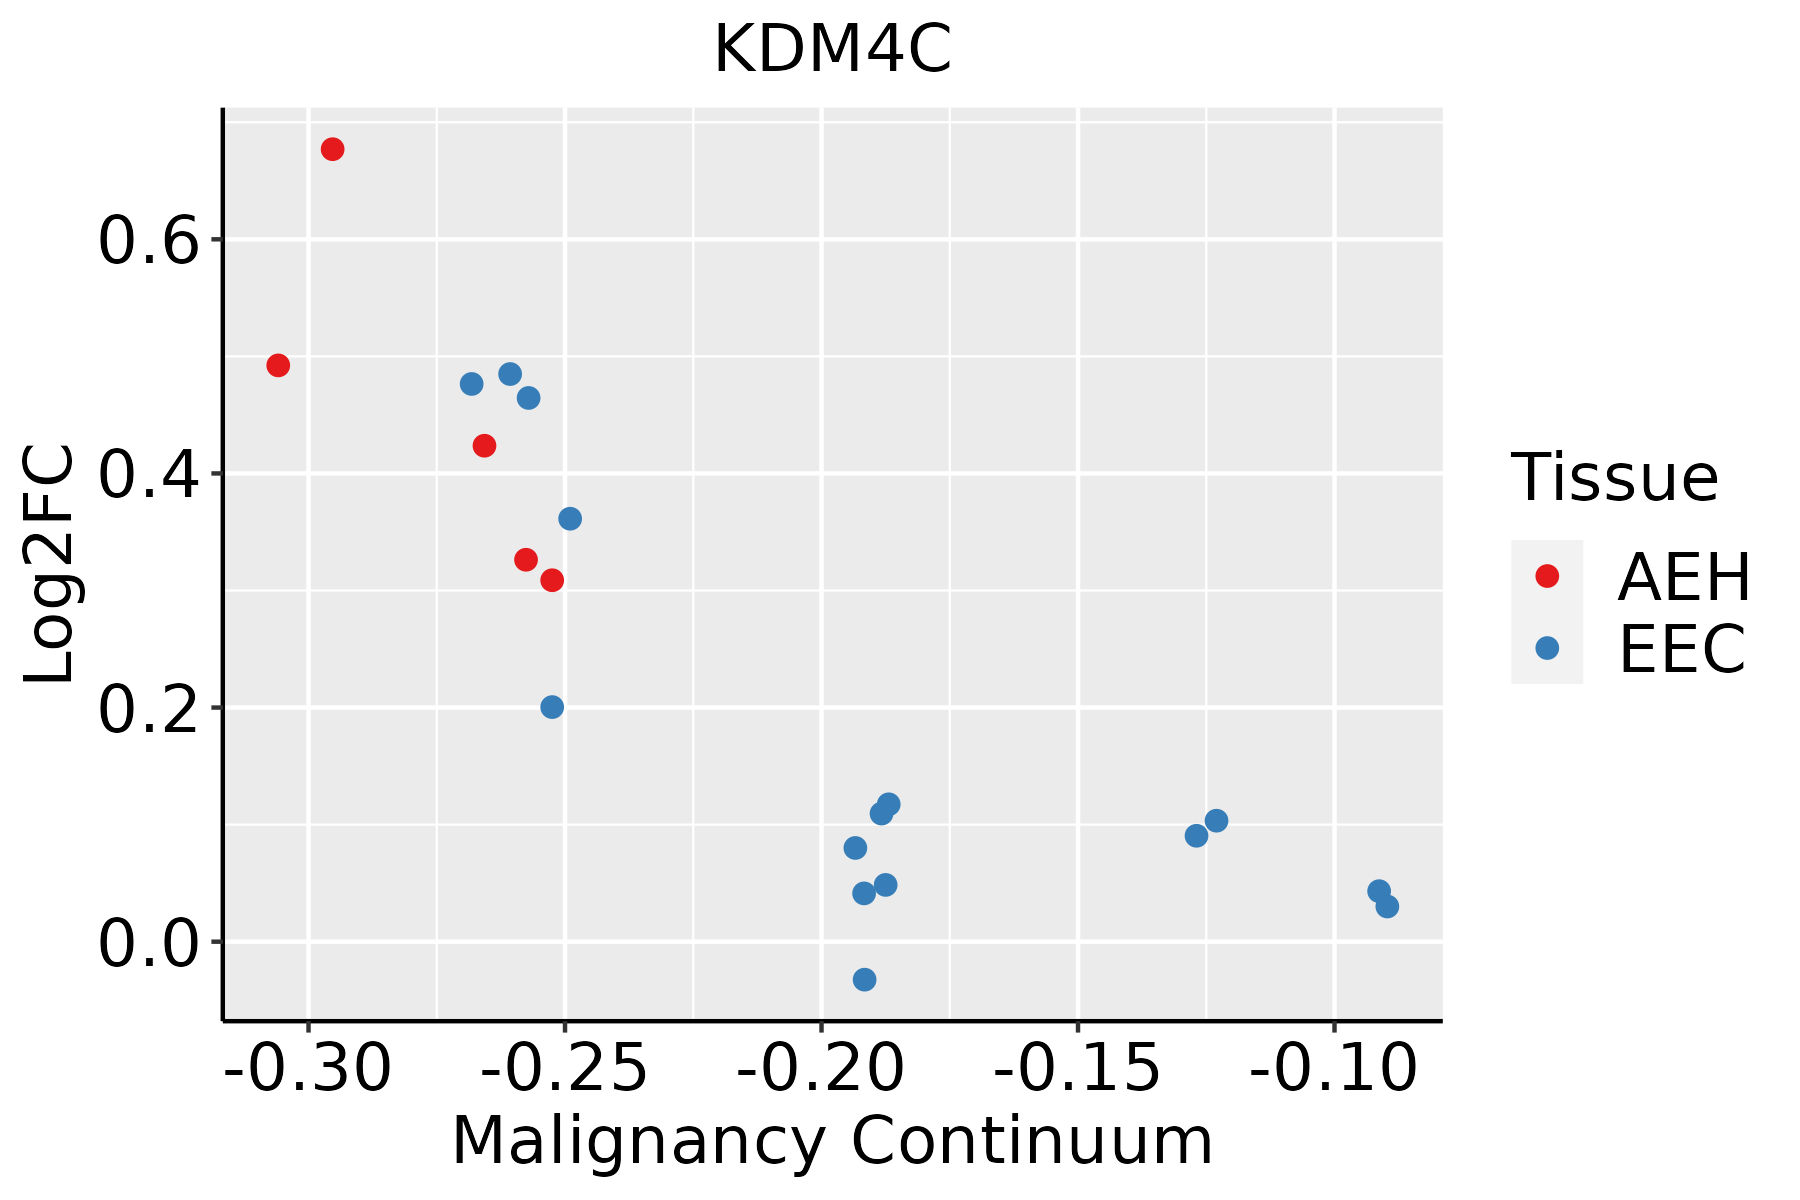 | AEH: Atypical endometrial hyperplasia |
| EEC: Endometrioid Cancer |
| Esophagus | 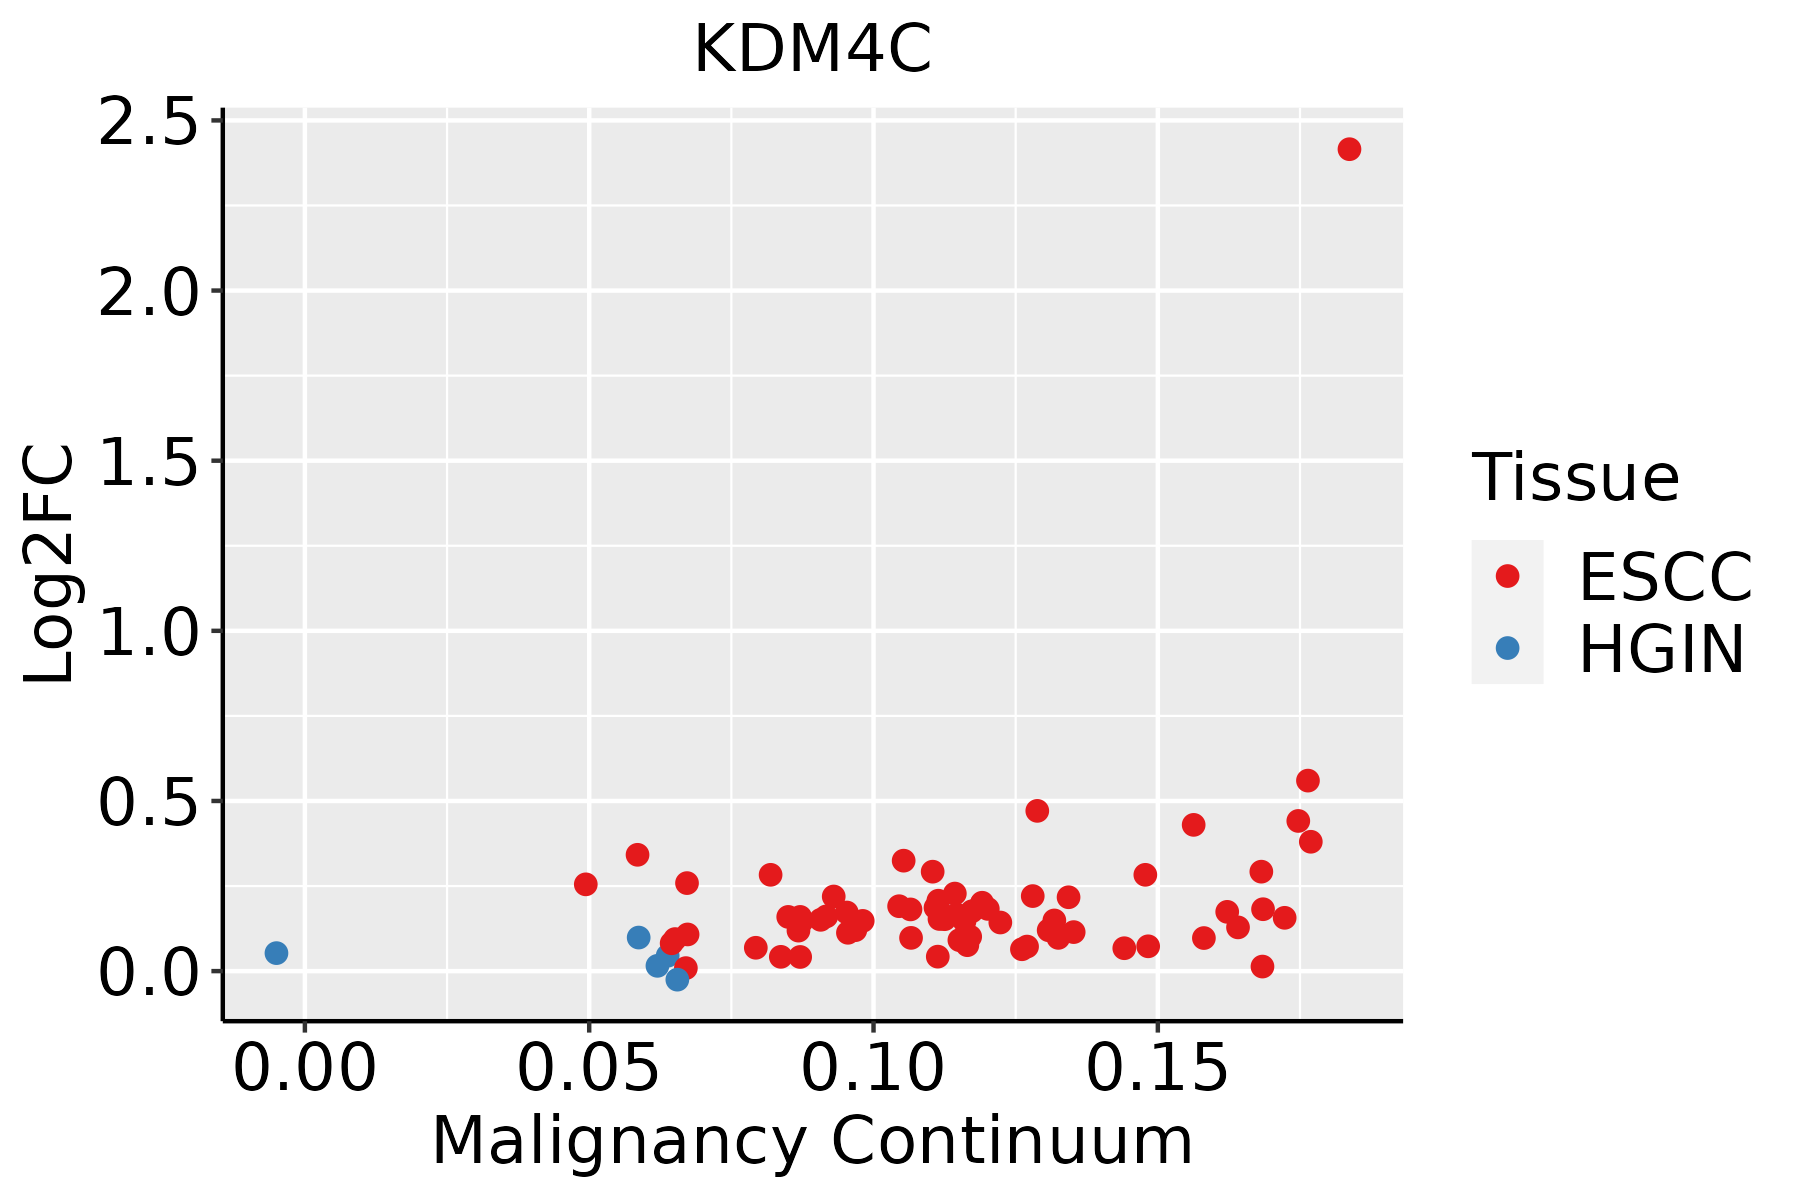 | ESCC: Esophageal squamous cell carcinoma |
| HGIN: High-grade intraepithelial neoplasias |
| LGIN: Low-grade intraepithelial neoplasias |
| Lung | 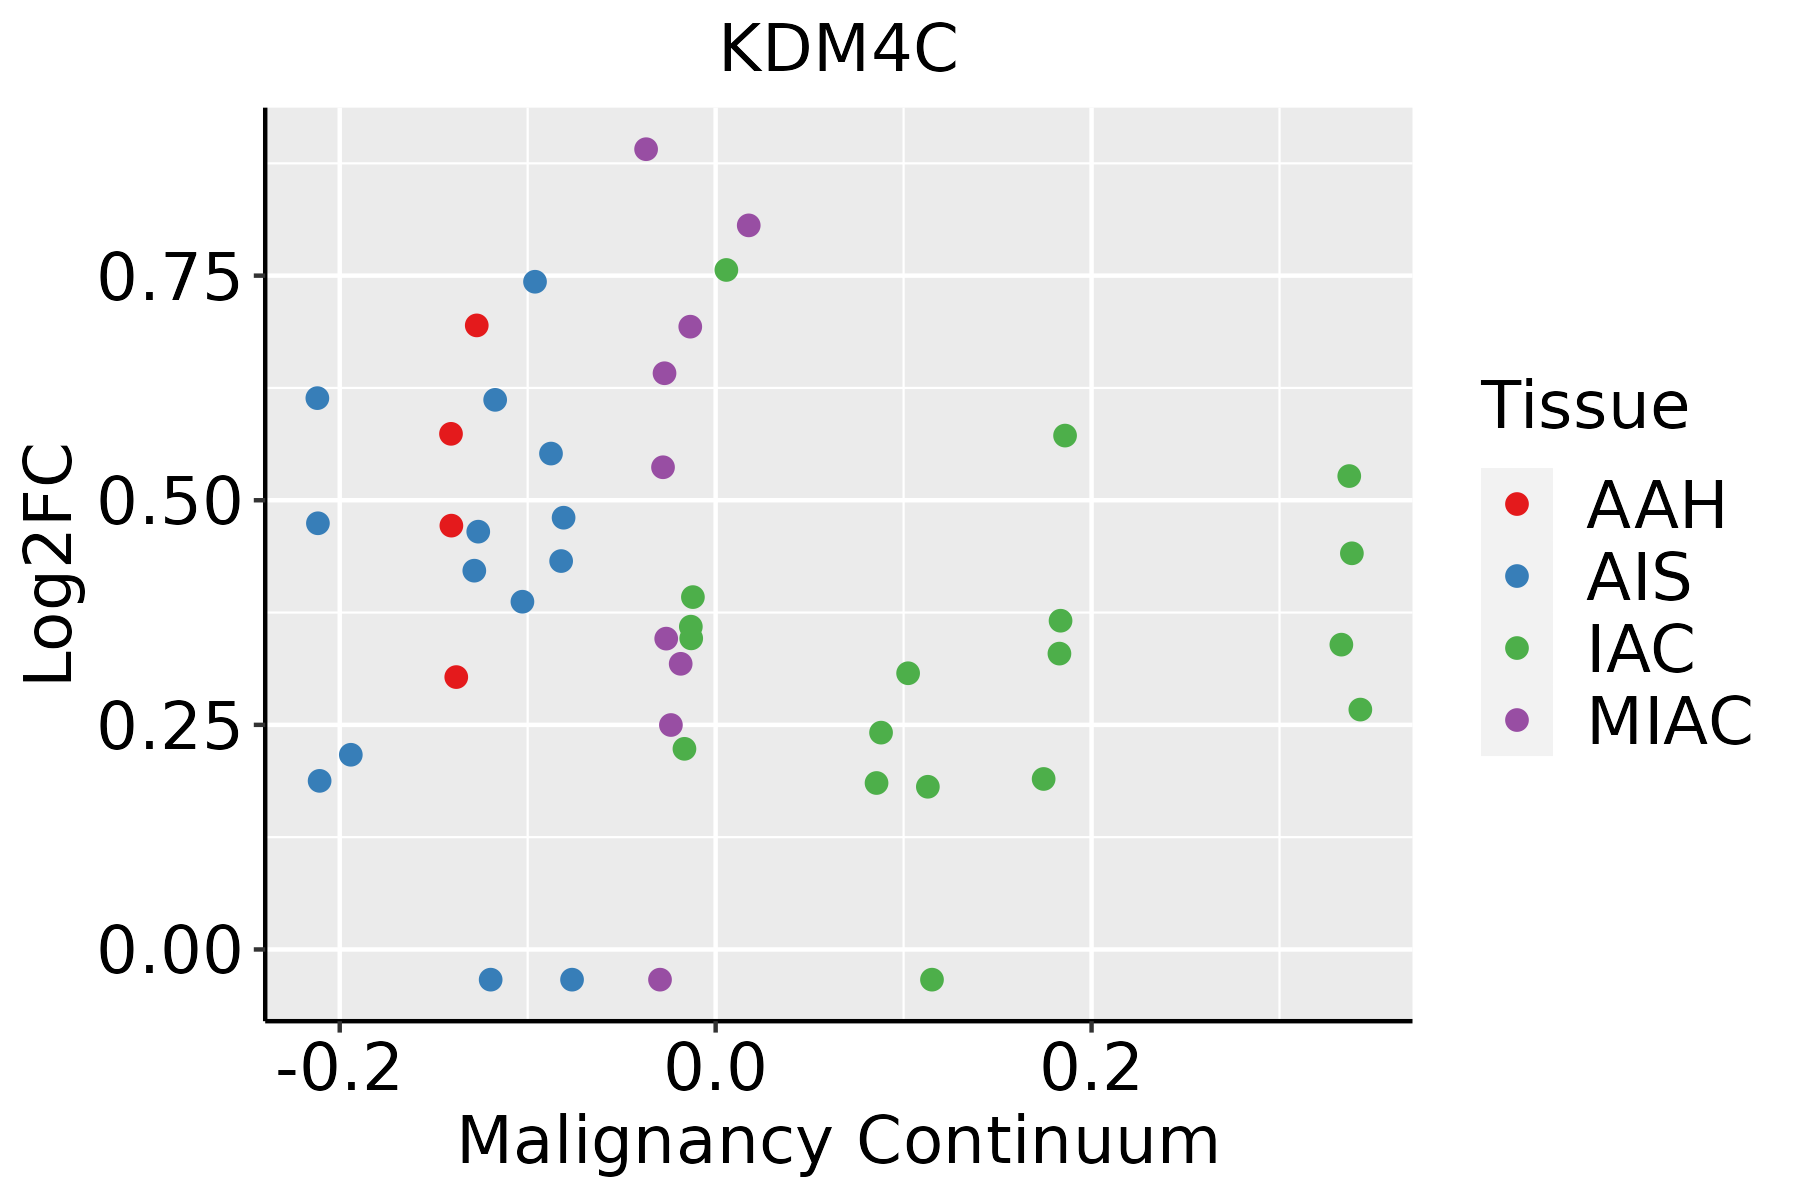 | AAH: Atypical adenomatous hyperplasia |
| AIS: Adenocarcinoma in situ |
| IAC: Invasive lung adenocarcinoma |
| MIA: Minimally invasive adenocarcinoma |
| Skin |  | AK: Actinic keratosis |
| cSCC: Cutaneous squamous cell carcinoma |
| SCCIS:squamous cell carcinoma in situ |
| GO ID | Tissue | Disease Stage | Description | Gene Ratio | Bg Ratio | pvalue | p.adjust | Count |
| GO:00305189 | Endometrium | AEH | intracellular steroid hormone receptor signaling pathway | 27/2100 | 116/18723 | 1.65e-04 | 2.15e-03 | 27 |
| GO:00434019 | Endometrium | AEH | steroid hormone mediated signaling pathway | 29/2100 | 136/18723 | 4.71e-04 | 4.91e-03 | 29 |
| GO:00097558 | Endometrium | AEH | hormone-mediated signaling pathway | 37/2100 | 190/18723 | 5.64e-04 | 5.62e-03 | 37 |
| GO:00305219 | Endometrium | AEH | androgen receptor signaling pathway | 12/2100 | 44/18723 | 2.62e-03 | 1.92e-02 | 12 |
| GO:00063258 | Endometrium | AEH | chromatin organization | 64/2100 | 409/18723 | 3.69e-03 | 2.52e-02 | 64 |
| GO:00331435 | Endometrium | AEH | regulation of intracellular steroid hormone receptor signaling pathway | 16/2100 | 74/18723 | 7.12e-03 | 4.09e-02 | 16 |
| GO:003052215 | Endometrium | EEC | intracellular receptor signaling pathway | 65/2168 | 265/18723 | 2.52e-09 | 1.96e-07 | 65 |
| GO:004854517 | Endometrium | EEC | response to steroid hormone | 77/2168 | 339/18723 | 3.80e-09 | 2.71e-07 | 77 |
| GO:007138315 | Endometrium | EEC | cellular response to steroid hormone stimulus | 45/2168 | 204/18723 | 1.40e-05 | 2.79e-04 | 45 |
| GO:003051814 | Endometrium | EEC | intracellular steroid hormone receptor signaling pathway | 28/2168 | 116/18723 | 1.11e-04 | 1.52e-03 | 28 |
| GO:004340114 | Endometrium | EEC | steroid hormone mediated signaling pathway | 30/2168 | 136/18723 | 3.55e-04 | 3.90e-03 | 30 |
| GO:000975513 | Endometrium | EEC | hormone-mediated signaling pathway | 38/2168 | 190/18723 | 5.18e-04 | 5.21e-03 | 38 |
| GO:003052114 | Endometrium | EEC | androgen receptor signaling pathway | 13/2168 | 44/18723 | 1.05e-03 | 9.17e-03 | 13 |
| GO:000632513 | Endometrium | EEC | chromatin organization | 65/2168 | 409/18723 | 4.98e-03 | 3.14e-02 | 65 |
| GO:001657015 | Esophagus | ESCC | histone modification | 323/8552 | 463/18723 | 2.61e-26 | 7.88e-24 | 323 |
| GO:0030522110 | Esophagus | ESCC | intracellular receptor signaling pathway | 170/8552 | 265/18723 | 8.58e-10 | 2.09e-08 | 170 |
| GO:0048545111 | Esophagus | ESCC | response to steroid hormone | 204/8552 | 339/18723 | 4.47e-08 | 8.11e-07 | 204 |
| GO:000632517 | Esophagus | ESCC | chromatin organization | 240/8552 | 409/18723 | 6.52e-08 | 1.14e-06 | 240 |
| GO:0071383110 | Esophagus | ESCC | cellular response to steroid hormone stimulus | 127/8552 | 204/18723 | 1.26e-06 | 1.55e-05 | 127 |
| GO:003051819 | Esophagus | ESCC | intracellular steroid hormone receptor signaling pathway | 76/8552 | 116/18723 | 1.25e-05 | 1.15e-04 | 76 |
| Hugo Symbol | Variant Class | Variant Classification | dbSNP RS | HGVSc | HGVSp | HGVSp Short | SWISSPROT | BIOTYPE | SIFT | PolyPhen | Tumor Sample Barcode | Tissue | Histology | Sex | Age | Stage | Therapy Types | Drugs | Outcome |
| KDM4C | SNV | Missense_Mutation | rs780836880 | c.362N>A | p.Arg121His | p.R121H | Q9H3R0 | protein_coding | deleterious(0) | probably_damaging(0.985) | TCGA-A8-A07P-01 | Breast | breast invasive carcinoma | Female | >=65 | I/II | Chemotherapy | 5-fluorouracil | SD |
| KDM4C | SNV | Missense_Mutation | rs182255463 | c.676N>G | p.Gln226Glu | p.Q226E | Q9H3R0 | protein_coding | tolerated(0.24) | benign(0.24) | TCGA-AC-A23H-01 | Breast | breast invasive carcinoma | Female | >=65 | I/II | Unknown | Unknown | PD |
| KDM4C | SNV | Missense_Mutation | rs191848178 | c.1888N>T | p.Ala630Ser | p.A630S | Q9H3R0 | protein_coding | deleterious(0.01) | probably_damaging(0.957) | TCGA-BH-A0BG-01 | Breast | breast invasive carcinoma | Female | >=65 | I/II | Unknown | Unknown | SD |
| KDM4C | SNV | Missense_Mutation | novel | c.1611N>A | p.Asn537Lys | p.N537K | Q9H3R0 | protein_coding | tolerated(0.2) | benign(0.014) | TCGA-BH-A6R8-01 | Breast | breast invasive carcinoma | Female | <65 | I/II | Unknown | Unknown | SD |
| KDM4C | SNV | Missense_Mutation | | c.1439N>A | p.Ile480Lys | p.I480K | Q9H3R0 | protein_coding | tolerated(0.95) | benign(0) | TCGA-D8-A1JK-01 | Breast | breast invasive carcinoma | Female | >=65 | I/II | Unknown | Unknown | SD |
| KDM4C | SNV | Missense_Mutation | | c.145N>C | p.Val49Leu | p.V49L | Q9H3R0 | protein_coding | deleterious(0) | benign(0.013) | TCGA-D8-A1X6-01 | Breast | breast invasive carcinoma | Female | >=65 | III/IV | Hormone Therapy | tamoxiphen | SD |
| KDM4C | SNV | Missense_Mutation | rs373633491 | c.1192N>A | p.Ala398Thr | p.A398T | Q9H3R0 | protein_coding | tolerated(0.34) | benign(0.001) | TCGA-D8-A1XK-01 | Breast | breast invasive carcinoma | Female | <65 | I/II | Chemotherapy | doxorubicine+cyclophosphamide | SD |
| KDM4C | SNV | Missense_Mutation | | c.1352C>T | p.Ser451Leu | p.S451L | Q9H3R0 | protein_coding | tolerated(0.13) | benign(0.001) | TCGA-GM-A2D9-01 | Breast | breast invasive carcinoma | Female | >=65 | I/II | Hormone Therapy | arimidex | SD |
| KDM4C | insertion | Frame_Shift_Ins | novel | c.1907_1908insCTGGTGCTCTGTAAGATTTTATAAAGTGCTGTTCTTGTGGAGT | p.Thr637TrpfsTer37 | p.T637Wfs*37 | Q9H3R0 | protein_coding | | | TCGA-AN-A04C-01 | Breast | breast invasive carcinoma | Female | <65 | I/II | Unknown | Unknown | SD |
| KDM4C | deletion | Frame_Shift_Del | | c.2601delN | p.Asn869ThrfsTer2 | p.N869Tfs*2 | Q9H3R0 | protein_coding | | | TCGA-D8-A1XK-01 | Breast | breast invasive carcinoma | Female | <65 | I/II | Chemotherapy | doxorubicine+cyclophosphamide | SD |
| Entrez ID | Symbol | Category | Interaction Types | Drug Claim Name | Drug Name | PMIDs |
| 23081 | KDM4C | CLINICALLY ACTIONABLE, ENZYME, DRUGGABLE GENOME | | PYROGALLOL RED | PYROGALLOL RED | |
| 23081 | KDM4C | CLINICALLY ACTIONABLE, ENZYME, DRUGGABLE GENOME | | Pyrido[1,2-a]indole-1.-carboxylic acid analog 2 | | |
| 23081 | KDM4C | CLINICALLY ACTIONABLE, ENZYME, DRUGGABLE GENOME | | Pyrido[1,2-a]indole-1.-carboxylic acid analog 4 | | |
| 23081 | KDM4C | CLINICALLY ACTIONABLE, ENZYME, DRUGGABLE GENOME | | PYRIDINE-2,4-DICARBOXYLIC ACID | CHEMBL316034 | |
| 23081 | KDM4C | CLINICALLY ACTIONABLE, ENZYME, DRUGGABLE GENOME | | SKF-38393 | SKF-38393 | |
| 23081 | KDM4C | CLINICALLY ACTIONABLE, ENZYME, DRUGGABLE GENOME | | Pyrido[1,2-a]indole-1.-carboxylic acid analog 7 | | |
| 23081 | KDM4C | CLINICALLY ACTIONABLE, ENZYME, DRUGGABLE GENOME | | TYRPHOSTIN 23 | TYRPHOSTIN 23 | |
| 23081 | KDM4C | CLINICALLY ACTIONABLE, ENZYME, DRUGGABLE GENOME | | PMID25468267-Compound-46 | | |
| 23081 | KDM4C | CLINICALLY ACTIONABLE, ENZYME, DRUGGABLE GENOME | | N-METHOXYCARBONYLMETHYL-OXALAMIC ACID METHYL ESTER | CHEMBL92309 | 19359167 |
| 23081 | KDM4C | CLINICALLY ACTIONABLE, ENZYME, DRUGGABLE GENOME | | Pyrido[1,2-a]indole-1.-carboxylic acid analog 1 | | |


