| Tissue | Expression Dynamics | Abbreviation |
| Cervix |  | CC: Cervix cancer |
| HSIL_HPV: HPV-infected high-grade squamous intraepithelial lesions |
| N_HPV: HPV-infected normal cervix |
| Colorectum (GSE201348) |  | FAP: Familial adenomatous polyposis |
| CRC: Colorectal cancer |
| Colorectum (HTA11) |  | AD: Adenomas |
| SER: Sessile serrated lesions |
| MSI-H: Microsatellite-high colorectal cancer |
| MSS: Microsatellite stable colorectal cancer |
| Esophagus |  | ESCC: Esophageal squamous cell carcinoma |
| HGIN: High-grade intraepithelial neoplasias |
| LGIN: Low-grade intraepithelial neoplasias |
| Thyroid | 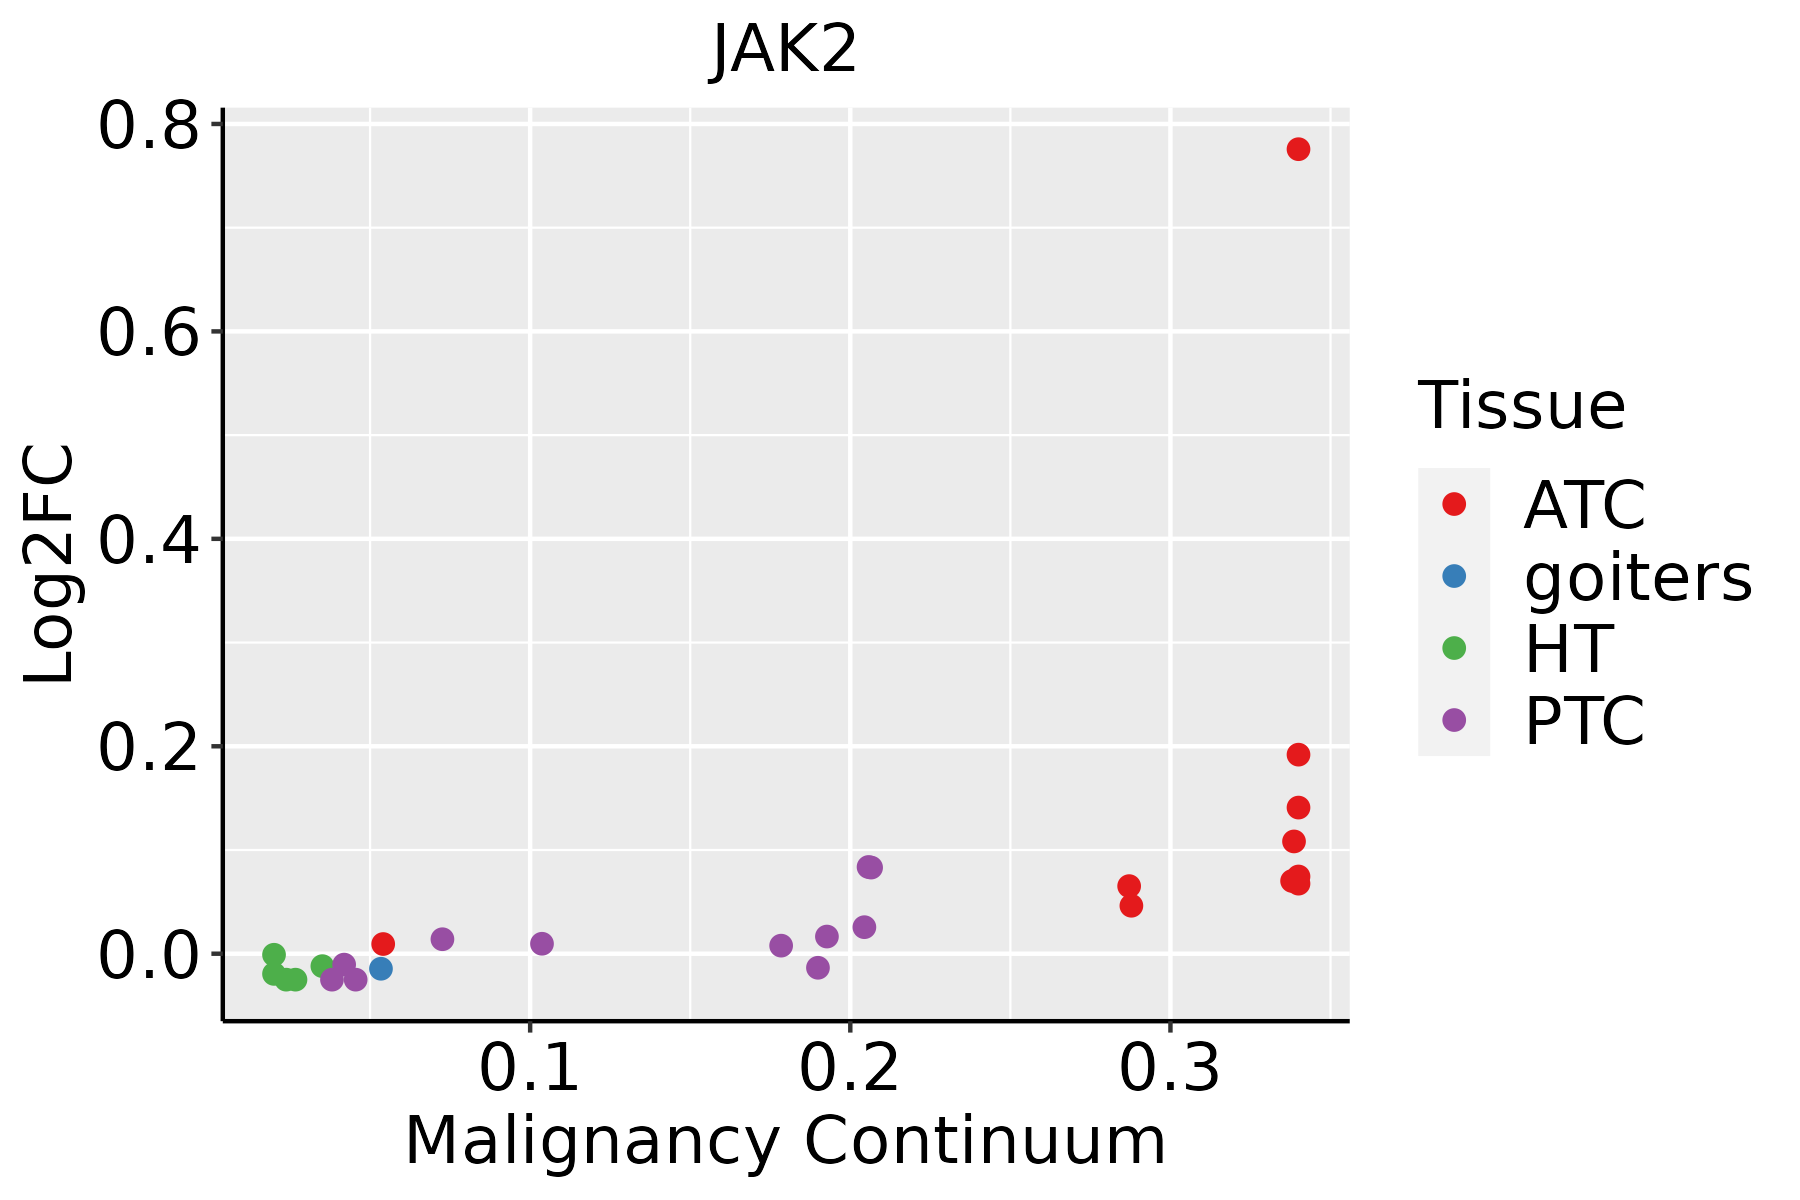 | ATC: Anaplastic thyroid cancer |
| HT: Hashimoto's thyroiditis |
| PTC: Papillary thyroid cancer |
| GO ID | Tissue | Disease Stage | Description | Gene Ratio | Bg Ratio | pvalue | p.adjust | Count |
| GO:00346129 | Cervix | CC | response to tumor necrosis factor | 55/2311 | 253/18723 | 1.75e-05 | 3.32e-04 | 55 |
| GO:00713569 | Cervix | CC | cellular response to tumor necrosis factor | 51/2311 | 229/18723 | 1.75e-05 | 3.32e-04 | 51 |
| GO:19016538 | Cervix | CC | cellular response to peptide | 72/2311 | 359/18723 | 1.89e-05 | 3.48e-04 | 72 |
| GO:004873210 | Cervix | CC | gland development | 84/2311 | 436/18723 | 1.93e-05 | 3.54e-04 | 84 |
| GO:003410910 | Cervix | CC | homotypic cell-cell adhesion | 26/2311 | 90/18723 | 2.12e-05 | 3.82e-04 | 26 |
| GO:00323889 | Cervix | CC | positive regulation of intracellular transport | 46/2311 | 202/18723 | 2.45e-05 | 4.24e-04 | 46 |
| GO:005110110 | Cervix | CC | regulation of DNA binding | 31/2311 | 118/18723 | 2.91e-05 | 4.81e-04 | 31 |
| GO:00507273 | Cervix | CC | regulation of inflammatory response | 75/2311 | 386/18723 | 3.95e-05 | 6.18e-04 | 75 |
| GO:00511707 | Cervix | CC | import into nucleus | 38/2311 | 159/18723 | 3.98e-05 | 6.18e-04 | 38 |
| GO:00066067 | Cervix | CC | protein import into nucleus | 37/2311 | 155/18723 | 5.13e-05 | 7.71e-04 | 37 |
| GO:007099710 | Cervix | CC | neuron death | 70/2311 | 361/18723 | 7.50e-05 | 1.03e-03 | 70 |
| GO:00507294 | Cervix | CC | positive regulation of inflammatory response | 34/2311 | 142/18723 | 9.51e-05 | 1.25e-03 | 34 |
| GO:00468248 | Cervix | CC | positive regulation of nucleocytoplasmic transport | 19/2311 | 62/18723 | 1.11e-04 | 1.40e-03 | 19 |
| GO:00434349 | Cervix | CC | response to peptide hormone | 77/2311 | 414/18723 | 1.40e-04 | 1.70e-03 | 77 |
| GO:00436668 | Cervix | CC | regulation of phosphoprotein phosphatase activity | 18/2311 | 58/18723 | 1.40e-04 | 1.70e-03 | 18 |
| GO:003530310 | Cervix | CC | regulation of dephosphorylation | 31/2311 | 128/18723 | 1.52e-04 | 1.83e-03 | 31 |
| GO:00165705 | Cervix | CC | histone modification | 84/2311 | 463/18723 | 1.70e-04 | 2.01e-03 | 84 |
| GO:003530410 | Cervix | CC | regulation of protein dephosphorylation | 24/2311 | 90/18723 | 1.73e-04 | 2.04e-03 | 24 |
| GO:00713757 | Cervix | CC | cellular response to peptide hormone stimulus | 57/2311 | 290/18723 | 2.32e-04 | 2.59e-03 | 57 |
| GO:00071786 | Cervix | CC | transmembrane receptor protein serine/threonine kinase signaling pathway | 67/2311 | 355/18723 | 2.39e-04 | 2.67e-03 | 67 |
| Pathway ID | Tissue | Disease Stage | Description | Gene Ratio | Bg Ratio | pvalue | p.adjust | qvalue | Count |
| hsa0541720 | Cervix | CC | Lipid and atherosclerosis | 65/1267 | 215/8465 | 6.47e-09 | 1.10e-07 | 6.52e-08 | 65 |
| hsa0516720 | Cervix | CC | Kaposi sarcoma-associated herpesvirus infection | 60/1267 | 194/8465 | 9.74e-09 | 1.58e-07 | 9.33e-08 | 60 |
| hsa0514514 | Cervix | CC | Toxoplasmosis | 34/1267 | 112/8465 | 2.42e-05 | 1.82e-04 | 1.08e-04 | 34 |
| hsa0516414 | Cervix | CC | Influenza A | 43/1267 | 171/8465 | 3.03e-04 | 1.64e-03 | 9.68e-04 | 43 |
| hsa05152 | Cervix | CC | Tuberculosis | 42/1267 | 180/8465 | 1.78e-03 | 7.21e-03 | 4.26e-03 | 42 |
| hsa046596 | Cervix | CC | Th17 cell differentiation | 28/1267 | 108/8465 | 1.99e-03 | 7.98e-03 | 4.72e-03 | 28 |
| hsa04062 | Cervix | CC | Chemokine signaling pathway | 43/1267 | 192/8465 | 3.60e-03 | 1.34e-02 | 7.91e-03 | 43 |
| hsa0514014 | Cervix | CC | Leishmaniasis | 21/1267 | 77/8465 | 3.65e-03 | 1.34e-02 | 7.91e-03 | 21 |
| hsa04658 | Cervix | CC | Th1 and Th2 cell differentiation | 24/1267 | 92/8465 | 3.71e-03 | 1.34e-02 | 7.91e-03 | 24 |
| hsa049336 | Cervix | CC | AGE-RAGE signaling pathway in diabetic complications | 25/1267 | 100/8465 | 5.64e-03 | 1.88e-02 | 1.11e-02 | 25 |
| hsa049172 | Cervix | CC | Prolactin signaling pathway | 18/1267 | 70/8465 | 1.29e-02 | 3.87e-02 | 2.29e-02 | 18 |
| hsa05417110 | Cervix | CC | Lipid and atherosclerosis | 65/1267 | 215/8465 | 6.47e-09 | 1.10e-07 | 6.52e-08 | 65 |
| hsa05167110 | Cervix | CC | Kaposi sarcoma-associated herpesvirus infection | 60/1267 | 194/8465 | 9.74e-09 | 1.58e-07 | 9.33e-08 | 60 |
| hsa0514515 | Cervix | CC | Toxoplasmosis | 34/1267 | 112/8465 | 2.42e-05 | 1.82e-04 | 1.08e-04 | 34 |
| hsa0516415 | Cervix | CC | Influenza A | 43/1267 | 171/8465 | 3.03e-04 | 1.64e-03 | 9.68e-04 | 43 |
| hsa051521 | Cervix | CC | Tuberculosis | 42/1267 | 180/8465 | 1.78e-03 | 7.21e-03 | 4.26e-03 | 42 |
| hsa0465911 | Cervix | CC | Th17 cell differentiation | 28/1267 | 108/8465 | 1.99e-03 | 7.98e-03 | 4.72e-03 | 28 |
| hsa040621 | Cervix | CC | Chemokine signaling pathway | 43/1267 | 192/8465 | 3.60e-03 | 1.34e-02 | 7.91e-03 | 43 |
| hsa0514015 | Cervix | CC | Leishmaniasis | 21/1267 | 77/8465 | 3.65e-03 | 1.34e-02 | 7.91e-03 | 21 |
| hsa046581 | Cervix | CC | Th1 and Th2 cell differentiation | 24/1267 | 92/8465 | 3.71e-03 | 1.34e-02 | 7.91e-03 | 24 |
| Hugo Symbol | Variant Class | Variant Classification | dbSNP RS | HGVSc | HGVSp | HGVSp Short | SWISSPROT | BIOTYPE | SIFT | PolyPhen | Tumor Sample Barcode | Tissue | Histology | Sex | Age | Stage | Therapy Types | Drugs | Outcome |
| JAK2 | SNV | Missense_Mutation | | c.398N>C | p.Arg133Pro | p.R133P | O60674 | protein_coding | deleterious(0) | probably_damaging(0.999) | TCGA-5L-AAT1-01 | Breast | breast invasive carcinoma | Female | <65 | III/IV | Hormone Therapy | letrozol | SD |
| JAK2 | SNV | Missense_Mutation | | c.164T>C | p.Leu55Pro | p.L55P | O60674 | protein_coding | deleterious(0) | probably_damaging(0.936) | TCGA-A8-A07R-01 | Breast | breast invasive carcinoma | Female | >=65 | III/IV | Ancillary | zoledronic | SD |
| JAK2 | SNV | Missense_Mutation | | c.344G>T | p.Arg115Ile | p.R115I | O60674 | protein_coding | deleterious(0) | possibly_damaging(0.883) | TCGA-BH-A0AW-01 | Breast | breast invasive carcinoma | Female | <65 | I/II | Chemotherapy | carboplatin | SD |
| JAK2 | SNV | Missense_Mutation | rs777208458 | c.413G>C | p.Arg138Pro | p.R138P | O60674 | protein_coding | deleterious(0) | possibly_damaging(0.615) | TCGA-C8-A26Y-01 | Breast | breast invasive carcinoma | Female | >=65 | I/II | Unknown | Unknown | SD |
| JAK2 | SNV | Missense_Mutation | | c.224N>T | p.Cys75Phe | p.C75F | O60674 | protein_coding | deleterious(0) | possibly_damaging(0.691) | TCGA-D8-A1JA-01 | Breast | breast invasive carcinoma | Female | <65 | III/IV | Chemotherapy | adriamycin | PD |
| JAK2 | insertion | Frame_Shift_Ins | novel | c.2221_2222insC | p.Thr742HisfsTer11 | p.T742Hfs*11 | O60674 | protein_coding | | | TCGA-D8-A27G-01 | Breast | breast invasive carcinoma | Female | >=65 | I/II | Unknown | Unknown | SD |
| JAK2 | deletion | Frame_Shift_Del | novel | c.352delN | p.Tyr119ThrfsTer48 | p.Y119Tfs*48 | O60674 | protein_coding | | | TCGA-D8-A27V-01 | Breast | breast invasive carcinoma | Female | <65 | I/II | Hormone Therapy | tamoxiphen | SD |
| JAK2 | SNV | Missense_Mutation | novel | c.3296N>G | p.Tyr1099Cys | p.Y1099C | O60674 | protein_coding | deleterious(0.03) | possibly_damaging(0.893) | TCGA-4J-AA1J-01 | Cervix | cervical & endocervical cancer | Female | <65 | I/II | Unknown | Unknown | SD |
| JAK2 | SNV | Missense_Mutation | | c.2173G>A | p.Glu725Lys | p.E725K | O60674 | protein_coding | tolerated(0.44) | benign(0.006) | TCGA-C5-A1MN-01 | Cervix | cervical & endocervical cancer | Female | <65 | III/IV | Chemotherapy | cisplatin | SD |
| JAK2 | SNV | Missense_Mutation | | c.2653C>A | p.Gln885Lys | p.Q885K | O60674 | protein_coding | tolerated(0.35) | possibly_damaging(0.614) | TCGA-DR-A0ZM-01 | Cervix | cervical & endocervical cancer | Female | <65 | III/IV | Unspecific | Cisplatin | SD |
| Entrez ID | Symbol | Category | Interaction Types | Drug Claim Name | Drug Name | PMIDs |
| 3717 | JAK2 | CLINICALLY ACTIONABLE, KINASE, TYROSINE KINASE, DRUGGABLE GENOME, DRUG RESISTANCE, ENZYME | inhibitor | RUXOLITINIB | RUXOLITINIB | |
| 3717 | JAK2 | CLINICALLY ACTIONABLE, KINASE, TYROSINE KINASE, DRUGGABLE GENOME, DRUG RESISTANCE, ENZYME | | Pembrolizumab | PEMBROLIZUMAB | 27433843 |
| 3717 | JAK2 | CLINICALLY ACTIONABLE, KINASE, TYROSINE KINASE, DRUGGABLE GENOME, DRUG RESISTANCE, ENZYME | | A-1155463 | | 25787766 |
| 3717 | JAK2 | CLINICALLY ACTIONABLE, KINASE, TYROSINE KINASE, DRUGGABLE GENOME, DRUG RESISTANCE, ENZYME | | BMS-911543 | BMS-911543 | |
| 3717 | JAK2 | CLINICALLY ACTIONABLE, KINASE, TYROSINE KINASE, DRUGGABLE GENOME, DRUG RESISTANCE, ENZYME | | TGX-221 | | 24251790 |
| 3717 | JAK2 | CLINICALLY ACTIONABLE, KINASE, TYROSINE KINASE, DRUGGABLE GENOME, DRUG RESISTANCE, ENZYME | | Tricyclic compound 11 | | |
| 3717 | JAK2 | CLINICALLY ACTIONABLE, KINASE, TYROSINE KINASE, DRUGGABLE GENOME, DRUG RESISTANCE, ENZYME | inhibitor | CHEMBL1944698 | ZOTIRACICLIB | |
| 3717 | JAK2 | CLINICALLY ACTIONABLE, KINASE, TYROSINE KINASE, DRUGGABLE GENOME, DRUG RESISTANCE, ENZYME | | SB-1578 | CT-1578 | |
| 3717 | JAK2 | CLINICALLY ACTIONABLE, KINASE, TYROSINE KINASE, DRUGGABLE GENOME, DRUG RESISTANCE, ENZYME | inhibitor | 381118857 | | |
| 3717 | JAK2 | CLINICALLY ACTIONABLE, KINASE, TYROSINE KINASE, DRUGGABLE GENOME, DRUG RESISTANCE, ENZYME | | WHI-P154 | CHEMBL473773 | |


