| Tissue | Expression Dynamics | Abbreviation |
| Colorectum (GSE201348) |  | FAP: Familial adenomatous polyposis |
| CRC: Colorectal cancer |
| Colorectum (HTA11) |  | AD: Adenomas |
| SER: Sessile serrated lesions |
| MSI-H: Microsatellite-high colorectal cancer |
| MSS: Microsatellite stable colorectal cancer |
| Esophagus |  | ESCC: Esophageal squamous cell carcinoma |
| HGIN: High-grade intraepithelial neoplasias |
| LGIN: Low-grade intraepithelial neoplasias |
| Liver | 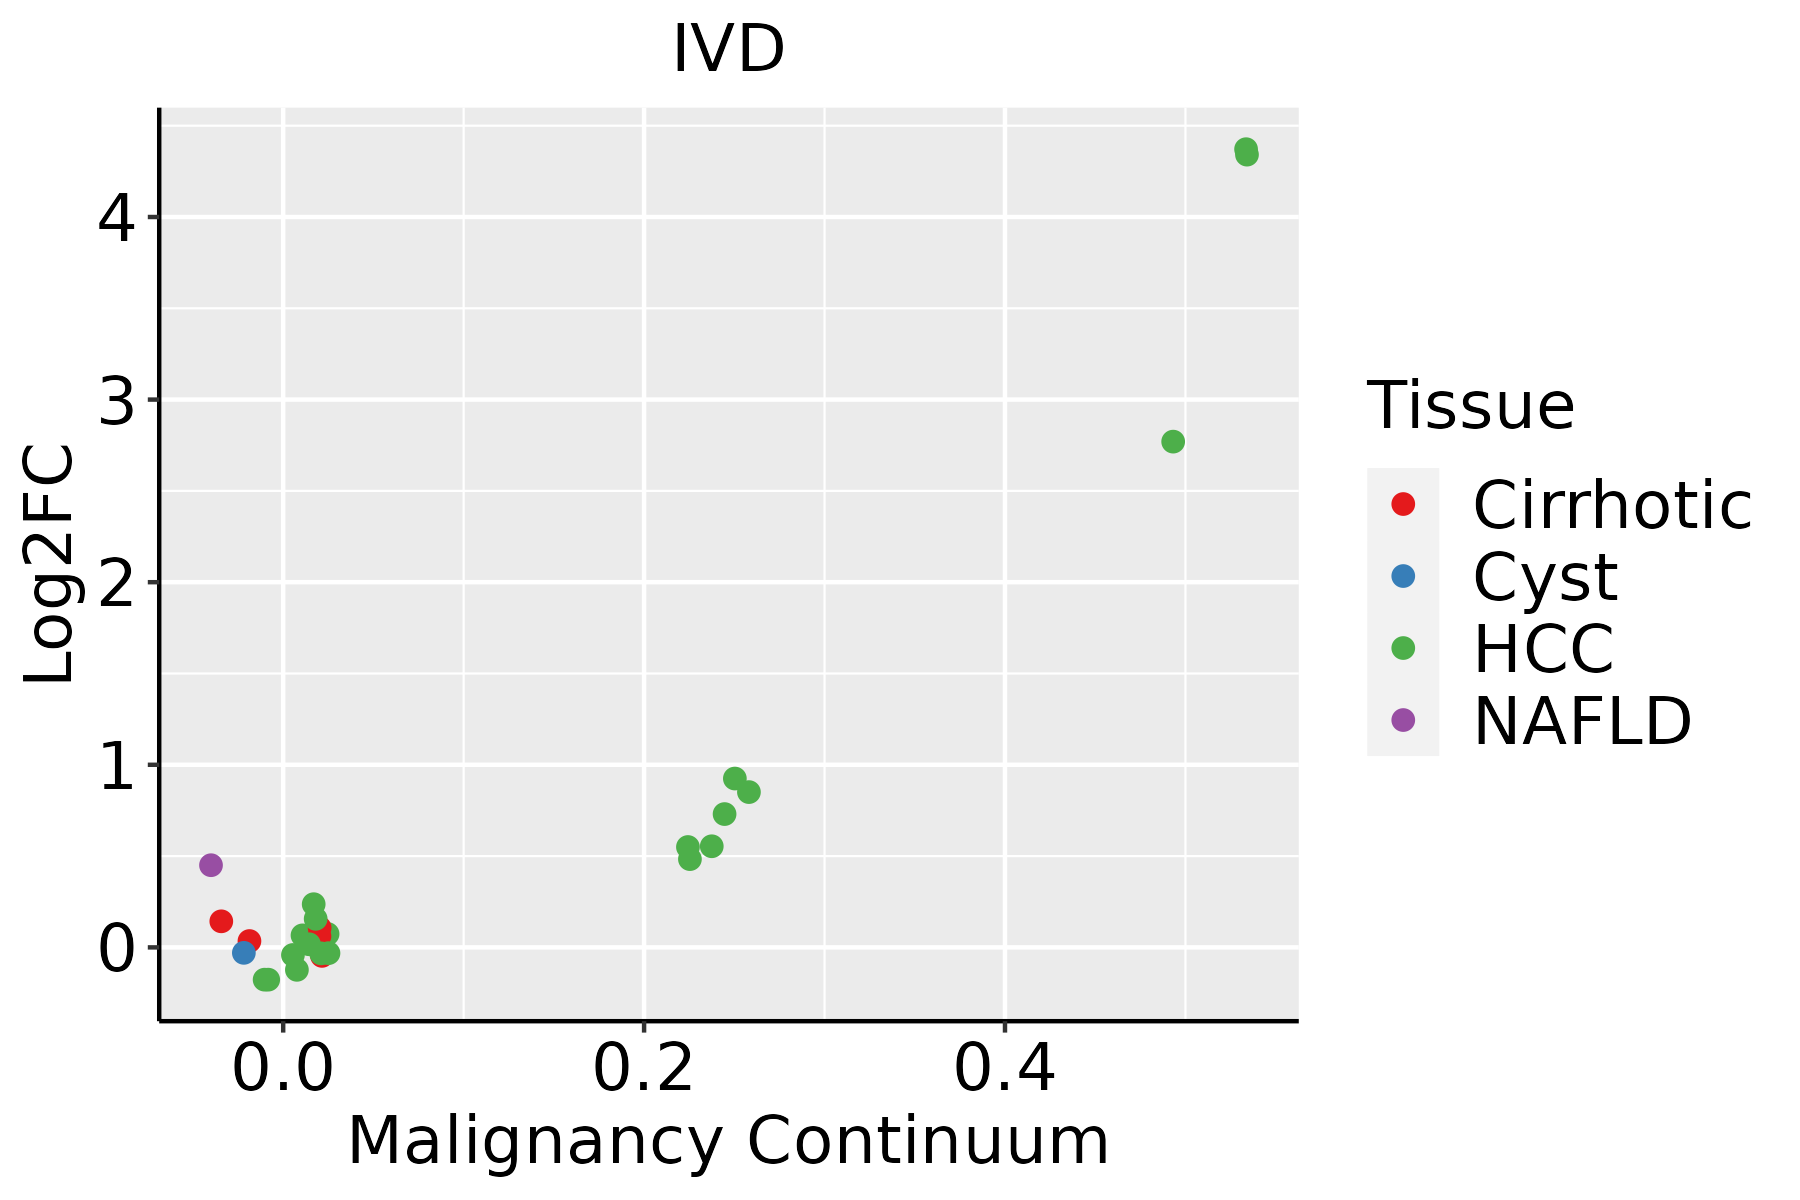 | HCC: Hepatocellular carcinoma |
| NAFLD: Non-alcoholic fatty liver disease |
| Oral Cavity | 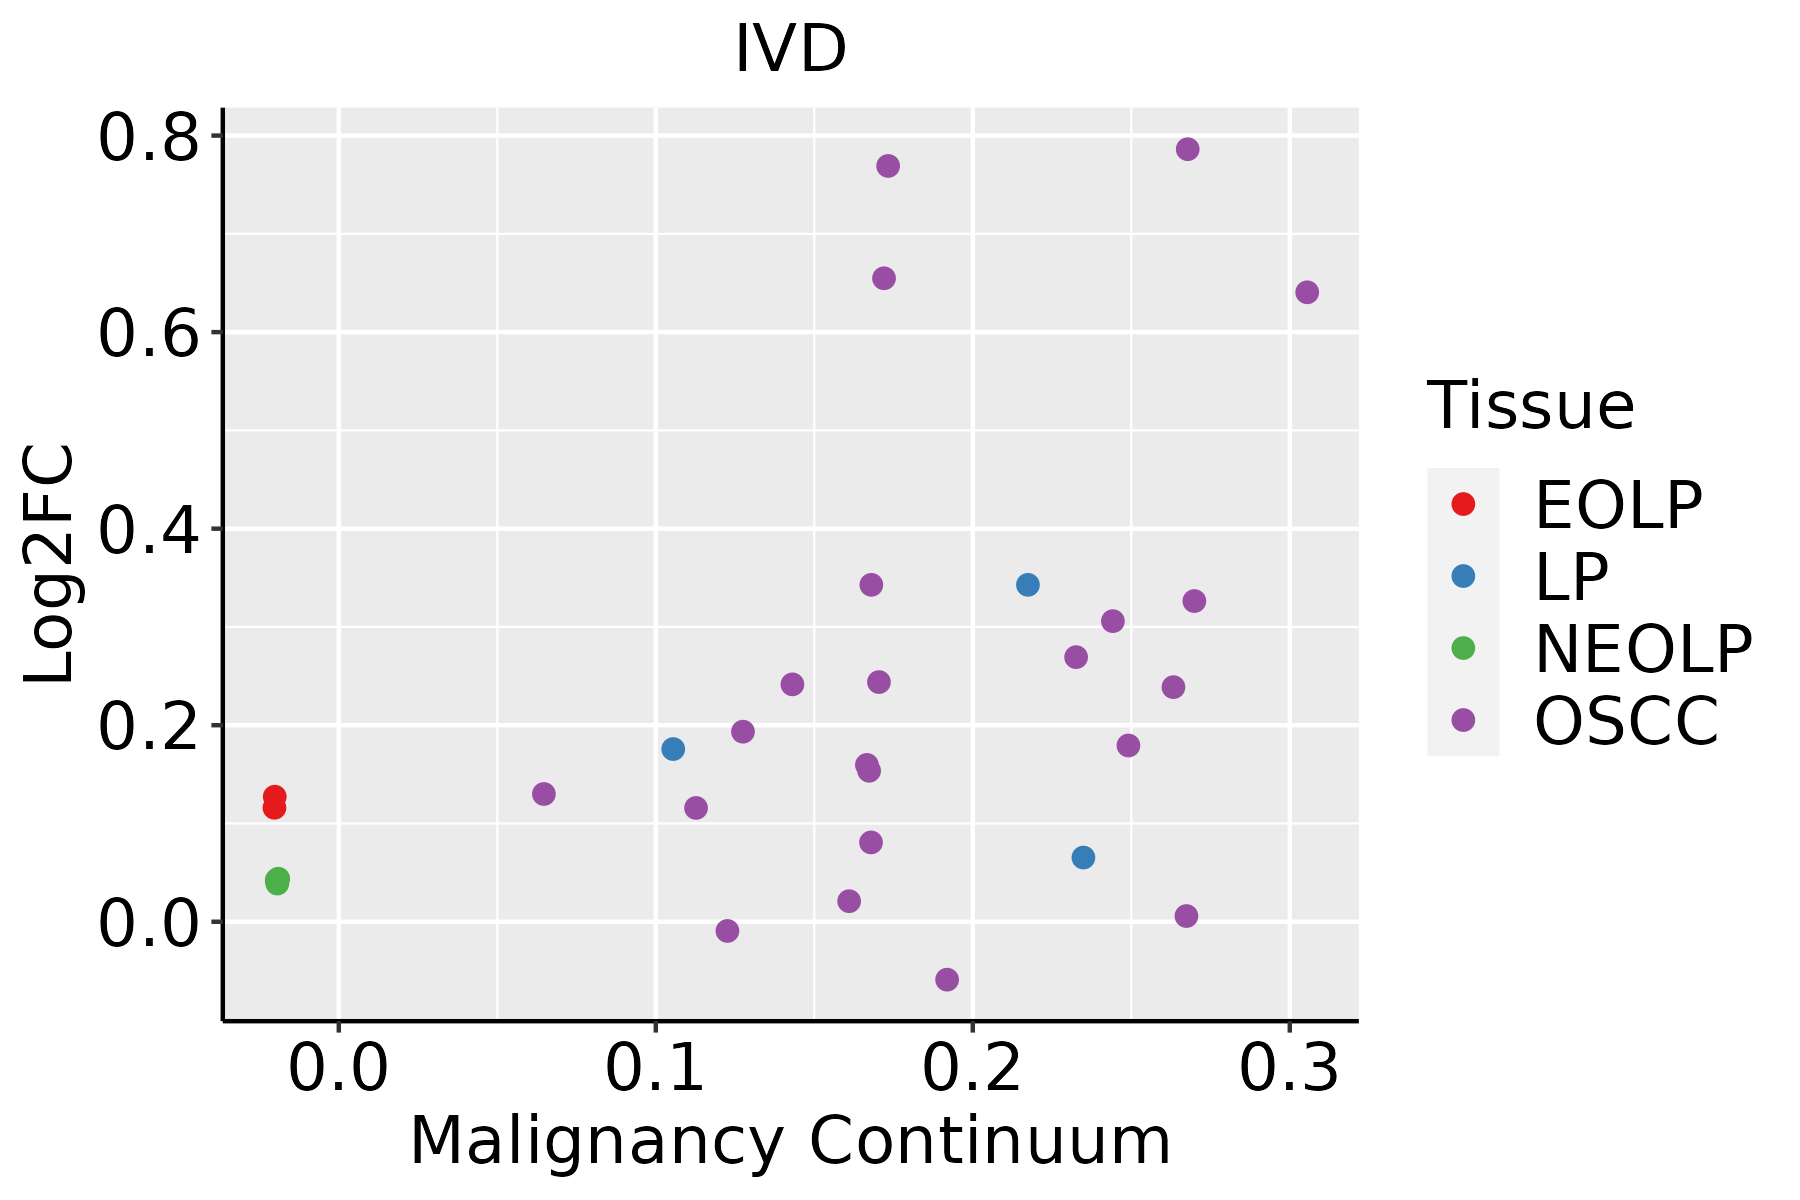 | EOLP: Erosive Oral lichen planus |
| LP: leukoplakia |
| NEOLP: Non-erosive oral lichen planus |
| OSCC: Oral squamous cell carcinoma |
| Prostate | 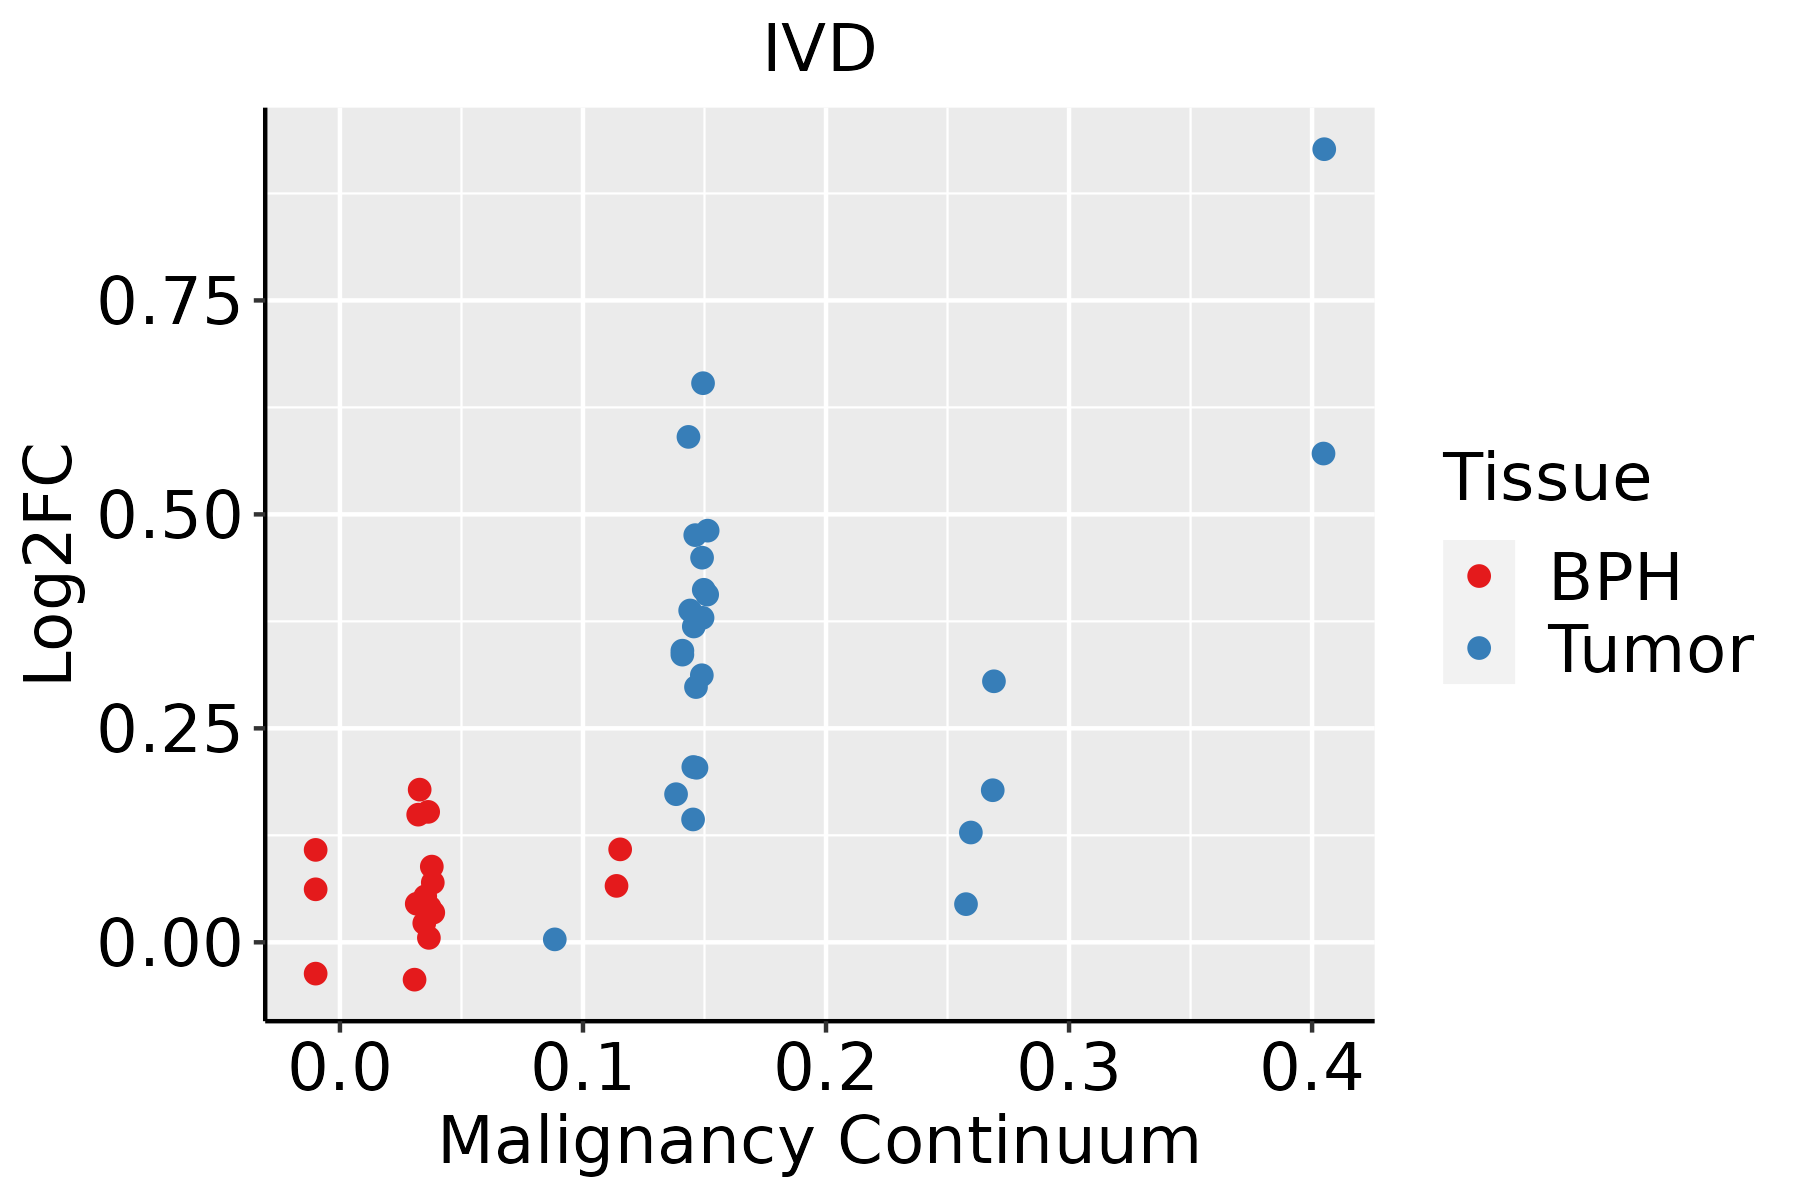 | BPH: Benign Prostatic Hyperplasia |
| Thyroid | 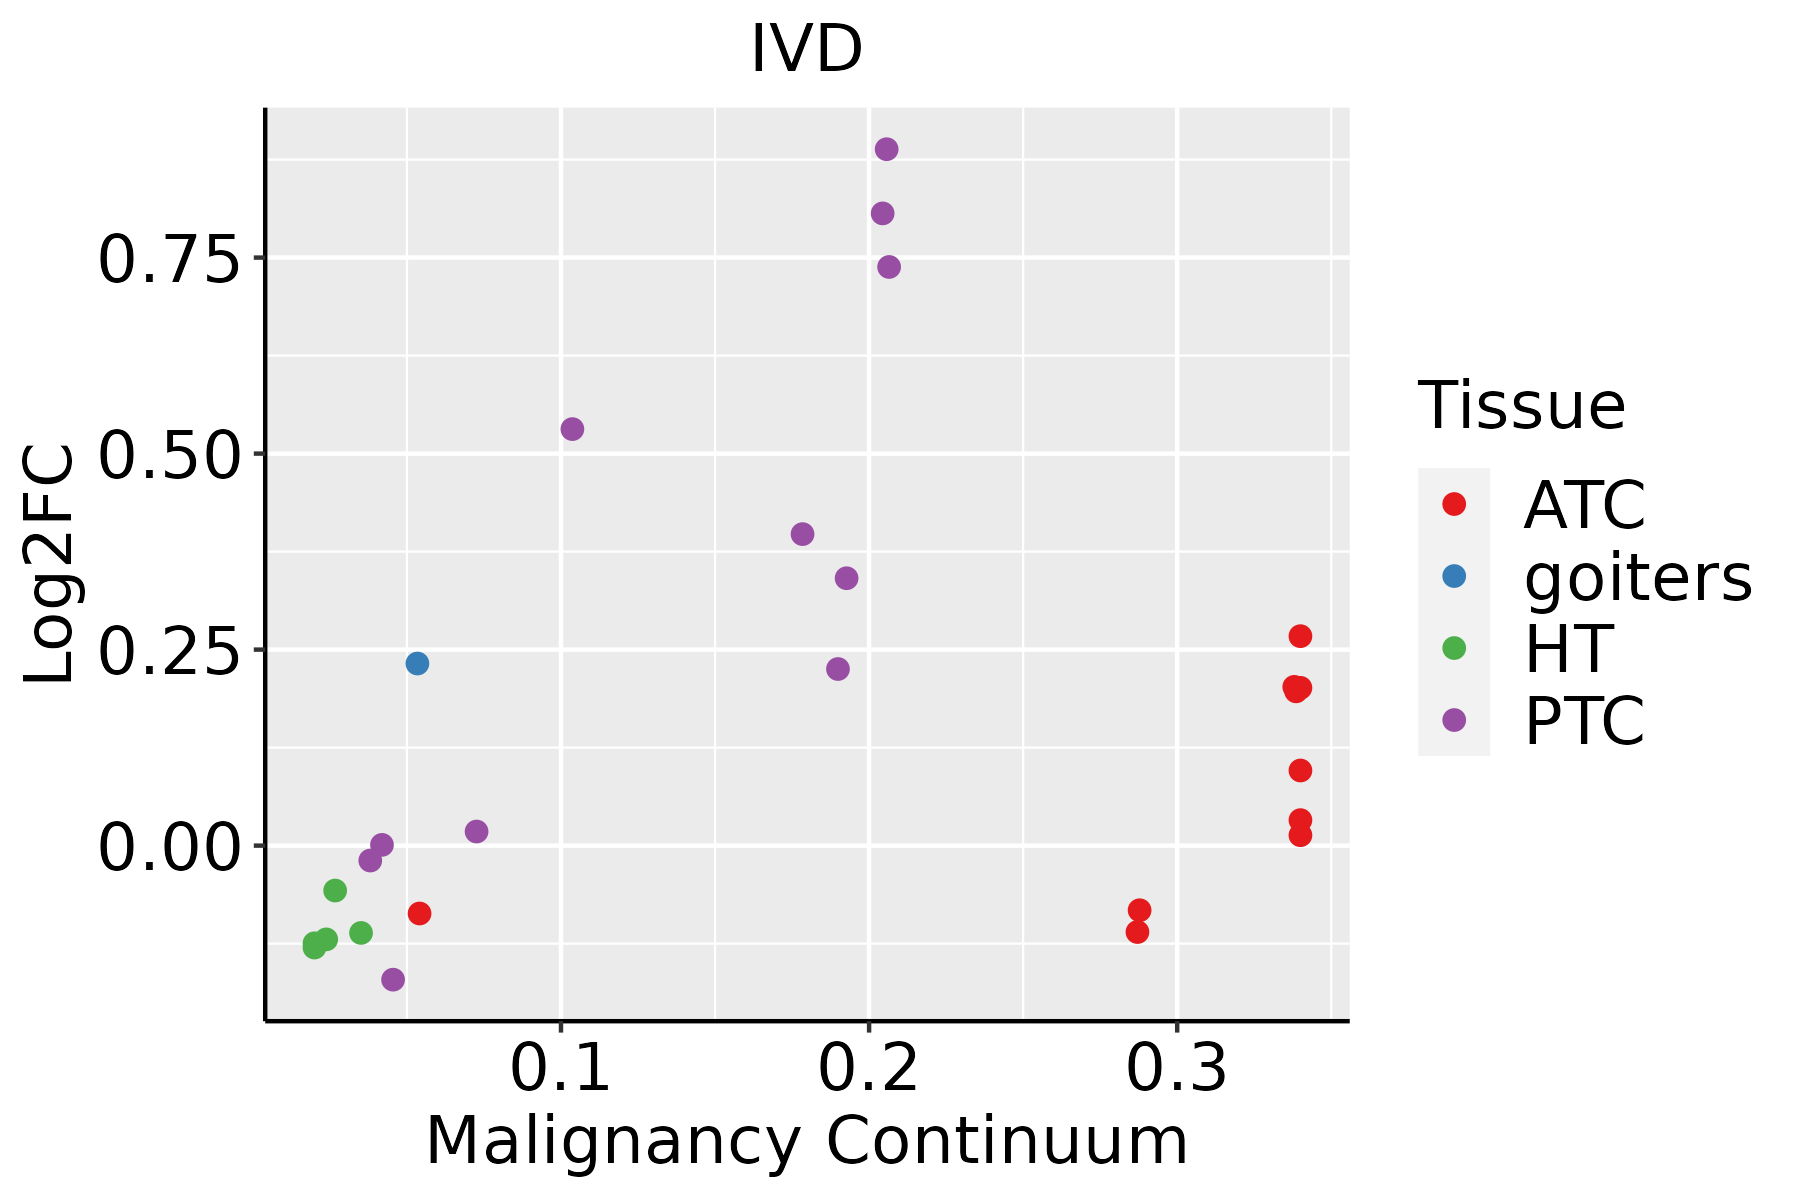 | ATC: Anaplastic thyroid cancer |
| HT: Hashimoto's thyroiditis |
| PTC: Papillary thyroid cancer |
| GO ID | Tissue | Disease Stage | Description | Gene Ratio | Bg Ratio | pvalue | p.adjust | Count |
| GO:00463953 | Liver | NAFLD | carboxylic acid catabolic process | 73/1882 | 236/18723 | 4.16e-19 | 1.22e-15 | 73 |
| GO:00160544 | Liver | NAFLD | organic acid catabolic process | 73/1882 | 240/18723 | 1.20e-18 | 2.34e-15 | 73 |
| GO:00442825 | Liver | NAFLD | small molecule catabolic process | 91/1882 | 376/18723 | 8.96e-16 | 1.31e-12 | 91 |
| GO:00066316 | Liver | NAFLD | fatty acid metabolic process | 92/1882 | 390/18723 | 3.38e-15 | 3.29e-12 | 92 |
| GO:00723295 | Liver | NAFLD | monocarboxylic acid catabolic process | 39/1882 | 122/18723 | 2.40e-11 | 8.77e-09 | 39 |
| GO:0009063 | Liver | NAFLD | cellular amino acid catabolic process | 36/1882 | 110/18723 | 6.56e-11 | 1.99e-08 | 36 |
| GO:00090626 | Liver | NAFLD | fatty acid catabolic process | 34/1882 | 100/18723 | 6.81e-11 | 1.99e-08 | 34 |
| GO:00193956 | Liver | NAFLD | fatty acid oxidation | 33/1882 | 103/18723 | 7.58e-10 | 1.53e-07 | 33 |
| GO:00065203 | Liver | NAFLD | cellular amino acid metabolic process | 63/1882 | 284/18723 | 1.14e-09 | 2.17e-07 | 63 |
| GO:00442425 | Liver | NAFLD | cellular lipid catabolic process | 52/1882 | 214/18723 | 1.15e-09 | 2.17e-07 | 52 |
| GO:00344405 | Liver | NAFLD | lipid oxidation | 33/1882 | 108/18723 | 2.96e-09 | 4.56e-07 | 33 |
| GO:00302585 | Liver | NAFLD | lipid modification | 49/1882 | 212/18723 | 1.97e-08 | 2.17e-06 | 49 |
| GO:00160426 | Liver | NAFLD | lipid catabolic process | 63/1882 | 320/18723 | 1.35e-07 | 1.02e-05 | 63 |
| GO:00066356 | Liver | NAFLD | fatty acid beta-oxidation | 23/1882 | 74/18723 | 5.09e-07 | 3.07e-05 | 23 |
| GO:00090813 | Liver | NAFLD | branched-chain amino acid metabolic process | 8/1882 | 19/18723 | 2.81e-04 | 4.51e-03 | 8 |
| GO:00090834 | Liver | NAFLD | branched-chain amino acid catabolic process | 7/1882 | 15/18723 | 3.18e-04 | 4.95e-03 | 7 |
| GO:000663112 | Liver | Cirrhotic | fatty acid metabolic process | 165/4634 | 390/18723 | 1.29e-14 | 1.26e-12 | 165 |
| GO:004428211 | Liver | Cirrhotic | small molecule catabolic process | 151/4634 | 376/18723 | 2.20e-11 | 1.34e-09 | 151 |
| GO:001605411 | Liver | Cirrhotic | organic acid catabolic process | 104/4634 | 240/18723 | 1.91e-10 | 9.53e-09 | 104 |
| GO:004639511 | Liver | Cirrhotic | carboxylic acid catabolic process | 102/4634 | 236/18723 | 3.41e-10 | 1.63e-08 | 102 |
| Pathway ID | Tissue | Disease Stage | Description | Gene Ratio | Bg Ratio | pvalue | p.adjust | qvalue | Count |
| hsa00280 | Colorectum | AD | Valine, leucine and isoleucine degradation | 25/2092 | 48/8465 | 3.97e-05 | 3.41e-04 | 2.18e-04 | 25 |
| hsa002801 | Colorectum | AD | Valine, leucine and isoleucine degradation | 25/2092 | 48/8465 | 3.97e-05 | 3.41e-04 | 2.18e-04 | 25 |
| hsa002802 | Colorectum | MSS | Valine, leucine and isoleucine degradation | 21/1875 | 48/8465 | 6.73e-04 | 4.51e-03 | 2.76e-03 | 21 |
| hsa002803 | Colorectum | MSS | Valine, leucine and isoleucine degradation | 21/1875 | 48/8465 | 6.73e-04 | 4.51e-03 | 2.76e-03 | 21 |
| hsa002804 | Colorectum | FAP | Valine, leucine and isoleucine degradation | 18/1404 | 48/8465 | 3.94e-04 | 3.06e-03 | 1.86e-03 | 18 |
| hsa002805 | Colorectum | FAP | Valine, leucine and isoleucine degradation | 18/1404 | 48/8465 | 3.94e-04 | 3.06e-03 | 1.86e-03 | 18 |
| hsa002809 | Esophagus | ESCC | Valine, leucine and isoleucine degradation | 34/4205 | 48/8465 | 2.34e-03 | 6.54e-03 | 3.35e-03 | 34 |
| hsa0028014 | Esophagus | ESCC | Valine, leucine and isoleucine degradation | 34/4205 | 48/8465 | 2.34e-03 | 6.54e-03 | 3.35e-03 | 34 |
| hsa002806 | Liver | NAFLD | Valine, leucine and isoleucine degradation | 20/1043 | 48/8465 | 3.03e-07 | 1.65e-05 | 1.33e-05 | 20 |
| hsa0028011 | Liver | NAFLD | Valine, leucine and isoleucine degradation | 20/1043 | 48/8465 | 3.03e-07 | 1.65e-05 | 1.33e-05 | 20 |
| hsa0028021 | Liver | Cirrhotic | Valine, leucine and isoleucine degradation | 32/2530 | 48/8465 | 1.45e-07 | 2.02e-06 | 1.24e-06 | 32 |
| hsa0028031 | Liver | Cirrhotic | Valine, leucine and isoleucine degradation | 32/2530 | 48/8465 | 1.45e-07 | 2.02e-06 | 1.24e-06 | 32 |
| hsa0028041 | Liver | HCC | Valine, leucine and isoleucine degradation | 41/4020 | 48/8465 | 4.84e-08 | 7.05e-07 | 3.92e-07 | 41 |
| hsa0028051 | Liver | HCC | Valine, leucine and isoleucine degradation | 41/4020 | 48/8465 | 4.84e-08 | 7.05e-07 | 3.92e-07 | 41 |
| hsa002808 | Oral cavity | OSCC | Valine, leucine and isoleucine degradation | 30/3704 | 48/8465 | 6.75e-03 | 1.57e-02 | 7.99e-03 | 30 |
| hsa0028013 | Oral cavity | OSCC | Valine, leucine and isoleucine degradation | 30/3704 | 48/8465 | 6.75e-03 | 1.57e-02 | 7.99e-03 | 30 |
| hsa002807 | Prostate | Tumor | Valine, leucine and isoleucine degradation | 20/1791 | 48/8465 | 1.03e-03 | 4.59e-03 | 2.84e-03 | 20 |
| hsa0028012 | Prostate | Tumor | Valine, leucine and isoleucine degradation | 20/1791 | 48/8465 | 1.03e-03 | 4.59e-03 | 2.84e-03 | 20 |
| Hugo Symbol | Variant Class | Variant Classification | dbSNP RS | HGVSc | HGVSp | HGVSp Short | SWISSPROT | BIOTYPE | SIFT | PolyPhen | Tumor Sample Barcode | Tissue | Histology | Sex | Age | Stage | Therapy Types | Drugs | Outcome |
| IVD | SNV | Missense_Mutation | rs189587579 | c.47C>T | p.Ala16Val | p.A16V | | protein_coding | tolerated_low_confidence(0.07) | benign(0.001) | TCGA-A2-A0YJ-01 | Breast | breast invasive carcinoma | Female | <65 | III/IV | Chemotherapy | cytoxan | PD |
| IVD | SNV | Missense_Mutation | | c.1193G>A | p.Arg398Gln | p.R398Q | | protein_coding | deleterious(0) | probably_damaging(1) | TCGA-AN-A046-01 | Breast | breast invasive carcinoma | Female | >=65 | I/II | Unknown | Unknown | SD |
| IVD | SNV | Missense_Mutation | novel | c.54N>C | p.Trp18Cys | p.W18C | | protein_coding | tolerated_low_confidence(0.15) | benign(0.012) | TCGA-EW-A6SD-01 | Breast | breast invasive carcinoma | Female | <65 | I/II | Chemotherapy | tch | SD |
| IVD | insertion | In_Frame_Ins | novel | c.352_353insGTGGCCAGATGATGTGTT | p.Ile118delinsSerGlyGlnMetMetCysLeu | p.I118delinsSGQMMCL | | protein_coding | | | TCGA-AO-A0JB-01 | Breast | breast invasive carcinoma | Female | <65 | III/IV | Chemotherapy | cyclophosphamide | SD |
| IVD | insertion | Frame_Shift_Ins | novel | c.354_355insATAGGCTG | p.Ser119IlefsTer41 | p.S119Ifs*41 | | protein_coding | | | TCGA-AO-A0JB-01 | Breast | breast invasive carcinoma | Female | <65 | III/IV | Chemotherapy | cyclophosphamide | SD |
| IVD | SNV | Missense_Mutation | | c.793G>A | p.Ala265Thr | p.A265T | | protein_coding | tolerated(0.19) | benign(0.14) | TCGA-AA-3844-01 | Colorectum | colon adenocarcinoma | Female | >=65 | III/IV | Chemotherapy | capecitabine | PD |
| IVD | SNV | Missense_Mutation | novel | c.1055N>G | p.Glu352Gly | p.E352G | | protein_coding | deleterious(0.05) | benign(0.054) | TCGA-AU-6004-01 | Colorectum | colon adenocarcinoma | Female | >=65 | I/II | Unknown | Unknown | SD |
| IVD | SNV | Missense_Mutation | rs755368630 | c.217N>T | p.Arg73Cys | p.R73C | | protein_coding | deleterious(0) | possibly_damaging(0.632) | TCGA-F5-6464-01 | Colorectum | rectum adenocarcinoma | Female | >=65 | III/IV | Unknown | Unknown | SD |
| IVD | SNV | Missense_Mutation | novel | c.396N>A | p.His132Gln | p.H132Q | | protein_coding | deleterious(0) | probably_damaging(0.981) | TCGA-A5-A0G2-01 | Endometrium | uterine corpus endometrioid carcinoma | Female | <65 | III/IV | Unknown | Unknown | SD |
| IVD | SNV | Missense_Mutation | novel | c.1036N>T | p.Val346Phe | p.V346F | | protein_coding | deleterious(0) | probably_damaging(0.991) | TCGA-A5-A0G2-01 | Endometrium | uterine corpus endometrioid carcinoma | Female | <65 | III/IV | Unknown | Unknown | SD |


