
|
|||||
|
 | |
| |
| |
| |
| |
| |
|
Gene: IRF6 |
Gene summary for IRF6 |
| Gene information | Species | Human | Gene symbol | IRF6 | Gene ID | 3664 |
| Gene name | interferon regulatory factor 6 | |
| Gene Alias | LPS | |
| Cytomap | 1q32.2 | |
| Gene Type | protein-coding | GO ID | GO:0002376 | UniProtAcc | O14896 |
Top |
Malignant transformation analysis |
| Identification of the aberrant gene expression in precancerous and cancerous lesions by comparing the gene expression of stem-like cells in diseased tissues with normal stem cells |
| Entrez ID | Symbol | Replicates | Species | Organ | Tissue | Adj P-value | Log2FC | Malignancy |
| 3664 | IRF6 | CA_HPV_1 | Human | Cervix | CC | 6.46e-03 | -1.63e-01 | 0.0264 |
| 3664 | IRF6 | CA_HPV_2 | Human | Cervix | CC | 2.76e-02 | 2.19e-01 | 0.0391 |
| 3664 | IRF6 | CCI_1 | Human | Cervix | CC | 1.46e-02 | 9.11e-01 | 0.528 |
| 3664 | IRF6 | Tumor | Human | Cervix | CC | 1.43e-23 | 5.34e-01 | 0.1241 |
| 3664 | IRF6 | sample1 | Human | Cervix | CC | 3.26e-08 | 5.58e-01 | 0.0959 |
| 3664 | IRF6 | sample3 | Human | Cervix | CC | 8.57e-41 | 6.45e-01 | 0.1387 |
| 3664 | IRF6 | T1 | Human | Cervix | CC | 4.31e-13 | 4.83e-01 | 0.0918 |
| 3664 | IRF6 | T3 | Human | Cervix | CC | 1.33e-28 | 6.32e-01 | 0.1389 |
| 3664 | IRF6 | HTA11_2487_2000001011 | Human | Colorectum | SER | 1.65e-03 | 3.23e-01 | -0.1808 |
| 3664 | IRF6 | HTA11_1938_2000001011 | Human | Colorectum | AD | 2.37e-04 | 3.17e-01 | -0.0811 |
| 3664 | IRF6 | HTA11_78_2000001011 | Human | Colorectum | AD | 2.10e-09 | 5.13e-01 | -0.1088 |
| 3664 | IRF6 | HTA11_347_2000001011 | Human | Colorectum | AD | 1.77e-16 | 4.70e-01 | -0.1954 |
| 3664 | IRF6 | HTA11_411_2000001011 | Human | Colorectum | SER | 3.37e-06 | 8.34e-01 | -0.2602 |
| 3664 | IRF6 | HTA11_83_2000001011 | Human | Colorectum | SER | 9.38e-05 | 2.77e-01 | -0.1526 |
| 3664 | IRF6 | HTA11_2992_2000001011 | Human | Colorectum | SER | 1.27e-04 | 4.51e-01 | -0.1706 |
| 3664 | IRF6 | HTA11_5212_2000001011 | Human | Colorectum | AD | 3.63e-02 | 3.83e-01 | -0.2061 |
| 3664 | IRF6 | HTA11_6801_2000001011 | Human | Colorectum | SER | 1.33e-02 | 3.75e-01 | 0.0171 |
| 3664 | IRF6 | HTA11_99999965104_69814 | Human | Colorectum | MSS | 1.32e-03 | 2.95e-01 | 0.281 |
| 3664 | IRF6 | HTA11_99999971662_82457 | Human | Colorectum | MSS | 1.77e-09 | 2.52e-01 | 0.3859 |
| 3664 | IRF6 | LZE4T | Human | Esophagus | ESCC | 8.10e-08 | 5.81e-01 | 0.0811 |
| Page: 1 2 3 4 5 6 |
| Tissue | Expression Dynamics | Abbreviation |
| Cervix | 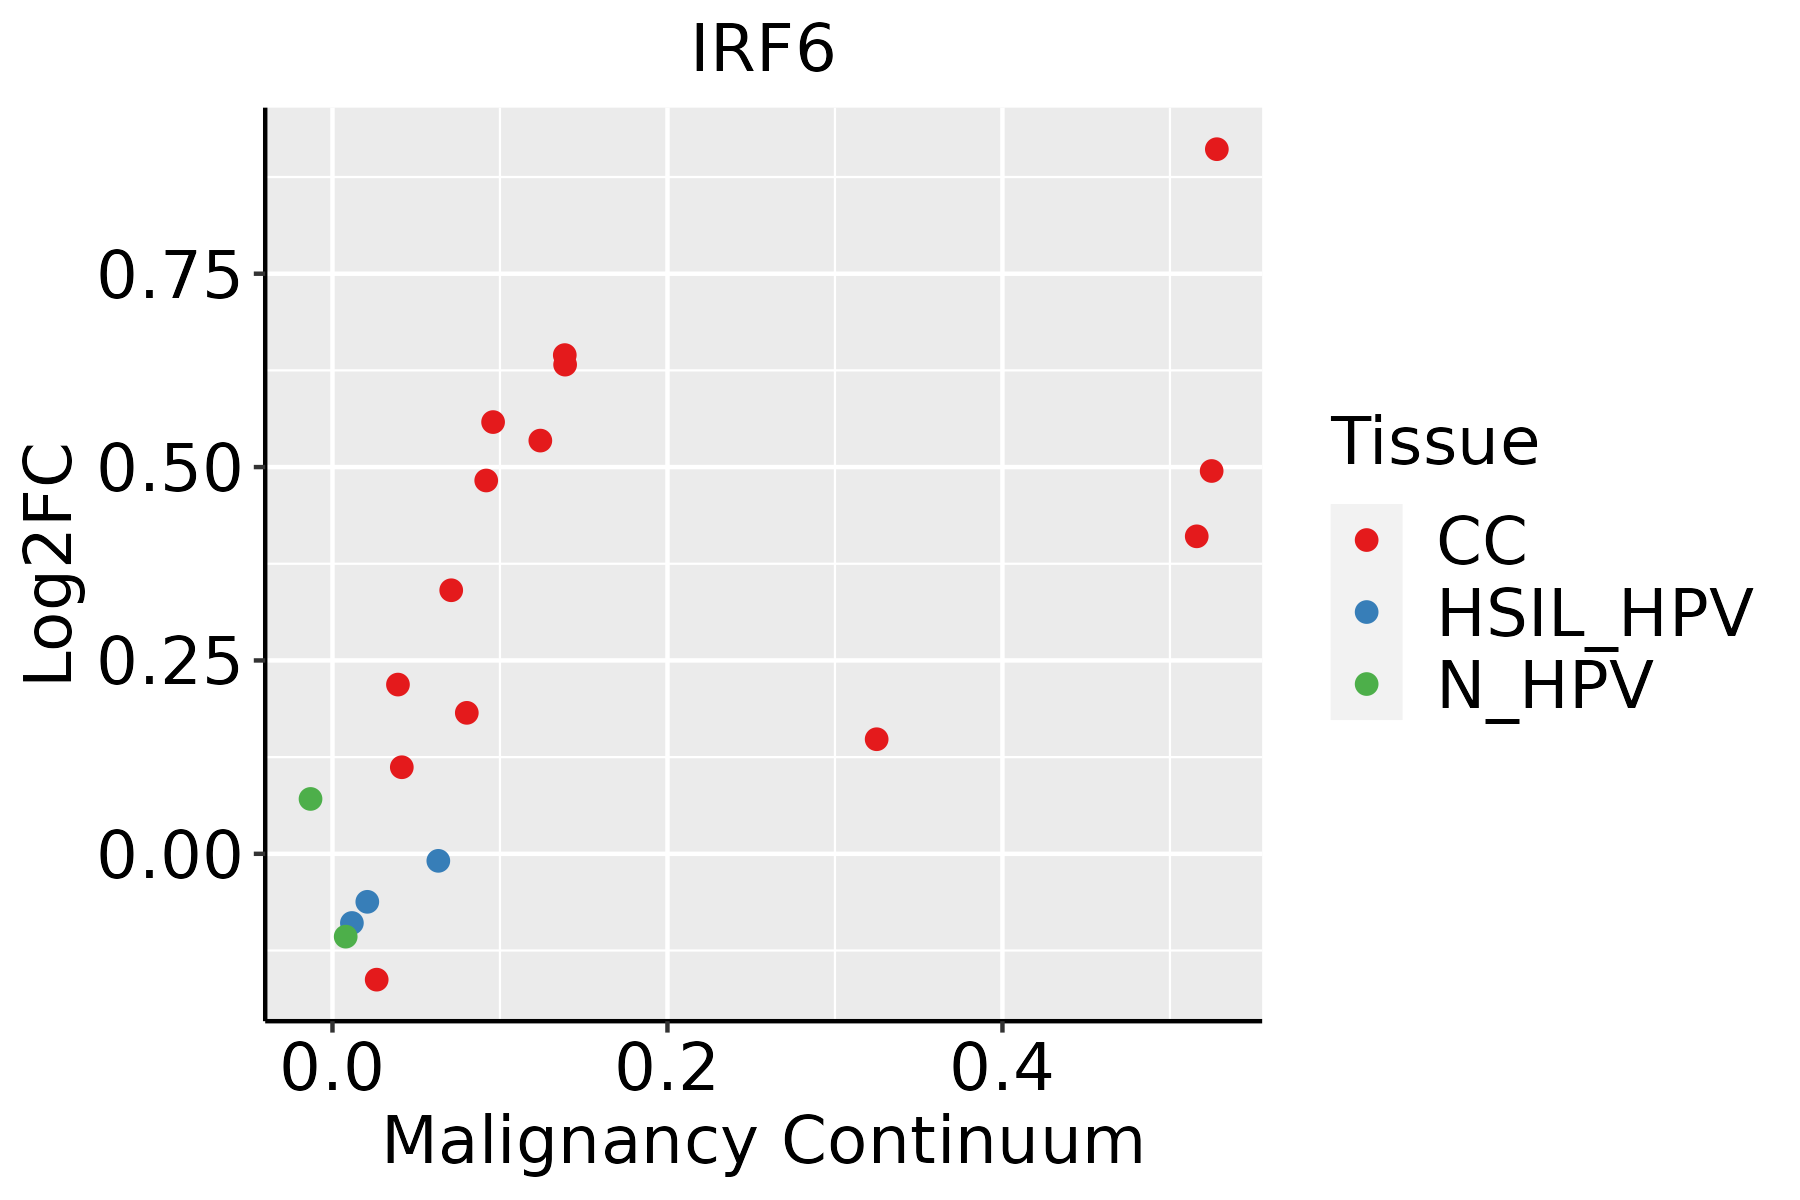 | CC: Cervix cancer |
| HSIL_HPV: HPV-infected high-grade squamous intraepithelial lesions | ||
| N_HPV: HPV-infected normal cervix | ||
| Colorectum (GSE201348) |  | FAP: Familial adenomatous polyposis |
| CRC: Colorectal cancer | ||
| Colorectum (HTA11) |  | AD: Adenomas |
| SER: Sessile serrated lesions | ||
| MSI-H: Microsatellite-high colorectal cancer | ||
| MSS: Microsatellite stable colorectal cancer | ||
| Esophagus | 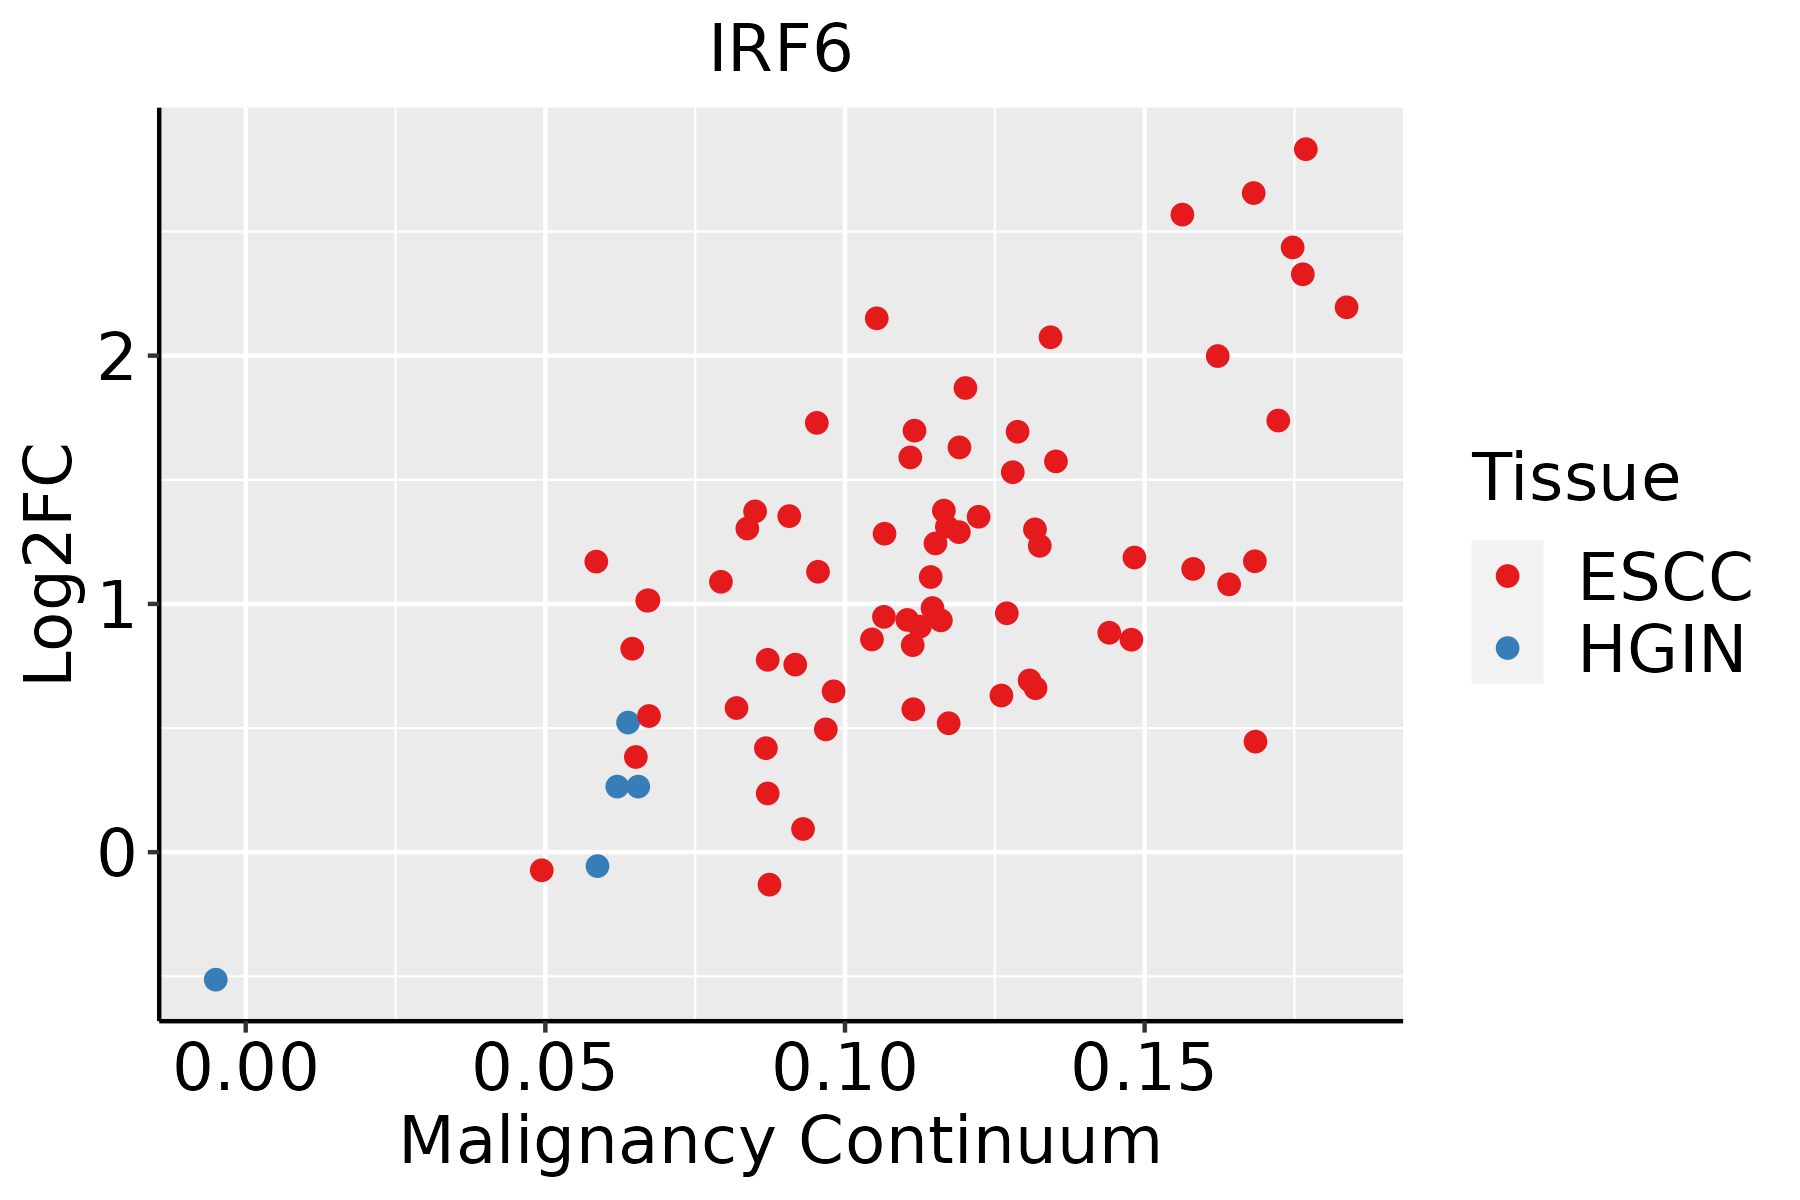 | ESCC: Esophageal squamous cell carcinoma |
| HGIN: High-grade intraepithelial neoplasias | ||
| LGIN: Low-grade intraepithelial neoplasias | ||
| Liver |  | HCC: Hepatocellular carcinoma |
| NAFLD: Non-alcoholic fatty liver disease | ||
| Oral Cavity |  | EOLP: Erosive Oral lichen planus |
| LP: leukoplakia | ||
| NEOLP: Non-erosive oral lichen planus | ||
| OSCC: Oral squamous cell carcinoma | ||
| Skin | 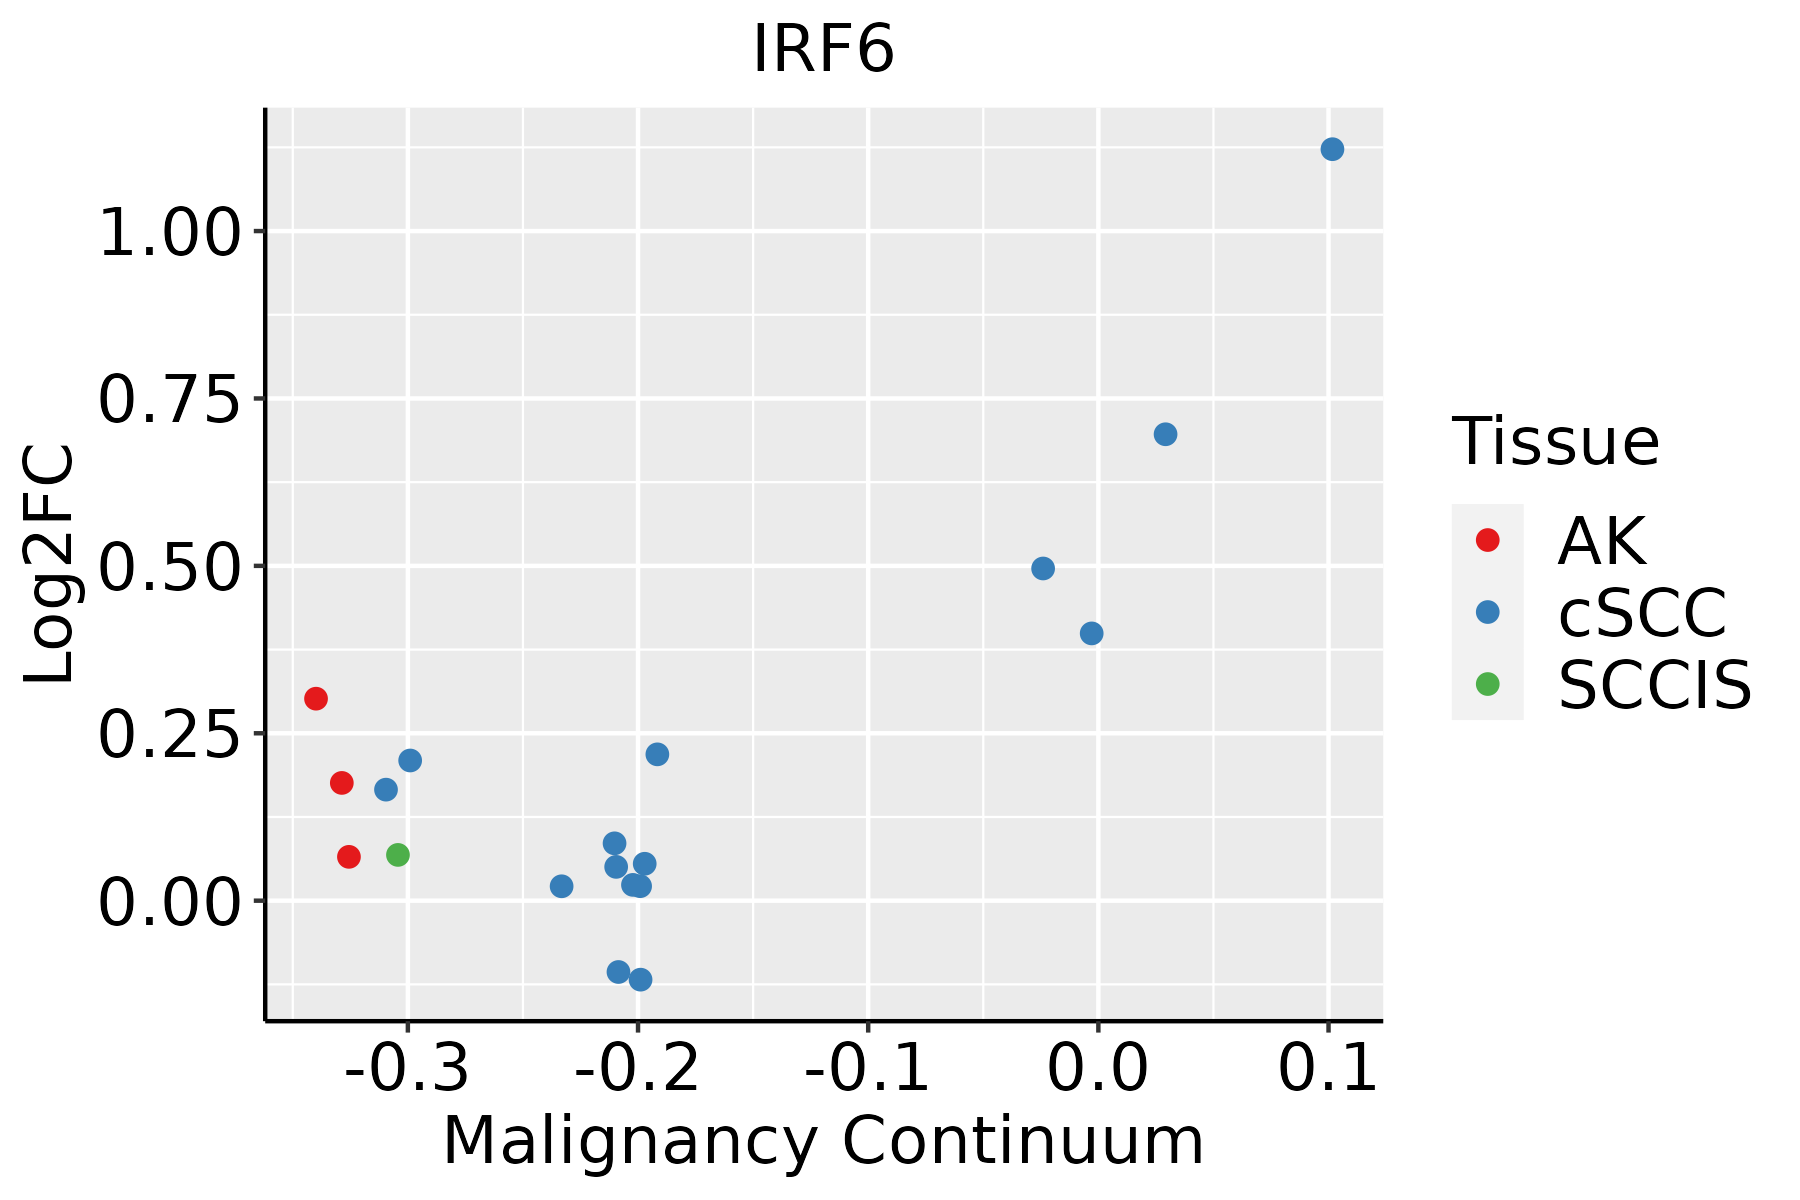 | AK: Actinic keratosis |
| cSCC: Cutaneous squamous cell carcinoma | ||
| SCCIS:squamous cell carcinoma in situ |
| ∗log2FC in expression of this searched gene in stem-like cells from each diseased tissue sample relative to stem-like cells in normal samples in each tissue plotted against the malignancy continuum. Samples are colored based on if they are from different disease stage. |
Top |
Malignant transformation related pathway analysis |
| Find out the enriched GO biological processes and KEGG pathways involved in transition from healthy to precancer to cancer |
| Tissue | Disease Stage | Enriched GO biological Processes |
| Colorectum | AD |  |
| Colorectum | SER |  |
| Colorectum | MSS |  |
| Colorectum | MSI-H |  |
| Colorectum | FAP |  |
| ∗Top 15 enriched GO BP terms are showed in the bar plot of each disease state in each tissue. Each row represents a significant GO biological process which is colored according to the -log10(p.adjust). |
| Page: 1 2 3 4 5 6 7 8 9 |
| GO ID | Tissue | Disease Stage | Description | Gene Ratio | Bg Ratio | pvalue | p.adjust | Count |
| GO:000854416 | Oral cavity | LP | epidermis development | 112/4623 | 324/18723 | 3.81e-05 | 5.61e-04 | 112 |
| GO:004358816 | Oral cavity | LP | skin development | 93/4623 | 263/18723 | 6.47e-05 | 8.70e-04 | 93 |
| GO:004361612 | Oral cavity | LP | keratinocyte proliferation | 22/4623 | 46/18723 | 5.55e-04 | 5.13e-03 | 22 |
| GO:003021613 | Oral cavity | LP | keratinocyte differentiation | 51/4623 | 139/18723 | 1.05e-03 | 8.84e-03 | 51 |
| GO:000991315 | Oral cavity | LP | epidermal cell differentiation | 69/4623 | 202/18723 | 1.53e-03 | 1.19e-02 | 69 |
| GO:000854417 | Skin | AK | epidermis development | 79/1910 | 324/18723 | 1.04e-13 | 3.25e-11 | 79 |
| GO:00435889 | Skin | AK | skin development | 67/1910 | 263/18723 | 9.02e-13 | 2.14e-10 | 67 |
| GO:004873226 | Skin | AK | gland development | 93/1910 | 436/18723 | 3.24e-12 | 7.10e-10 | 93 |
| GO:005067319 | Skin | AK | epithelial cell proliferation | 86/1910 | 437/18723 | 1.52e-09 | 1.43e-07 | 86 |
| GO:00436168 | Skin | AK | keratinocyte proliferation | 19/1910 | 46/18723 | 3.70e-08 | 1.94e-06 | 19 |
| GO:00302168 | Skin | AK | keratinocyte differentiation | 35/1910 | 139/18723 | 3.27e-07 | 1.27e-05 | 35 |
| GO:000991316 | Skin | AK | epidermal cell differentiation | 45/1910 | 202/18723 | 3.50e-07 | 1.35e-05 | 45 |
| GO:003087915 | Skin | AK | mammary gland development | 31/1910 | 137/18723 | 1.60e-05 | 3.09e-04 | 31 |
| GO:00611808 | Skin | AK | mammary gland epithelium development | 18/1910 | 67/18723 | 9.30e-05 | 1.25e-03 | 18 |
| GO:004358823 | Skin | cSCC | skin development | 111/4864 | 263/18723 | 6.35e-09 | 2.10e-07 | 111 |
| GO:000854425 | Skin | cSCC | epidermis development | 131/4864 | 324/18723 | 7.38e-09 | 2.39e-07 | 131 |
| GO:004873227 | Skin | cSCC | gland development | 167/4864 | 436/18723 | 7.64e-09 | 2.44e-07 | 167 |
| GO:003021622 | Skin | cSCC | keratinocyte differentiation | 59/4864 | 139/18723 | 1.70e-05 | 2.07e-04 | 59 |
| GO:000991324 | Skin | cSCC | epidermal cell differentiation | 78/4864 | 202/18723 | 5.12e-05 | 5.28e-04 | 78 |
| GO:004361621 | Skin | cSCC | keratinocyte proliferation | 24/4864 | 46/18723 | 1.32e-04 | 1.19e-03 | 24 |
| Page: 1 2 3 4 5 |
| Pathway ID | Tissue | Disease Stage | Description | Gene Ratio | Bg Ratio | pvalue | p.adjust | qvalue | Count |
| Page: 1 |
Top |
Cell-cell communication analysis |
| Identification of potential cell-cell interactions between two cell types and their ligand-receptor pairs for different disease states |
| Ligand | Receptor | LRpair | Pathway | Tissue | Disease Stage |
| Page: 1 |
Top |
Single-cell gene regulatory network inference analysis |
| Find out the significant the regulons (TFs) and the target genes of each regulon across cell types for different disease states |
| TF | Cell Type | Tissue | Disease Stage | Target Gene | RSS | Regulon Activity |
| IRF6 | CAF | Breast | ADJ | KRT17,SFN,KRT14, etc. | 9.99e-02 |  |
| IRF6 | pDC | Prostate | Healthy | ANXA2,TRAF4,TACSTD2, etc. | 2.47e-01 |  |
| IRF6 | FIB | Prostate | ADJ | KLF5,LAMC2,PERP, etc. | 8.32e-02 |  |
| IRF6 | INFIB | Prostate | ADJ | KLF5,LAMC2,PERP, etc. | 1.11e-01 | |
| IRF6 | INFIB | Prostate | BPH | KLF5,LAMC2,PERP, etc. | 2.67e-01 |  |
| IRF6 | INFIB | Prostate | Healthy | KLF5,LAMC2,PERP, etc. | 3.74e-01 | |
| IRF6 | INFIB | Prostate | Tumor | KLF5,LAMC2,PERP, etc. | 7.40e-02 |  |
| IRF6 | KER | Skin | Healthy | SFN,SERPINB5,LYPD3, etc. | 1.99e-01 |  |
| ∗The dot plots of a searched regulon are shown for all cell subpopulations in each disease state of each tissue based on the regulon specific score inferred using pySCENIC and by calculating the average expression. |
| Page: 1 |
Top |
Somatic mutation of malignant transformation related genes |
| Annotation of somatic variants for genes involved in malignant transformation |
| Hugo Symbol | Variant Class | Variant Classification | dbSNP RS | HGVSc | HGVSp | HGVSp Short | SWISSPROT | BIOTYPE | SIFT | PolyPhen | Tumor Sample Barcode | Tissue | Histology | Sex | Age | Stage | Therapy Types | Drugs | Outcome |
| IRF6 | SNV | Missense_Mutation | rs201017955 | c.781N>C | p.Asp261His | p.D261H | O14896 | protein_coding | deleterious(0.01) | probably_damaging(0.951) | TCGA-A8-A08R-01 | Breast | breast invasive carcinoma | Female | <65 | I/II | Unknown | Unknown | SD |
| IRF6 | SNV | Missense_Mutation | c.250N>A | p.Arg84Ser | p.R84S | O14896 | protein_coding | deleterious(0) | probably_damaging(1) | TCGA-C8-A1HL-01 | Breast | breast invasive carcinoma | Female | <65 | III/IV | Unknown | Unknown | SD | |
| IRF6 | SNV | Missense_Mutation | c.899N>C | p.Arg300Thr | p.R300T | O14896 | protein_coding | deleterious(0.04) | probably_damaging(1) | TCGA-D8-A1JA-01 | Breast | breast invasive carcinoma | Female | <65 | III/IV | Chemotherapy | adriamycin | PD | |
| IRF6 | SNV | Missense_Mutation | c.38G>C | p.Trp13Ser | p.W13S | O14896 | protein_coding | deleterious(0) | probably_damaging(1) | TCGA-E2-A10C-01 | Breast | breast invasive carcinoma | Female | <65 | I/II | Chemotherapy | cytoxan | SD | |
| IRF6 | SNV | Missense_Mutation | c.214N>A | p.Asp72Asn | p.D72N | O14896 | protein_coding | deleterious(0) | probably_damaging(0.999) | TCGA-DR-A0ZM-01 | Cervix | cervical & endocervical cancer | Female | <65 | III/IV | Unspecific | Cisplatin | SD | |
| IRF6 | SNV | Missense_Mutation | c.1296N>G | p.Ile432Met | p.I432M | O14896 | protein_coding | tolerated(0.88) | benign(0.201) | TCGA-IR-A3LH-01 | Cervix | cervical & endocervical cancer | Female | <65 | I/II | Chemotherapy | cisplatin | CR | |
| IRF6 | SNV | Missense_Mutation | c.315G>T | p.Met105Ile | p.M105I | O14896 | protein_coding | tolerated(0.5) | possibly_damaging(0.593) | TCGA-AA-3510-01 | Colorectum | colon adenocarcinoma | Male | >=65 | I/II | Unknown | Unknown | SD | |
| IRF6 | SNV | Missense_Mutation | c.301N>G | p.Lys101Glu | p.K101E | O14896 | protein_coding | deleterious(0) | possibly_damaging(0.648) | TCGA-AA-3715-01 | Colorectum | colon adenocarcinoma | Male | >=65 | I/II | Unknown | Unknown | PD | |
| IRF6 | SNV | Missense_Mutation | c.772N>T | p.Pro258Ser | p.P258S | O14896 | protein_coding | deleterious(0) | probably_damaging(0.949) | TCGA-AA-3930-01 | Colorectum | colon adenocarcinoma | Male | >=65 | III/IV | Chemotherapy | capecitabine | PD | |
| IRF6 | SNV | Missense_Mutation | c.274G>A | p.Glu92Lys | p.E92K | O14896 | protein_coding | deleterious(0.03) | probably_damaging(0.988) | TCGA-AA-A00N-01 | Colorectum | colon adenocarcinoma | Male | >=65 | I/II | Unknown | Unknown | PD |
| Page: 1 2 3 4 5 6 7 8 |
Top |
Related drugs of malignant transformation related genes |
| Identification of chemicals and drugs interact with genes involved in malignant transfromation |
| (DGIdb 4.0) |
| Entrez ID | Symbol | Category | Interaction Types | Drug Claim Name | Drug Name | PMIDs |
| 3664 | IRF6 | TRANSCRIPTION FACTOR | interferon beta-1b | 30013178 | ||
| 3664 | IRF6 | TRANSCRIPTION FACTOR | interferon beta-1a | 30013178 |
| Page: 1 |

Copyright 2023-Present -The University of Texas Health Science Center at Houston |