
|
|||||
|
 | |
| |
| |
| |
| |
| |
|
Gene: IFT88 |
Gene summary for IFT88 |
| Gene information | Species | Human | Gene symbol | IFT88 | Gene ID | 8100 |
| Gene name | intraflagellar transport 88 | |
| Gene Alias | D13S1056E | |
| Cytomap | 13q12.11 | |
| Gene Type | protein-coding | GO ID | GO:0000045 | UniProtAcc | B3KX42 |
Top |
Malignant transformation analysis |
| Identification of the aberrant gene expression in precancerous and cancerous lesions by comparing the gene expression of stem-like cells in diseased tissues with normal stem cells |
| Entrez ID | Symbol | Replicates | Species | Organ | Tissue | Adj P-value | Log2FC | Malignancy |
| 8100 | IFT88 | NAFLD1 | Human | Liver | NAFLD | 7.76e-06 | 8.93e-01 | -0.04 |
| 8100 | IFT88 | S43 | Human | Liver | Cirrhotic | 1.16e-05 | -1.41e-01 | -0.0187 |
| 8100 | IFT88 | HCC1_Meng | Human | Liver | HCC | 1.92e-32 | -1.25e-01 | 0.0246 |
| 8100 | IFT88 | HCC2_Meng | Human | Liver | HCC | 1.51e-18 | -6.05e-02 | 0.0107 |
| 8100 | IFT88 | HCC2 | Human | Liver | HCC | 4.68e-08 | 3.47e+00 | 0.5341 |
| 8100 | IFT88 | Pt13.a | Human | Liver | HCC | 2.53e-02 | -1.92e-01 | 0.021 |
| 8100 | IFT88 | S028 | Human | Liver | HCC | 1.78e-02 | 3.83e-01 | 0.2503 |
| 8100 | IFT88 | S029 | Human | Liver | HCC | 8.39e-03 | 4.49e-01 | 0.2581 |
| 8100 | IFT88 | HTA12-23-1 | Human | Pancreas | PDAC | 4.93e-04 | 6.06e-01 | 0.3405 |
| 8100 | IFT88 | HTA12-26-1 | Human | Pancreas | PDAC | 1.35e-17 | 7.64e-01 | 0.3728 |
| 8100 | IFT88 | HTA12-29-1 | Human | Pancreas | PDAC | 2.56e-18 | 5.14e-01 | 0.3722 |
| 8100 | IFT88 | male-WTA | Human | Thyroid | PTC | 2.77e-13 | 6.72e-02 | 0.1037 |
| 8100 | IFT88 | PTC01 | Human | Thyroid | PTC | 5.39e-11 | 1.76e-01 | 0.1899 |
| 8100 | IFT88 | PTC03 | Human | Thyroid | PTC | 1.31e-05 | 1.06e-01 | 0.1784 |
| 8100 | IFT88 | PTC04 | Human | Thyroid | PTC | 2.13e-14 | 1.89e-01 | 0.1927 |
| 8100 | IFT88 | PTC05 | Human | Thyroid | PTC | 1.66e-16 | 3.20e-01 | 0.2065 |
| 8100 | IFT88 | PTC06 | Human | Thyroid | PTC | 1.53e-21 | 4.55e-01 | 0.2057 |
| 8100 | IFT88 | PTC07 | Human | Thyroid | PTC | 3.42e-31 | 4.20e-01 | 0.2044 |
| 8100 | IFT88 | ATC09 | Human | Thyroid | ATC | 4.83e-03 | 8.04e-02 | 0.2871 |
| 8100 | IFT88 | ATC13 | Human | Thyroid | ATC | 2.19e-27 | 4.91e-01 | 0.34 |
| Page: 1 2 |
| Tissue | Expression Dynamics | Abbreviation |
| Liver | 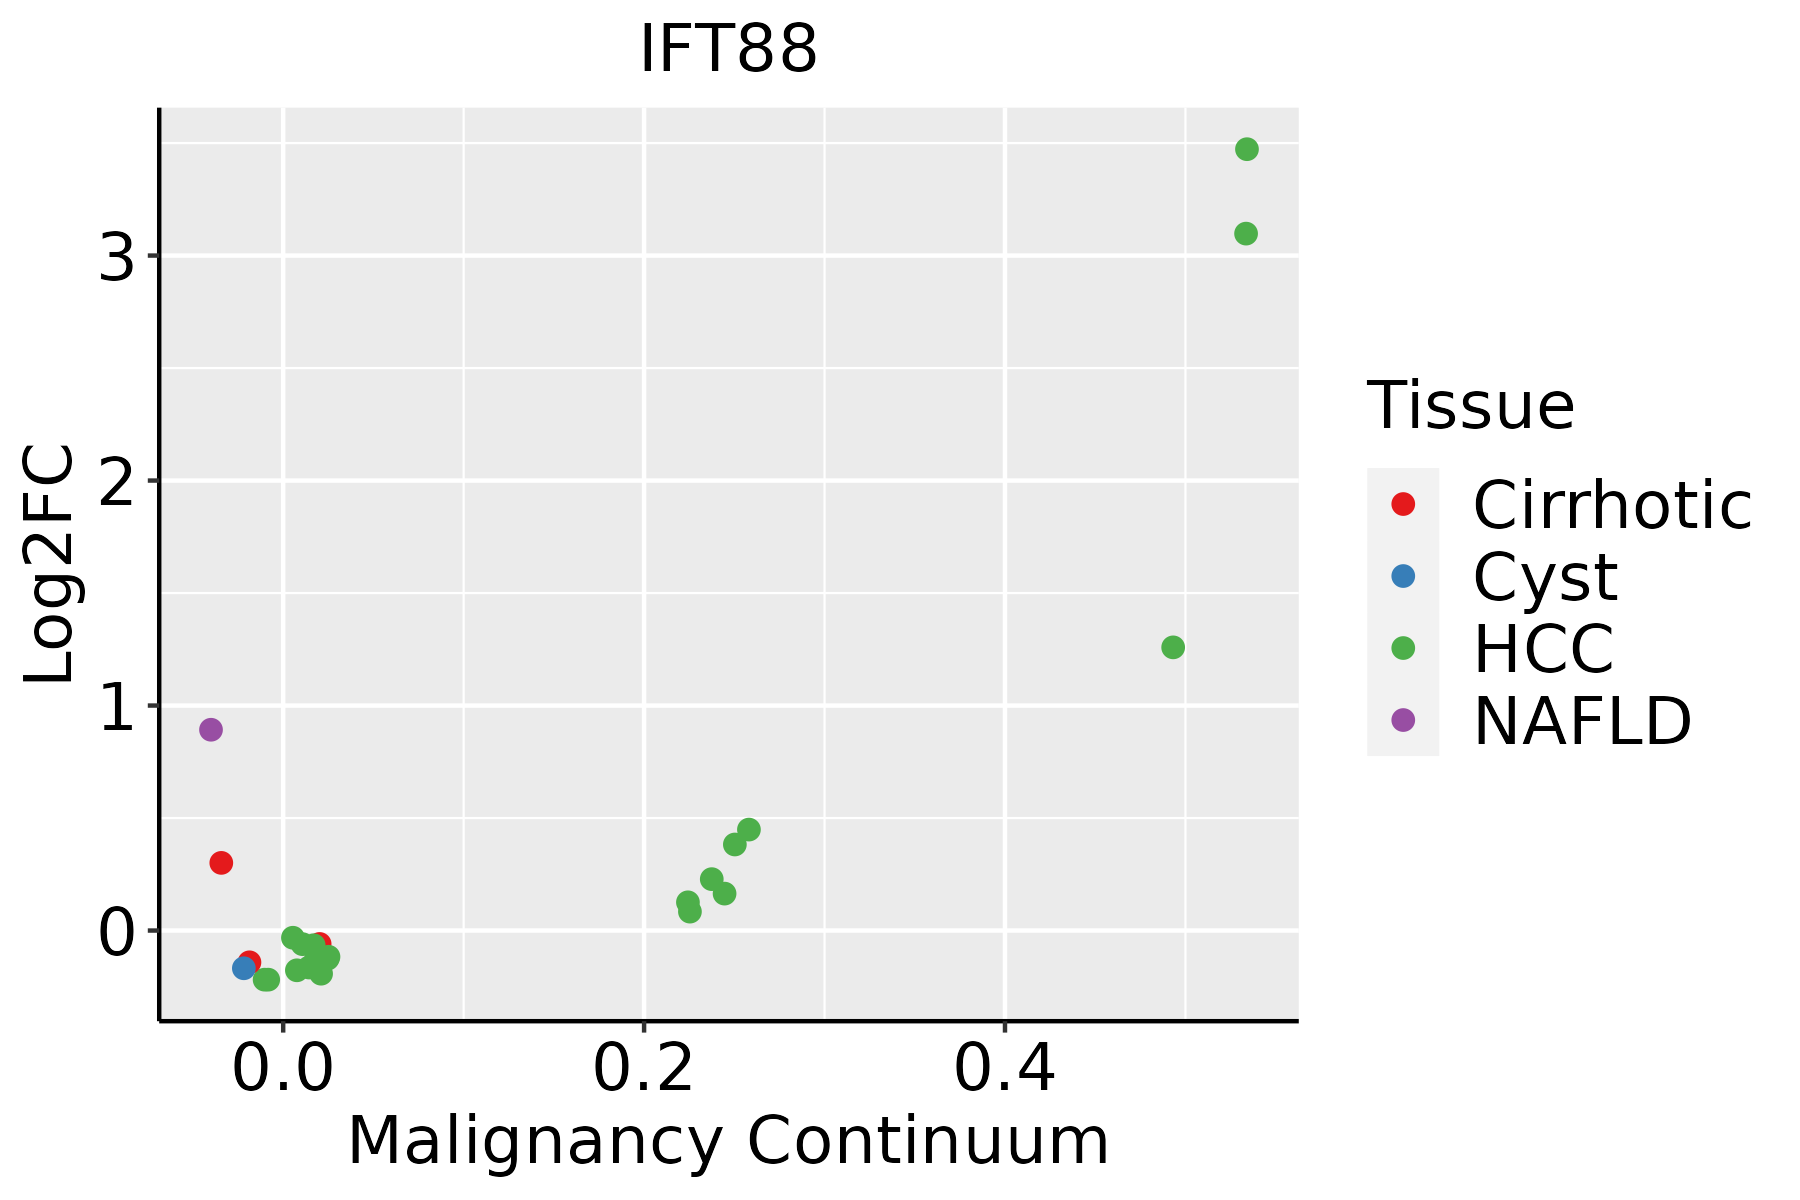 | HCC: Hepatocellular carcinoma |
| NAFLD: Non-alcoholic fatty liver disease | ||
| Thyroid | 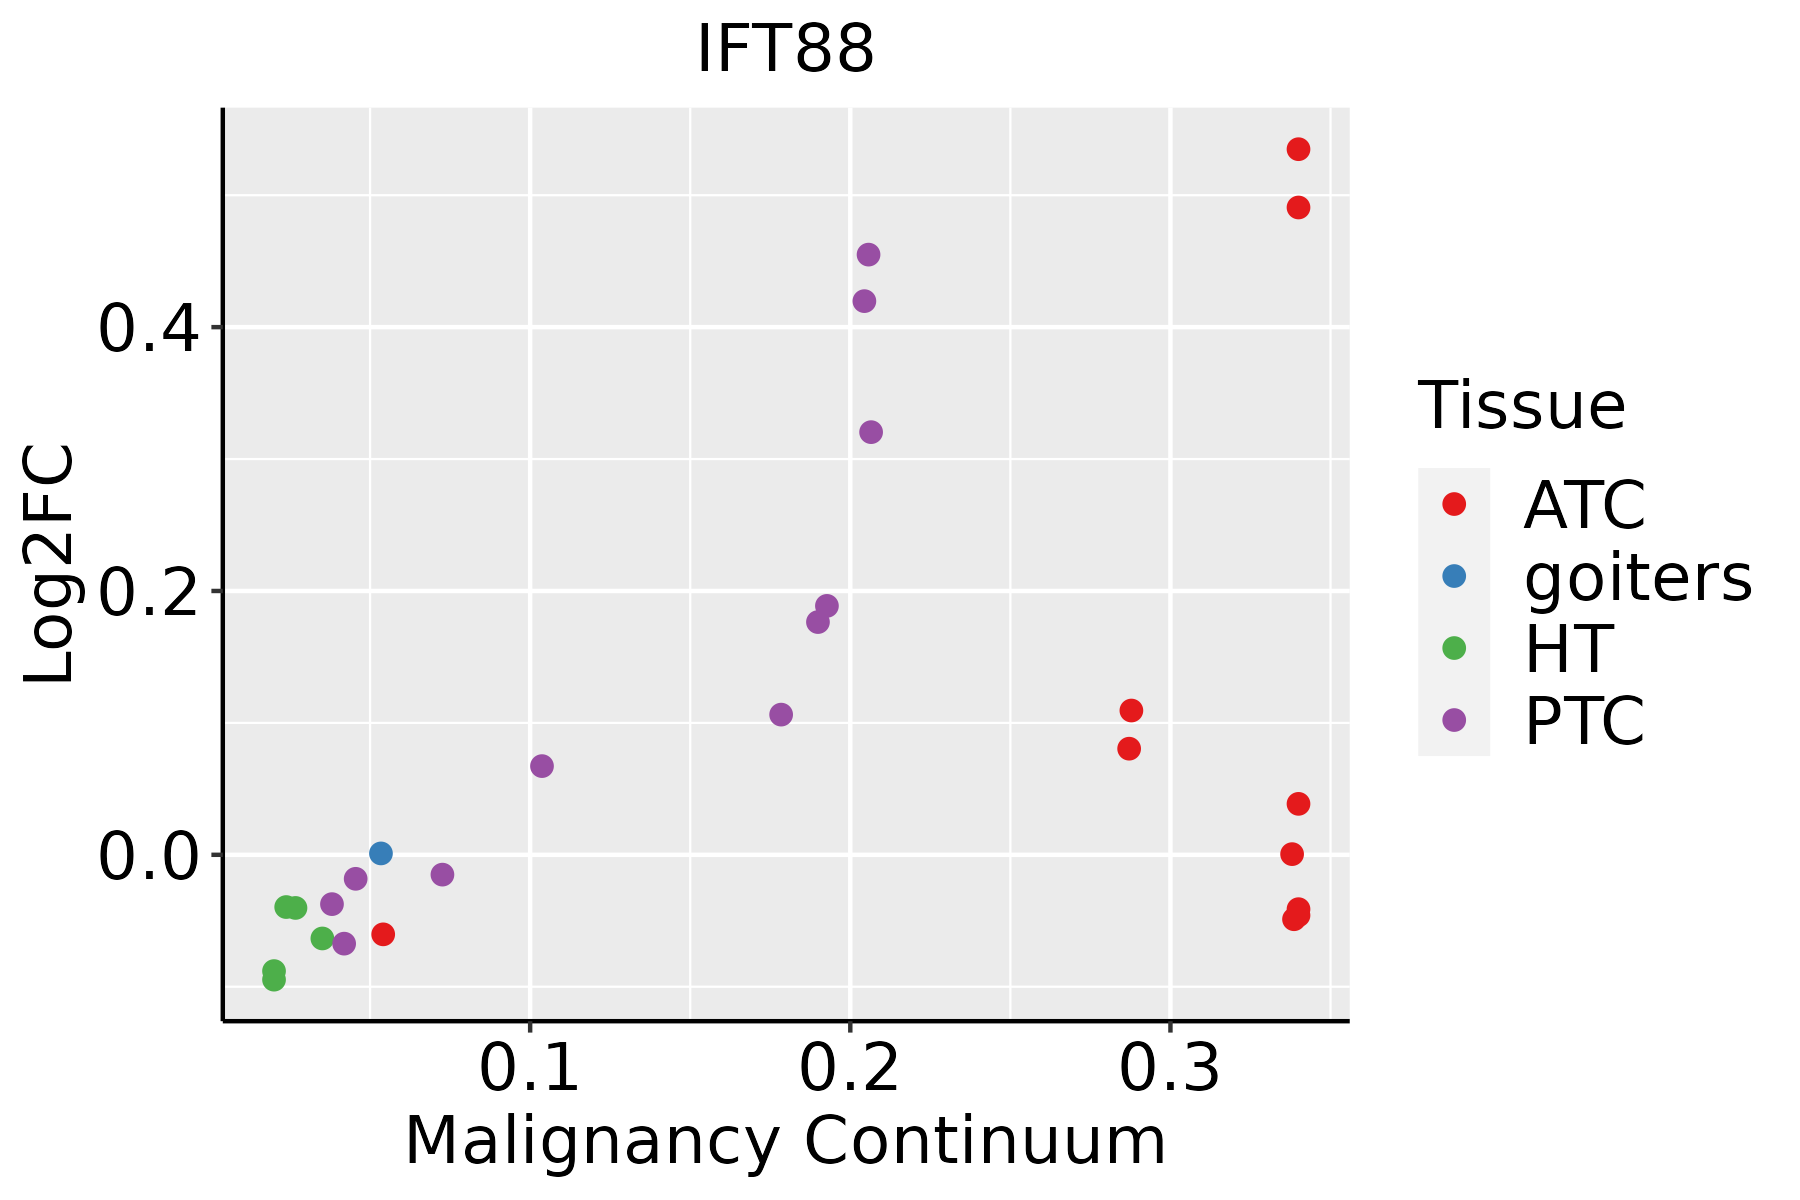 | ATC: Anaplastic thyroid cancer |
| HT: Hashimoto's thyroiditis | ||
| PTC: Papillary thyroid cancer |
| ∗log2FC in expression of this searched gene in stem-like cells from each diseased tissue sample relative to stem-like cells in normal samples in each tissue plotted against the malignancy continuum. Samples are colored based on if they are from different disease stage. |
Top |
Malignant transformation related pathway analysis |
| Find out the enriched GO biological processes and KEGG pathways involved in transition from healthy to precancer to cancer |
| Tissue | Disease Stage | Enriched GO biological Processes |
| Colorectum | AD |  |
| Colorectum | SER |  |
| Colorectum | MSS |  |
| Colorectum | MSI-H |  |
| Colorectum | FAP |  |
| ∗Top 15 enriched GO BP terms are showed in the bar plot of each disease state in each tissue. Each row represents a significant GO biological process which is colored according to the -log10(p.adjust). |
| Page: 1 2 3 4 5 6 7 8 9 |
| GO ID | Tissue | Disease Stage | Description | Gene Ratio | Bg Ratio | pvalue | p.adjust | Count |
| GO:004408813 | Thyroid | ATC | regulation of vacuole organization | 26/6293 | 45/18723 | 7.43e-04 | 4.14e-03 | 26 |
| GO:200078513 | Thyroid | ATC | regulation of autophagosome assembly | 21/6293 | 39/18723 | 7.26e-03 | 2.86e-02 | 21 |
| Page: 1 2 3 4 |
| Pathway ID | Tissue | Disease Stage | Description | Gene Ratio | Bg Ratio | pvalue | p.adjust | qvalue | Count |
| Page: 1 |
Top |
Cell-cell communication analysis |
| Identification of potential cell-cell interactions between two cell types and their ligand-receptor pairs for different disease states |
| Ligand | Receptor | LRpair | Pathway | Tissue | Disease Stage |
| Page: 1 |
Top |
Single-cell gene regulatory network inference analysis |
| Find out the significant the regulons (TFs) and the target genes of each regulon across cell types for different disease states |
| TF | Cell Type | Tissue | Disease Stage | Target Gene | RSS | Regulon Activity |
| ∗The dot plots of a searched regulon are shown for all cell subpopulations in each disease state of each tissue based on the regulon specific score inferred using pySCENIC and by calculating the average expression. |
| Page: 1 |
Top |
Somatic mutation of malignant transformation related genes |
| Annotation of somatic variants for genes involved in malignant transformation |
| Hugo Symbol | Variant Class | Variant Classification | dbSNP RS | HGVSc | HGVSp | HGVSp Short | SWISSPROT | BIOTYPE | SIFT | PolyPhen | Tumor Sample Barcode | Tissue | Histology | Sex | Age | Stage | Therapy Types | Drugs | Outcome |
| IFT88 | SNV | Missense_Mutation | c.767N>T | p.Arg256Ile | p.R256I | Q13099 | protein_coding | tolerated(0.05) | possibly_damaging(0.69) | TCGA-A2-A0CM-01 | Breast | breast invasive carcinoma | Female | <65 | I/II | Chemotherapy | adriamycin | PD | |
| IFT88 | SNV | Missense_Mutation | c.1796N>T | p.Ser599Phe | p.S599F | Q13099 | protein_coding | tolerated(0.27) | benign(0.276) | TCGA-A8-A08L-01 | Breast | breast invasive carcinoma | Female | >=65 | III/IV | Unknown | Unknown | SD | |
| IFT88 | SNV | Missense_Mutation | c.1020N>C | p.Leu340Phe | p.L340F | Q13099 | protein_coding | deleterious(0) | probably_damaging(0.994) | TCGA-AC-A23H-01 | Breast | breast invasive carcinoma | Female | >=65 | I/II | Unknown | Unknown | PD | |
| IFT88 | SNV | Missense_Mutation | c.243N>T | p.Lys81Asn | p.K81N | Q13099 | protein_coding | tolerated(0.44) | benign(0.272) | TCGA-C8-A12W-01 | Breast | breast invasive carcinoma | Female | <65 | III/IV | Unknown | Unknown | SD | |
| IFT88 | SNV | Missense_Mutation | c.1420G>C | p.Asp474His | p.D474H | Q13099 | protein_coding | deleterious(0) | possibly_damaging(0.498) | TCGA-E2-A14V-01 | Breast | breast invasive carcinoma | Female | <65 | I/II | Chemotherapy | cyclophosphamide | SD | |
| IFT88 | SNV | Missense_Mutation | c.1722N>A | p.Met574Ile | p.M574I | Q13099 | protein_coding | tolerated(0.3) | benign(0.06) | TCGA-E2-A1LA-01 | Breast | breast invasive carcinoma | Female | <65 | I/II | Hormone Therapy | arimidex | SD | |
| IFT88 | insertion | Nonsense_Mutation | novel | c.2376_2377insTAAGAACCTACAGTTAAGAAAAAGTATGCATGC | p.Glu792_Ile793insTer | p.E792_I793ins* | Q13099 | protein_coding | TCGA-A8-A08H-01 | Breast | breast invasive carcinoma | Female | >=65 | I/II | Unknown | Unknown | SD | ||
| IFT88 | SNV | Missense_Mutation | novel | c.1358A>G | p.Lys453Arg | p.K453R | Q13099 | protein_coding | tolerated(0.17) | probably_damaging(0.98) | TCGA-C5-A7UE-01 | Cervix | cervical & endocervical cancer | Female | <65 | I/II | Chemotherapy | cisplatin | SD |
| IFT88 | SNV | Missense_Mutation | novel | c.1367N>C | p.Arg456Thr | p.R456T | Q13099 | protein_coding | deleterious(0.05) | benign(0.115) | TCGA-C5-A902-01 | Cervix | cervical & endocervical cancer | Female | <65 | I/II | Chemotherapy | cisplatin | SD |
| IFT88 | SNV | Missense_Mutation | c.1366A>G | p.Arg456Gly | p.R456G | Q13099 | protein_coding | deleterious(0.01) | benign(0.079) | TCGA-AA-3715-01 | Colorectum | colon adenocarcinoma | Male | >=65 | I/II | Unknown | Unknown | PD |
| Page: 1 2 3 4 5 6 7 8 9 10 |
Top |
Related drugs of malignant transformation related genes |
| Identification of chemicals and drugs interact with genes involved in malignant transfromation |
| (DGIdb 4.0) |
| Entrez ID | Symbol | Category | Interaction Types | Drug Claim Name | Drug Name | PMIDs |
| Page: 1 |

Copyright 2023-Present -The University of Texas Health Science Center at Houston |