
|
|||||
|
 | |
| |
| |
| |
| |
| |
|
Gene: HPGD |
Gene summary for HPGD |
| Gene information | Species | Human | Gene symbol | HPGD | Gene ID | 3248 |
| Gene name | 15-hydroxyprostaglandin dehydrogenase | |
| Gene Alias | 15-PGDH | |
| Cytomap | 4q34.1 | |
| Gene Type | protein-coding | GO ID | GO:0000003 | UniProtAcc | P15428 |
Top |
Malignant transformation analysis |
| Identification of the aberrant gene expression in precancerous and cancerous lesions by comparing the gene expression of stem-like cells in diseased tissues with normal stem cells |
| Entrez ID | Symbol | Replicates | Species | Organ | Tissue | Adj P-value | Log2FC | Malignancy |
| 3248 | HPGD | CA_HPV_1 | Human | Cervix | CC | 2.65e-23 | -6.07e-01 | 0.0264 |
| 3248 | HPGD | CA_HPV_3 | Human | Cervix | CC | 1.89e-08 | -1.27e-01 | 0.0414 |
| 3248 | HPGD | HSIL_HPV_1 | Human | Cervix | HSIL_HPV | 6.88e-06 | 2.56e-01 | 0.0116 |
| 3248 | HPGD | N_HPV_2 | Human | Cervix | N_HPV | 8.06e-04 | -3.95e-01 | -0.0131 |
| 3248 | HPGD | CCI_2 | Human | Cervix | CC | 1.34e-02 | -8.04e-01 | 0.5249 |
| 3248 | HPGD | CCI_3 | Human | Cervix | CC | 1.19e-02 | -7.33e-01 | 0.516 |
| 3248 | HPGD | CCII_1 | Human | Cervix | CC | 3.92e-10 | -8.46e-01 | 0.3249 |
| 3248 | HPGD | Tumor | Human | Cervix | CC | 5.62e-25 | -7.95e-01 | 0.1241 |
| 3248 | HPGD | sample1 | Human | Cervix | CC | 5.77e-09 | -8.57e-01 | 0.0959 |
| 3248 | HPGD | sample3 | Human | Cervix | CC | 1.75e-22 | -7.74e-01 | 0.1387 |
| 3248 | HPGD | H2 | Human | Cervix | HSIL_HPV | 1.62e-09 | -5.62e-01 | 0.0632 |
| 3248 | HPGD | T1 | Human | Cervix | CC | 1.45e-22 | -8.62e-01 | 0.0918 |
| 3248 | HPGD | T2 | Human | Cervix | CC | 6.79e-06 | -8.69e-01 | 0.0709 |
| 3248 | HPGD | T3 | Human | Cervix | CC | 4.92e-22 | -7.81e-01 | 0.1389 |
| 3248 | HPGD | HTA11_2487_2000001011 | Human | Colorectum | SER | 5.43e-05 | 4.89e-01 | -0.1808 |
| 3248 | HPGD | HTA11_347_2000001011 | Human | Colorectum | AD | 1.67e-12 | 4.94e-01 | -0.1954 |
| 3248 | HPGD | HTA11_411_2000001011 | Human | Colorectum | SER | 2.69e-02 | 9.12e-01 | -0.2602 |
| 3248 | HPGD | HTA11_2992_2000001011 | Human | Colorectum | SER | 1.90e-02 | 4.02e-01 | -0.1706 |
| 3248 | HPGD | HTA11_99999974143_84620 | Human | Colorectum | MSS | 9.65e-03 | -2.08e-01 | 0.3005 |
| 3248 | HPGD | A015-C-203 | Human | Colorectum | FAP | 4.51e-03 | -1.75e-01 | -0.1294 |
| Page: 1 2 3 4 |
| Tissue | Expression Dynamics | Abbreviation |
| Cervix |  | CC: Cervix cancer |
| HSIL_HPV: HPV-infected high-grade squamous intraepithelial lesions | ||
| N_HPV: HPV-infected normal cervix | ||
| Colorectum (GSE201348) |  | FAP: Familial adenomatous polyposis |
| CRC: Colorectal cancer | ||
| Colorectum (HTA11) |  | AD: Adenomas |
| SER: Sessile serrated lesions | ||
| MSI-H: Microsatellite-high colorectal cancer | ||
| MSS: Microsatellite stable colorectal cancer | ||
| Esophagus | 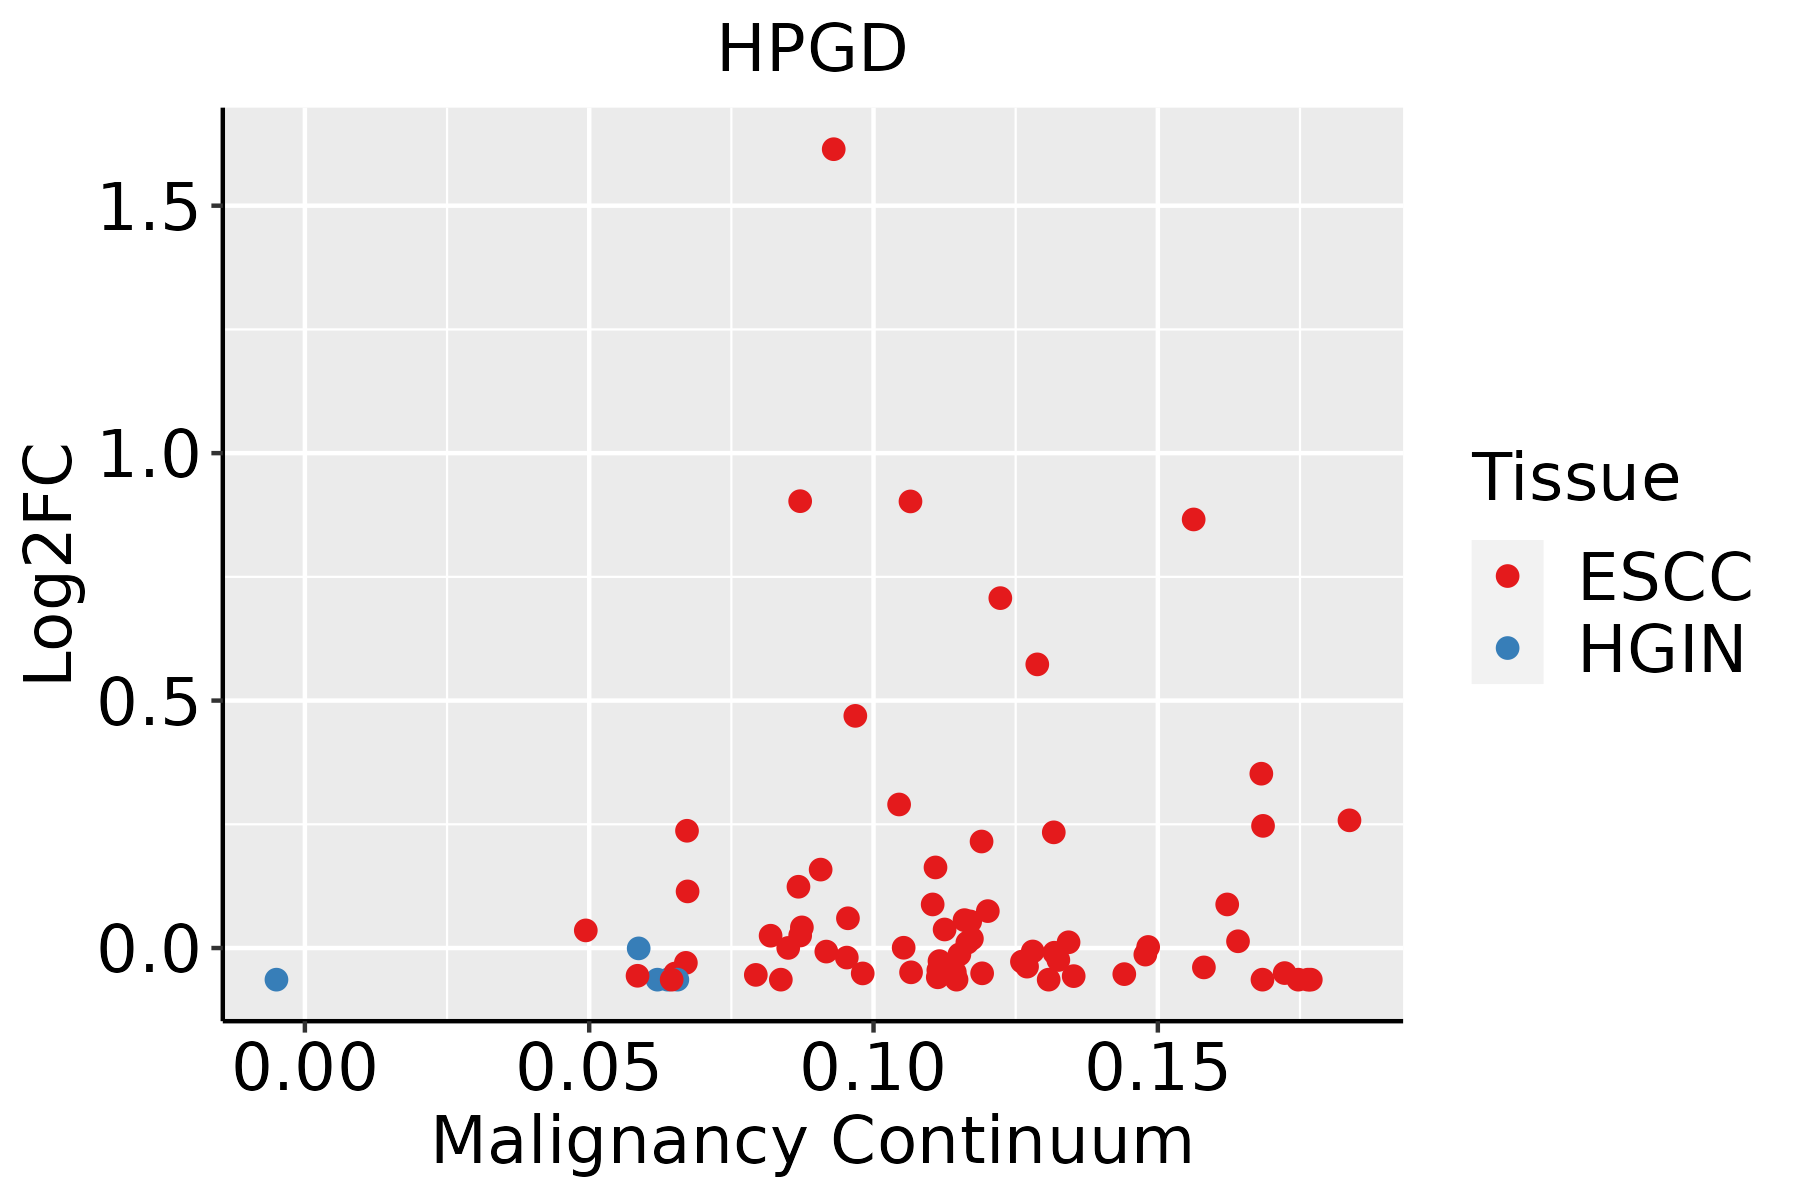 | ESCC: Esophageal squamous cell carcinoma |
| HGIN: High-grade intraepithelial neoplasias | ||
| LGIN: Low-grade intraepithelial neoplasias | ||
| GC | 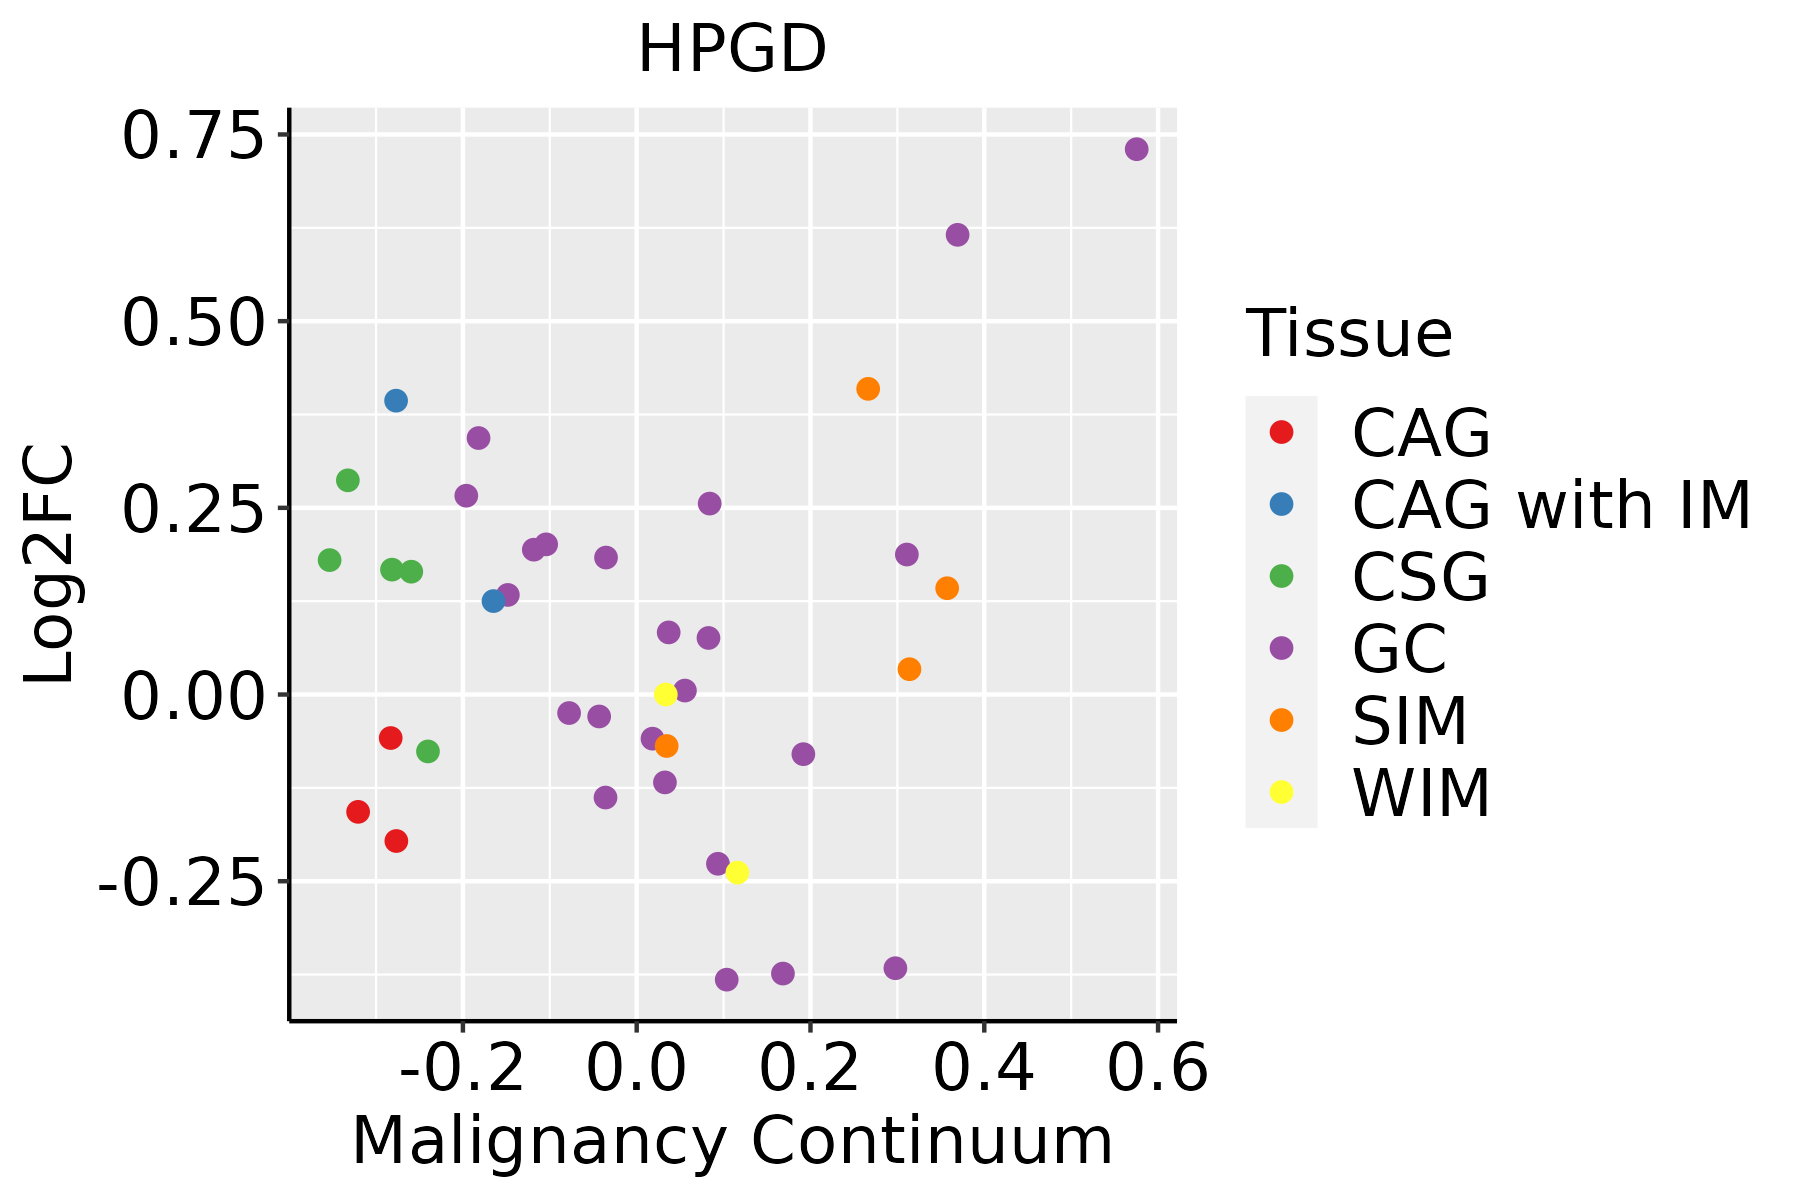 | CAG: Chronic atrophic gastritis |
| CAG with IM: Chronic atrophic gastritis with intestinal metaplasia | ||
| CSG: Chronic superficial gastritis | ||
| GC: Gastric cancer | ||
| SIM: Severe intestinal metaplasia | ||
| WIM: Wild intestinal metaplasia | ||
| Liver |  | HCC: Hepatocellular carcinoma |
| NAFLD: Non-alcoholic fatty liver disease | ||
| Oral Cavity | 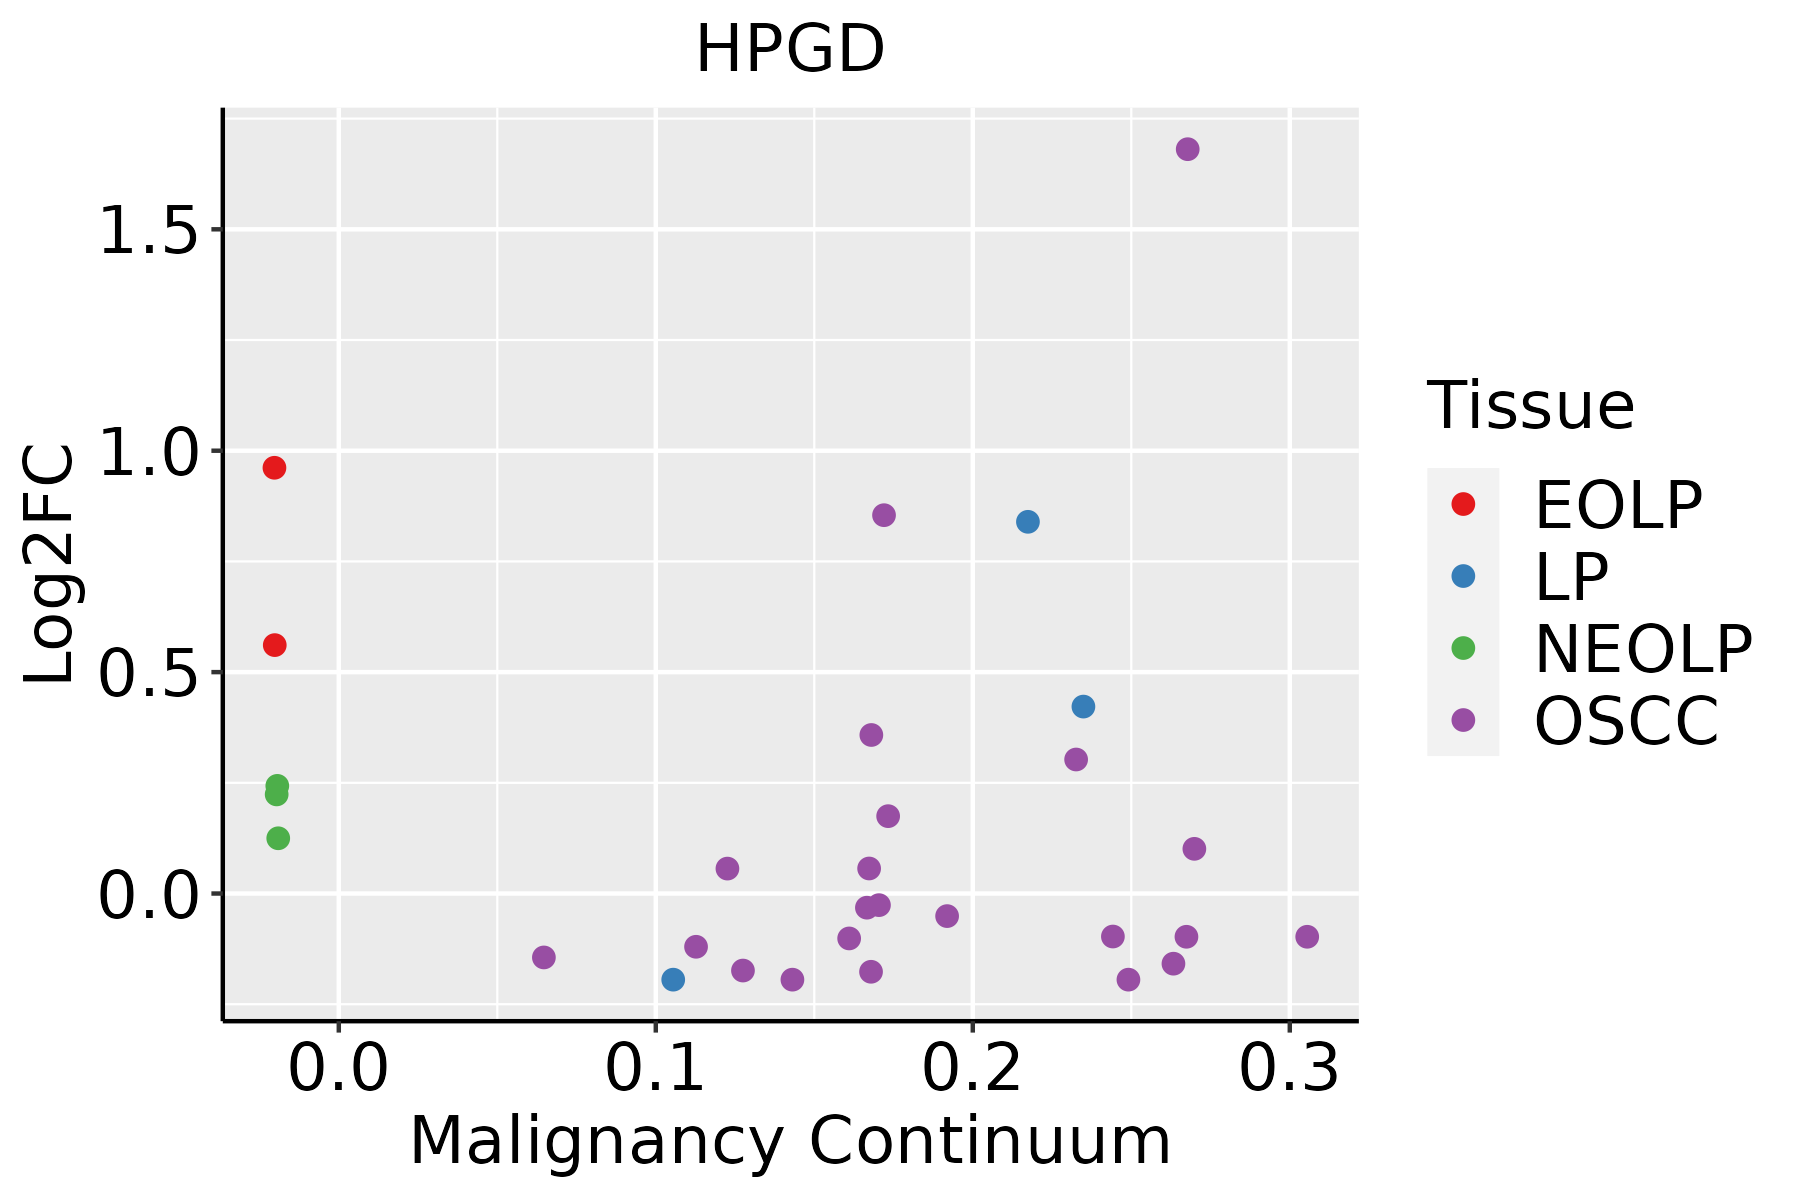 | EOLP: Erosive Oral lichen planus |
| LP: leukoplakia | ||
| NEOLP: Non-erosive oral lichen planus | ||
| OSCC: Oral squamous cell carcinoma |
| ∗log2FC in expression of this searched gene in stem-like cells from each diseased tissue sample relative to stem-like cells in normal samples in each tissue plotted against the malignancy continuum. Samples are colored based on if they are from different disease stage. |
Top |
Malignant transformation related pathway analysis |
| Find out the enriched GO biological processes and KEGG pathways involved in transition from healthy to precancer to cancer |
| Tissue | Disease Stage | Enriched GO biological Processes |
| Colorectum | AD |  |
| Colorectum | SER |  |
| Colorectum | MSS |  |
| Colorectum | MSI-H |  |
| Colorectum | FAP |  |
| ∗Top 15 enriched GO BP terms are showed in the bar plot of each disease state in each tissue. Each row represents a significant GO biological process which is colored according to the -log10(p.adjust). |
| Page: 1 2 3 4 5 6 7 8 9 |
| GO ID | Tissue | Disease Stage | Description | Gene Ratio | Bg Ratio | pvalue | p.adjust | Count |
| GO:0048660 | Colorectum | MSS | regulation of smooth muscle cell proliferation | 48/3467 | 180/18723 | 4.32e-03 | 3.07e-02 | 48 |
| GO:0048661 | Colorectum | MSS | positive regulation of smooth muscle cell proliferation | 30/3467 | 104/18723 | 6.69e-03 | 4.38e-02 | 30 |
| GO:0001655 | Colorectum | MSS | urogenital system development | 81/3467 | 338/18723 | 6.88e-03 | 4.43e-02 | 81 |
| GO:00715591 | Colorectum | FAP | response to transforming growth factor beta | 63/2622 | 256/18723 | 3.82e-06 | 1.32e-04 | 63 |
| GO:00071782 | Colorectum | FAP | transmembrane receptor protein serine/threonine kinase signaling pathway | 81/2622 | 355/18723 | 4.28e-06 | 1.46e-04 | 81 |
| GO:00715601 | Colorectum | FAP | cellular response to transforming growth factor beta stimulus | 61/2622 | 250/18723 | 7.22e-06 | 2.19e-04 | 61 |
| GO:00071791 | Colorectum | FAP | transforming growth factor beta receptor signaling pathway | 50/2622 | 198/18723 | 1.75e-05 | 4.44e-04 | 50 |
| GO:00066313 | Colorectum | FAP | fatty acid metabolic process | 81/2622 | 390/18723 | 1.43e-04 | 2.24e-03 | 81 |
| GO:00016551 | Colorectum | FAP | urogenital system development | 70/2622 | 338/18723 | 4.26e-04 | 5.11e-03 | 70 |
| GO:00973053 | Colorectum | FAP | response to alcohol | 55/2622 | 253/18723 | 5.05e-04 | 5.78e-03 | 55 |
| GO:0072001 | Colorectum | FAP | renal system development | 63/2622 | 302/18723 | 6.59e-04 | 7.19e-03 | 63 |
| GO:0001822 | Colorectum | FAP | kidney development | 61/2622 | 293/18723 | 8.38e-04 | 8.72e-03 | 61 |
| GO:00486601 | Colorectum | FAP | regulation of smooth muscle cell proliferation | 38/2622 | 180/18723 | 5.73e-03 | 3.67e-02 | 38 |
| GO:00486591 | Colorectum | FAP | smooth muscle cell proliferation | 38/2622 | 184/18723 | 8.29e-03 | 4.85e-02 | 38 |
| GO:00071783 | Colorectum | CRC | transmembrane receptor protein serine/threonine kinase signaling pathway | 66/2078 | 355/18723 | 1.74e-05 | 5.28e-04 | 66 |
| GO:00715592 | Colorectum | CRC | response to transforming growth factor beta | 51/2078 | 256/18723 | 2.33e-05 | 6.65e-04 | 51 |
| GO:00016552 | Colorectum | CRC | urogenital system development | 62/2078 | 338/18723 | 4.67e-05 | 1.10e-03 | 62 |
| GO:00715602 | Colorectum | CRC | cellular response to transforming growth factor beta stimulus | 49/2078 | 250/18723 | 5.17e-05 | 1.19e-03 | 49 |
| GO:00720011 | Colorectum | CRC | renal system development | 56/2078 | 302/18723 | 7.85e-05 | 1.63e-03 | 56 |
| GO:00018221 | Colorectum | CRC | kidney development | 54/2078 | 293/18723 | 1.23e-04 | 2.40e-03 | 54 |
| Page: 1 2 3 4 5 6 7 8 9 10 |
| Pathway ID | Tissue | Disease Stage | Description | Gene Ratio | Bg Ratio | pvalue | p.adjust | qvalue | Count |
| hsa05202 | Colorectum | FAP | Transcriptional misregulation in cancer | 45/1404 | 193/8465 | 9.19e-03 | 3.33e-02 | 2.03e-02 | 45 |
| hsa052021 | Colorectum | FAP | Transcriptional misregulation in cancer | 45/1404 | 193/8465 | 9.19e-03 | 3.33e-02 | 2.03e-02 | 45 |
| hsa052028 | Esophagus | ESCC | Transcriptional misregulation in cancer | 116/4205 | 193/8465 | 2.08e-03 | 5.95e-03 | 3.05e-03 | 116 |
| hsa0520213 | Esophagus | ESCC | Transcriptional misregulation in cancer | 116/4205 | 193/8465 | 2.08e-03 | 5.95e-03 | 3.05e-03 | 116 |
| Page: 1 |
Top |
Cell-cell communication analysis |
| Identification of potential cell-cell interactions between two cell types and their ligand-receptor pairs for different disease states |
| Ligand | Receptor | LRpair | Pathway | Tissue | Disease Stage |
| Page: 1 |
Top |
Single-cell gene regulatory network inference analysis |
| Find out the significant the regulons (TFs) and the target genes of each regulon across cell types for different disease states |
| TF | Cell Type | Tissue | Disease Stage | Target Gene | RSS | Regulon Activity |
| ∗The dot plots of a searched regulon are shown for all cell subpopulations in each disease state of each tissue based on the regulon specific score inferred using pySCENIC and by calculating the average expression. |
| Page: 1 |
Top |
Somatic mutation of malignant transformation related genes |
| Annotation of somatic variants for genes involved in malignant transformation |
| Hugo Symbol | Variant Class | Variant Classification | dbSNP RS | HGVSc | HGVSp | HGVSp Short | SWISSPROT | BIOTYPE | SIFT | PolyPhen | Tumor Sample Barcode | Tissue | Histology | Sex | Age | Stage | Therapy Types | Drugs | Outcome |
| HPGD | SNV | Missense_Mutation | c.418N>T | p.Ala140Ser | p.A140S | P15428 | protein_coding | deleterious(0.03) | probably_damaging(0.957) | TCGA-AR-A0TS-01 | Breast | breast invasive carcinoma | Female | <65 | I/II | Chemotherapy | doxorubicin | SD | |
| HPGD | SNV | Missense_Mutation | c.291N>T | p.Glu97Asp | p.E97D | P15428 | protein_coding | deleterious(0) | probably_damaging(0.916) | TCGA-FU-A3HZ-01 | Cervix | cervical & endocervical cancer | Female | <65 | I/II | Chemotherapy | cisplatin | CR | |
| HPGD | SNV | Missense_Mutation | c.769N>C | p.Asp257His | p.D257H | P15428 | protein_coding | tolerated(0.09) | benign(0.121) | TCGA-JX-A3Q0-01 | Cervix | cervical & endocervical cancer | Female | <65 | III/IV | Unknown | Unknown | SD | |
| HPGD | SNV | Missense_Mutation | c.788N>G | p.Ala263Gly | p.A263G | P15428 | protein_coding | tolerated_low_confidence(0.18) | benign(0.003) | TCGA-AZ-6605-01 | Colorectum | colon adenocarcinoma | Male | >=65 | III/IV | Chemotherapy | folfox | SD | |
| HPGD | insertion | Frame_Shift_Ins | novel | c.111_112insC | p.Asn38GlnfsTer3 | p.N38Qfs*3 | P15428 | protein_coding | TCGA-AA-3821-01 | Colorectum | colon adenocarcinoma | Female | >=65 | I/II | Unknown | Unknown | SD | ||
| HPGD | insertion | Frame_Shift_Ins | novel | c.109dupT | p.Trp37LeufsTer4 | p.W37Lfs*4 | P15428 | protein_coding | TCGA-AA-3821-01 | Colorectum | colon adenocarcinoma | Female | >=65 | I/II | Unknown | Unknown | SD | ||
| HPGD | SNV | Missense_Mutation | novel | c.688N>G | p.Ile230Val | p.I230V | P15428 | protein_coding | deleterious(0.02) | benign(0.05) | TCGA-A5-A1OF-01 | Endometrium | uterine corpus endometrioid carcinoma | Female | <65 | I/II | Unknown | Unknown | SD |
| HPGD | SNV | Missense_Mutation | c.694N>T | p.Leu232Phe | p.L232F | P15428 | protein_coding | deleterious(0.01) | possibly_damaging(0.862) | TCGA-AP-A059-01 | Endometrium | uterine corpus endometrioid carcinoma | Female | >=65 | I/II | Unknown | Unknown | SD | |
| HPGD | SNV | Missense_Mutation | novel | c.221N>A | p.Thr74Asn | p.T74N | P15428 | protein_coding | deleterious(0) | possibly_damaging(0.711) | TCGA-AX-A2HC-01 | Endometrium | uterine corpus endometrioid carcinoma | Female | <65 | III/IV | Chemotherapy | paclitaxel | PD |
| HPGD | SNV | Missense_Mutation | novel | c.457G>A | p.Ala153Thr | p.A153T | P15428 | protein_coding | deleterious(0) | probably_damaging(0.973) | TCGA-AX-A2HG-01 | Endometrium | uterine corpus endometrioid carcinoma | Female | <65 | I/II | Unknown | Unknown | SD |
| Page: 1 2 3 4 |
Top |
Related drugs of malignant transformation related genes |
| Identification of chemicals and drugs interact with genes involved in malignant transfromation |
| (DGIdb 4.0) |
| Entrez ID | Symbol | Category | Interaction Types | Drug Claim Name | Drug Name | PMIDs |
| 3248 | HPGD | DRUGGABLE GENOME, ENZYME, SHORT CHAIN DEHYDROGENASE REDUCTASE | SJ000019194 | CHEMBL592106 | ||
| 3248 | HPGD | DRUGGABLE GENOME, ENZYME, SHORT CHAIN DEHYDROGENASE REDUCTASE | 4-CHLOROMERCURIBENZOIC ACID | 4-CHLOROMERCURIBENZOIC ACID | ||
| 3248 | HPGD | DRUGGABLE GENOME, ENZYME, SHORT CHAIN DEHYDROGENASE REDUCTASE | SJ000147993 | CHEMBL601618 | ||
| 3248 | HPGD | DRUGGABLE GENOME, ENZYME, SHORT CHAIN DEHYDROGENASE REDUCTASE | LY-255283 | LY-255283 | ||
| 3248 | HPGD | DRUGGABLE GENOME, ENZYME, SHORT CHAIN DEHYDROGENASE REDUCTASE | NSC-209931 | CHEMBL472656 | ||
| 3248 | HPGD | DRUGGABLE GENOME, ENZYME, SHORT CHAIN DEHYDROGENASE REDUCTASE | TYRPHOSTIN 47 | TYRPHOSTIN 47 | ||
| 3248 | HPGD | DRUGGABLE GENOME, ENZYME, SHORT CHAIN DEHYDROGENASE REDUCTASE | ALLITRIDIN | ALLITRIDIN | ||
| 3248 | HPGD | DRUGGABLE GENOME, ENZYME, SHORT CHAIN DEHYDROGENASE REDUCTASE | HAEMATOXYLIN | HAEMATOXYLIN | ||
| 3248 | HPGD | DRUGGABLE GENOME, ENZYME, SHORT CHAIN DEHYDROGENASE REDUCTASE | LUTEOLIN | LUTEOLIN | ||
| 3248 | HPGD | DRUGGABLE GENOME, ENZYME, SHORT CHAIN DEHYDROGENASE REDUCTASE | DICHLOROPHEN | DICHLOROPHEN |
| Page: 1 2 3 4 5 6 7 8 9 10 11 12 13 14 15 16 17 18 19 20 21 22 23 24 25 |

Copyright 2023-Present -The University of Texas Health Science Center at Houston |