Schematic overview of the cellular and molecular mechanisms involved in the cancer progression, including the proposed cellular and molecular mechanisms in cancer cells trajectory. AT1: alveolar type 1 cells; AT2: alveolar type 2 cells; AAH: atypical adenomatous hyperplasia; AIS: adenocarcinoma in situ; MIA: minimally invasive adenocarcinoma; IA: invasive adenocarcinoma; EMT: epithelial-mesenchymal transition

Home

Download

Statistics

Help

Contact

Center for Computational Systems Medicine
leaf

Gene summary

leaf

Malignant transformation analysis

leaf

Malignant transformation related pathway analysis

leaf

Cell-cell communication analysis

leaf

Single-cell gene regulatory network inference analysis

leaf

Somatic mutation of malignant transformation related genes

leaf

Related drugs of malignant transformation related genes

Gene: HNRNPL

Gene summary for HNRNPL

check button Gene summary.

Gene informationSpeciesHuman
Gene symbol

HNRNPL

Gene ID

3191

Gene nameheterogeneous nuclear ribonucleoprotein L
Gene AliasHNRPL
Cytomap19q13.2
Gene Typeprotein-coding
GO ID

GO:0000375

UniProtAcc

P14866


Top

Malignant transformation analysis

check button Identification of the aberrant gene expression in precancerous and cancerous lesions by comparing the gene expression of stem-like cells in diseased tissues with normal stem cells
check button Malignant transformation involving gene list.
Entrez IDSymbolReplicatesSpeciesOrganTissueAdj P-valueLog2FCMalignancy
3191HNRNPLHTA11_3410_2000001011HumanColorectumAD2.67e-051.21e-010.0155
3191HNRNPLHTA11_1938_2000001011HumanColorectumAD2.48e-056.22e-01-0.0811
3191HNRNPLHTA11_347_2000001011HumanColorectumAD2.52e-095.07e-01-0.1954
3191HNRNPLHTA11_696_2000001011HumanColorectumAD3.21e-043.67e-01-0.1464
3191HNRNPLHTA11_866_2000001011HumanColorectumAD2.41e-023.04e-01-0.1001
3191HNRNPLHTA11_1391_2000001011HumanColorectumAD2.89e-055.12e-01-0.059
3191HNRNPLHTA11_866_3004761011HumanColorectumAD5.08e-147.36e-010.096
3191HNRNPLHTA11_7663_2000001011HumanColorectumSER2.73e-047.05e-010.0131
3191HNRNPLHTA11_10623_2000001011HumanColorectumAD4.99e-034.78e-01-0.0177
3191HNRNPLHTA11_7696_3000711011HumanColorectumAD1.83e-228.20e-010.0674
3191HNRNPLHTA11_6818_2000001021HumanColorectumAD1.48e-086.18e-010.0588
3191HNRNPLHTA11_99999970781_79442HumanColorectumMSS1.28e-146.11e-010.294
3191HNRNPLHTA11_99999965062_69753HumanColorectumMSI-H1.03e-071.31e+000.3487
3191HNRNPLHTA11_99999965104_69814HumanColorectumMSS1.24e-055.70e-010.281
3191HNRNPLHTA11_99999971662_82457HumanColorectumMSS6.74e-115.98e-010.3859
3191HNRNPLA015-C-203HumanColorectumFAP8.00e-06-2.86e-02-0.1294
3191HNRNPLA001-C-108HumanColorectumFAP3.99e-02-9.42e-02-0.0272
3191HNRNPLA002-C-205HumanColorectumFAP1.56e-05-1.84e-01-0.1236
3191HNRNPLA015-C-006HumanColorectumFAP9.32e-04-7.52e-02-0.0994
3191HNRNPLA002-C-114HumanColorectumFAP5.29e-06-2.32e-01-0.1561
Page: 1 2 3 4 5 6 7 8 9 

check button Transcriptomic changes along malignancy continuum.
TissueExpression DynamicsAbbreviation
Colorectum (GSE201348)The image shows the transcriptomic changes along malignancy continuum.log2FC in expression of this searched gene in stem-like cells from each diseased tissue sample relative to stem-like cells in normal samples in each tissue plotted against the malignancy continuum. Samples are colored based on if they are from different disease stage.FAP: Familial adenomatous polyposis
CRC: Colorectal cancer
Colorectum (HTA11)The image shows the transcriptomic changes along malignancy continuum.log2FC in expression of this searched gene in stem-like cells from each diseased tissue sample relative to stem-like cells in normal samples in each tissue plotted against the malignancy continuum. Samples are colored based on if they are from different disease stage.AD: Adenomas
SER: Sessile serrated lesions
MSI-H: Microsatellite-high colorectal cancer
MSS: Microsatellite stable colorectal cancer
EndometriumThe image shows the transcriptomic changes along malignancy continuum.log2FC in expression of this searched gene in stem-like cells from each diseased tissue sample relative to stem-like cells in normal samples in each tissue plotted against the malignancy continuum. Samples are colored based on if they are from different disease stage.
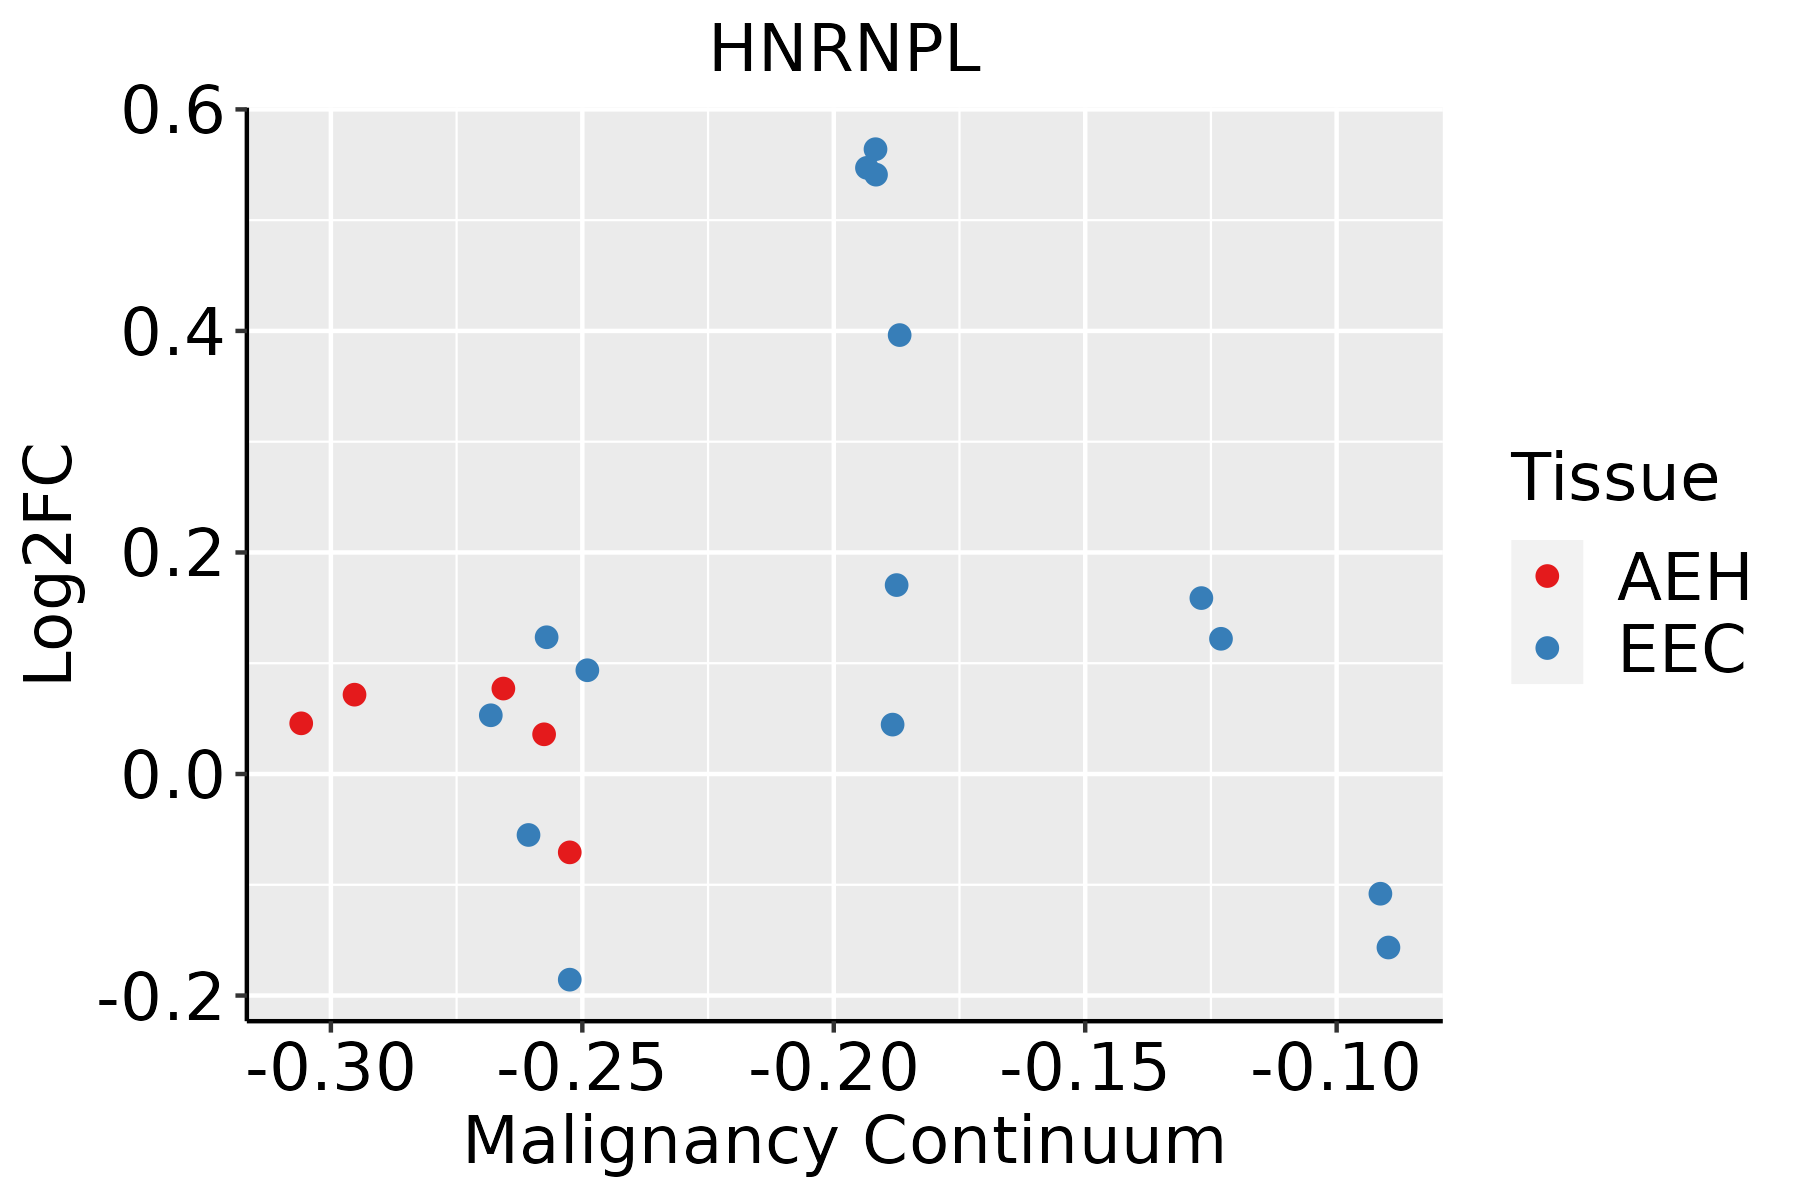
AEH: Atypical endometrial hyperplasia
EEC: Endometrioid Cancer
EsophagusThe image shows the transcriptomic changes along malignancy continuum.log2FC in expression of this searched gene in stem-like cells from each diseased tissue sample relative to stem-like cells in normal samples in each tissue plotted against the malignancy continuum. Samples are colored based on if they are from different disease stage.
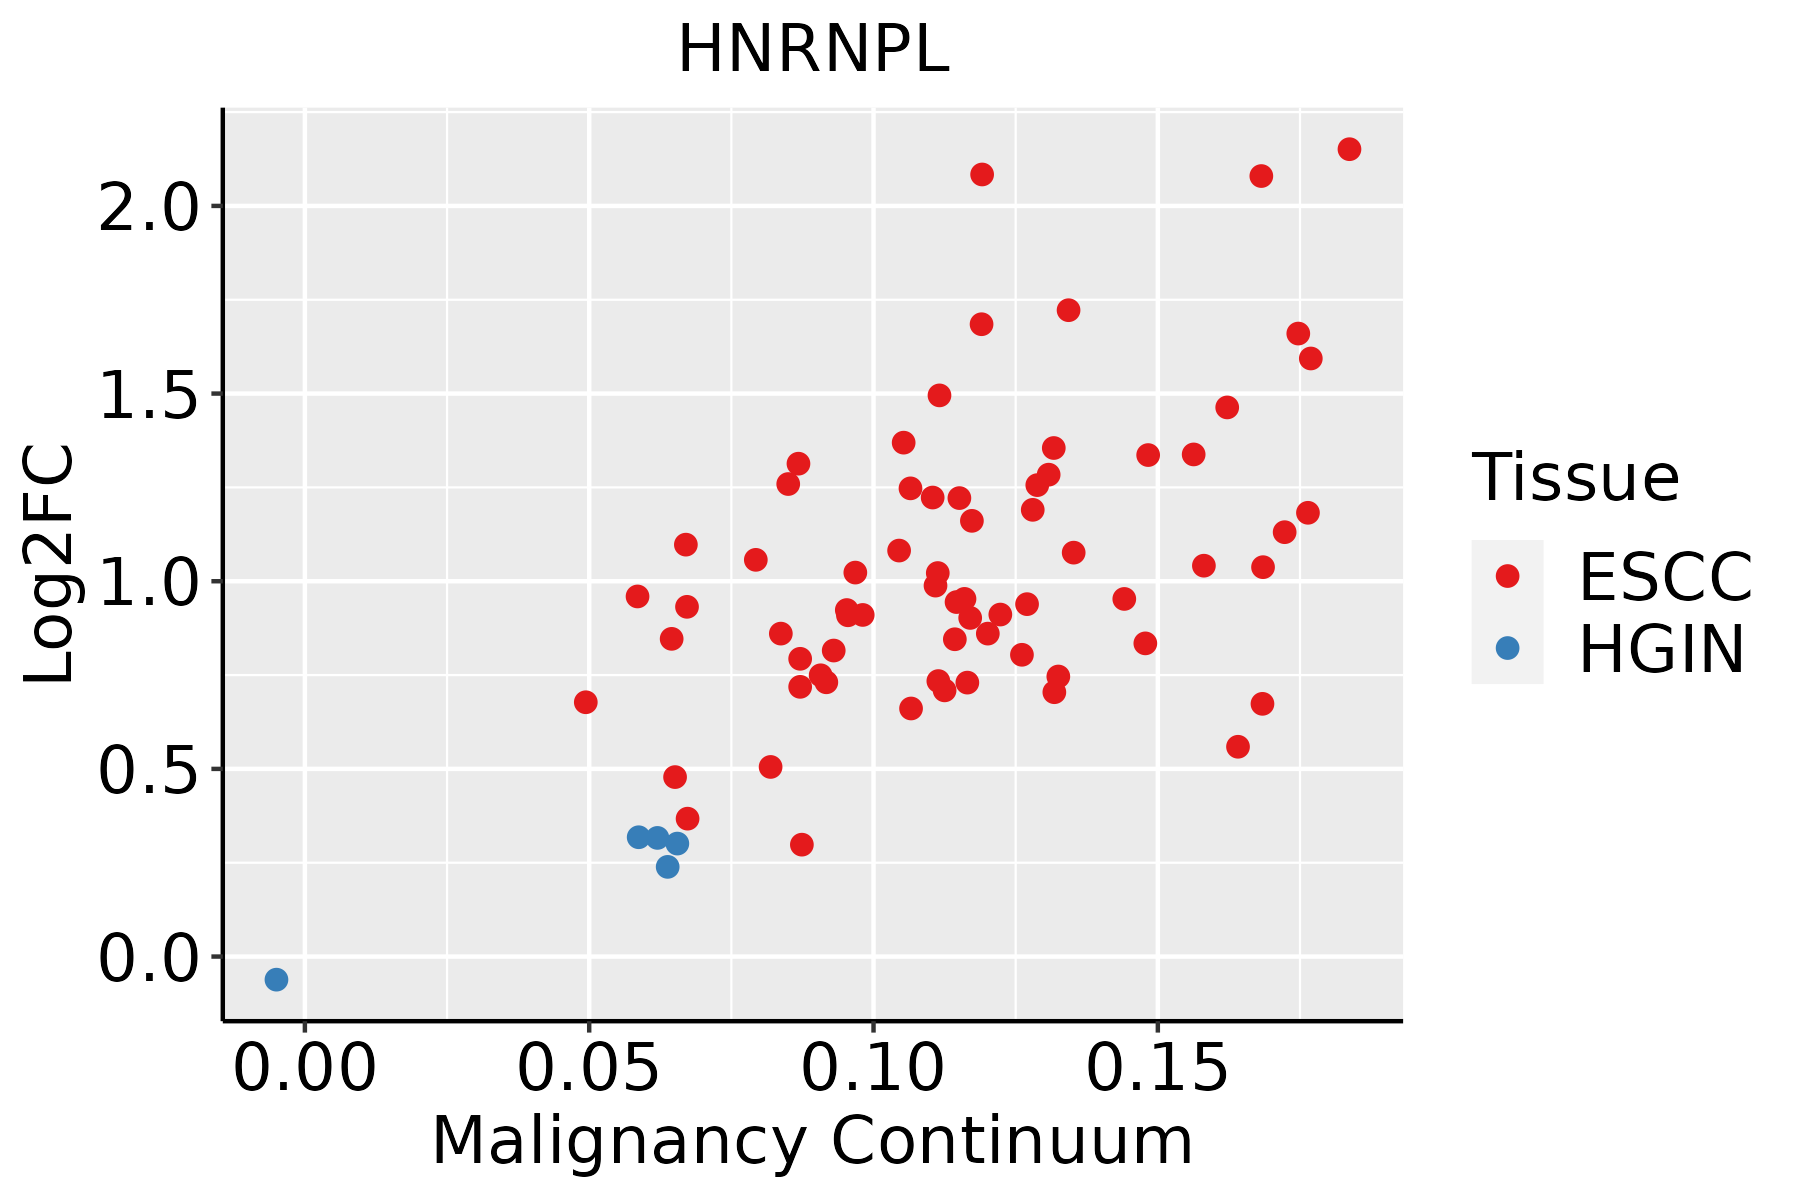
ESCC: Esophageal squamous cell carcinoma
HGIN: High-grade intraepithelial neoplasias
LGIN: Low-grade intraepithelial neoplasias
LiverThe image shows the transcriptomic changes along malignancy continuum.log2FC in expression of this searched gene in stem-like cells from each diseased tissue sample relative to stem-like cells in normal samples in each tissue plotted against the malignancy continuum. Samples are colored based on if they are from different disease stage.
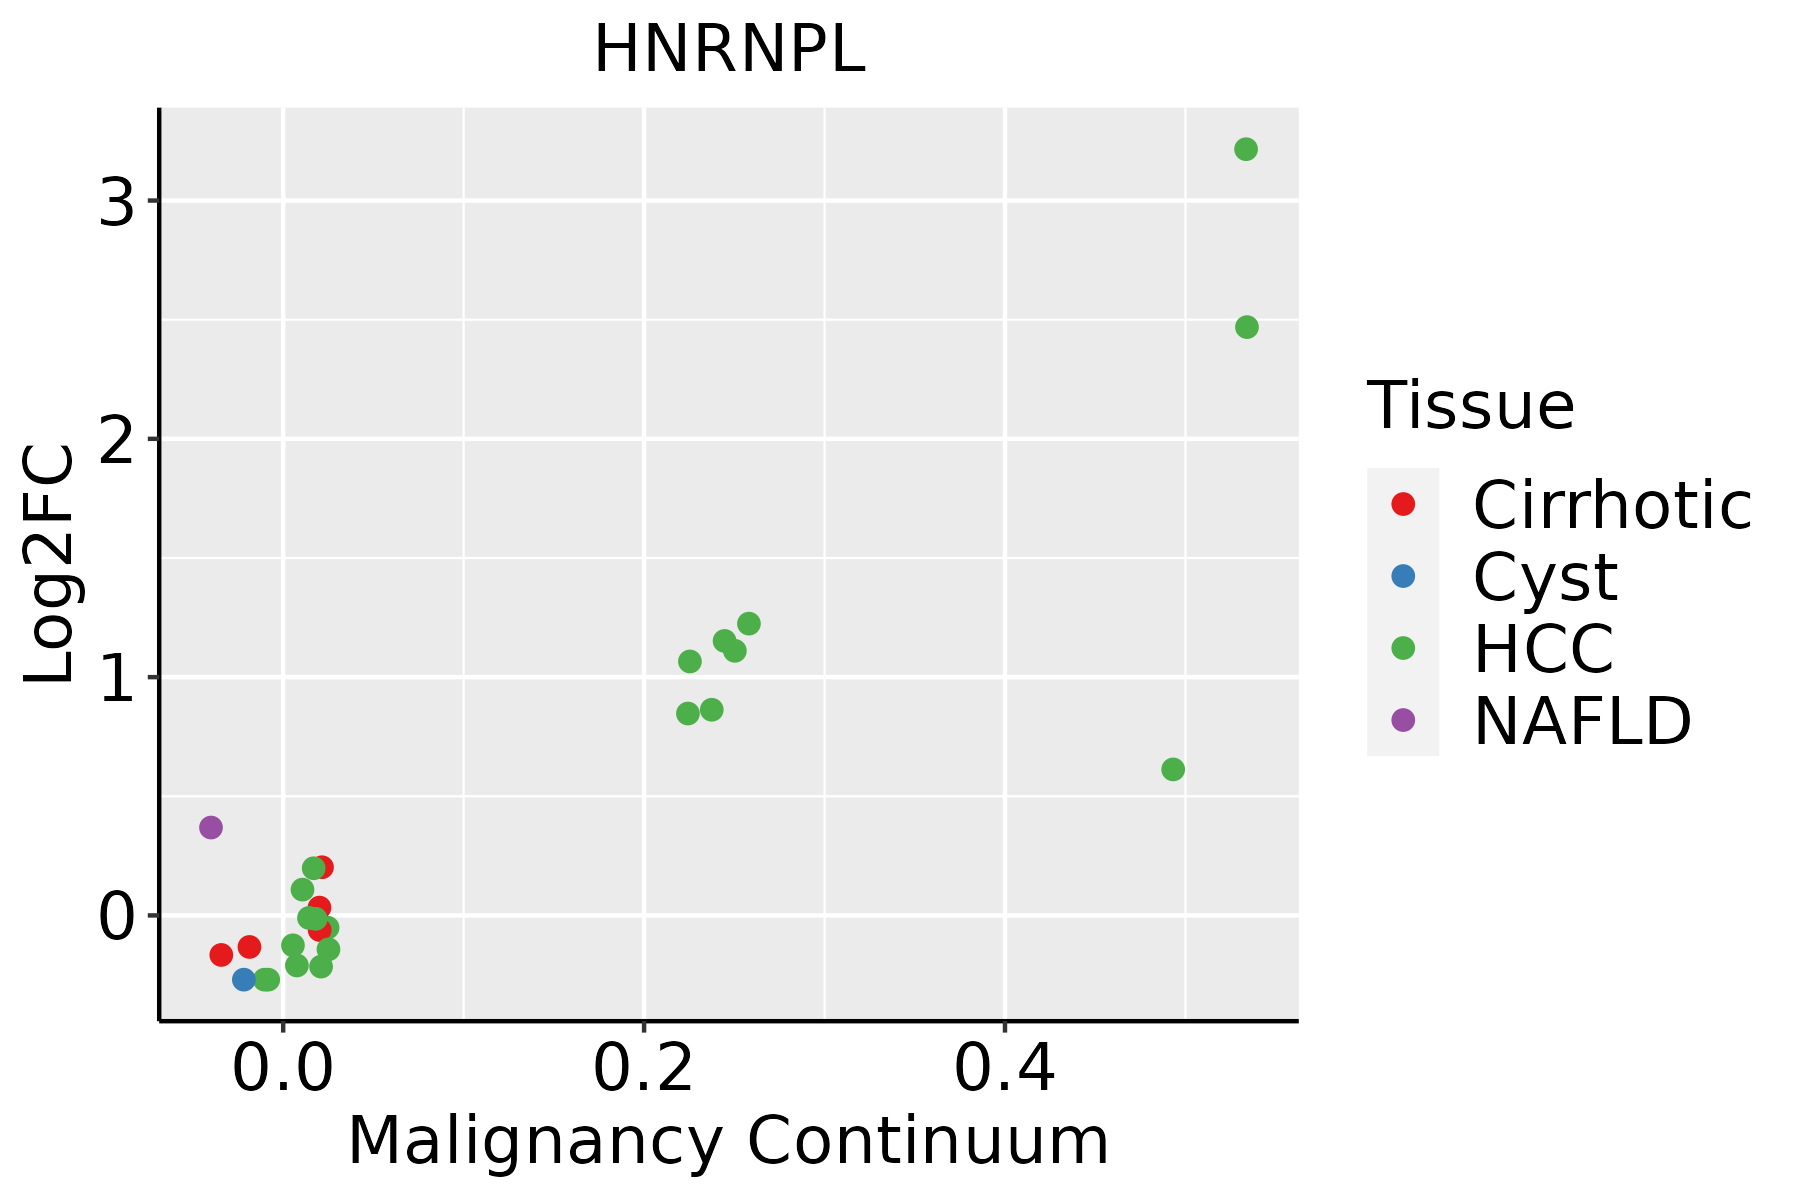
HCC: Hepatocellular carcinoma
NAFLD: Non-alcoholic fatty liver disease
Oral CavityThe image shows the transcriptomic changes along malignancy continuum.log2FC in expression of this searched gene in stem-like cells from each diseased tissue sample relative to stem-like cells in normal samples in each tissue plotted against the malignancy continuum. Samples are colored based on if they are from different disease stage.
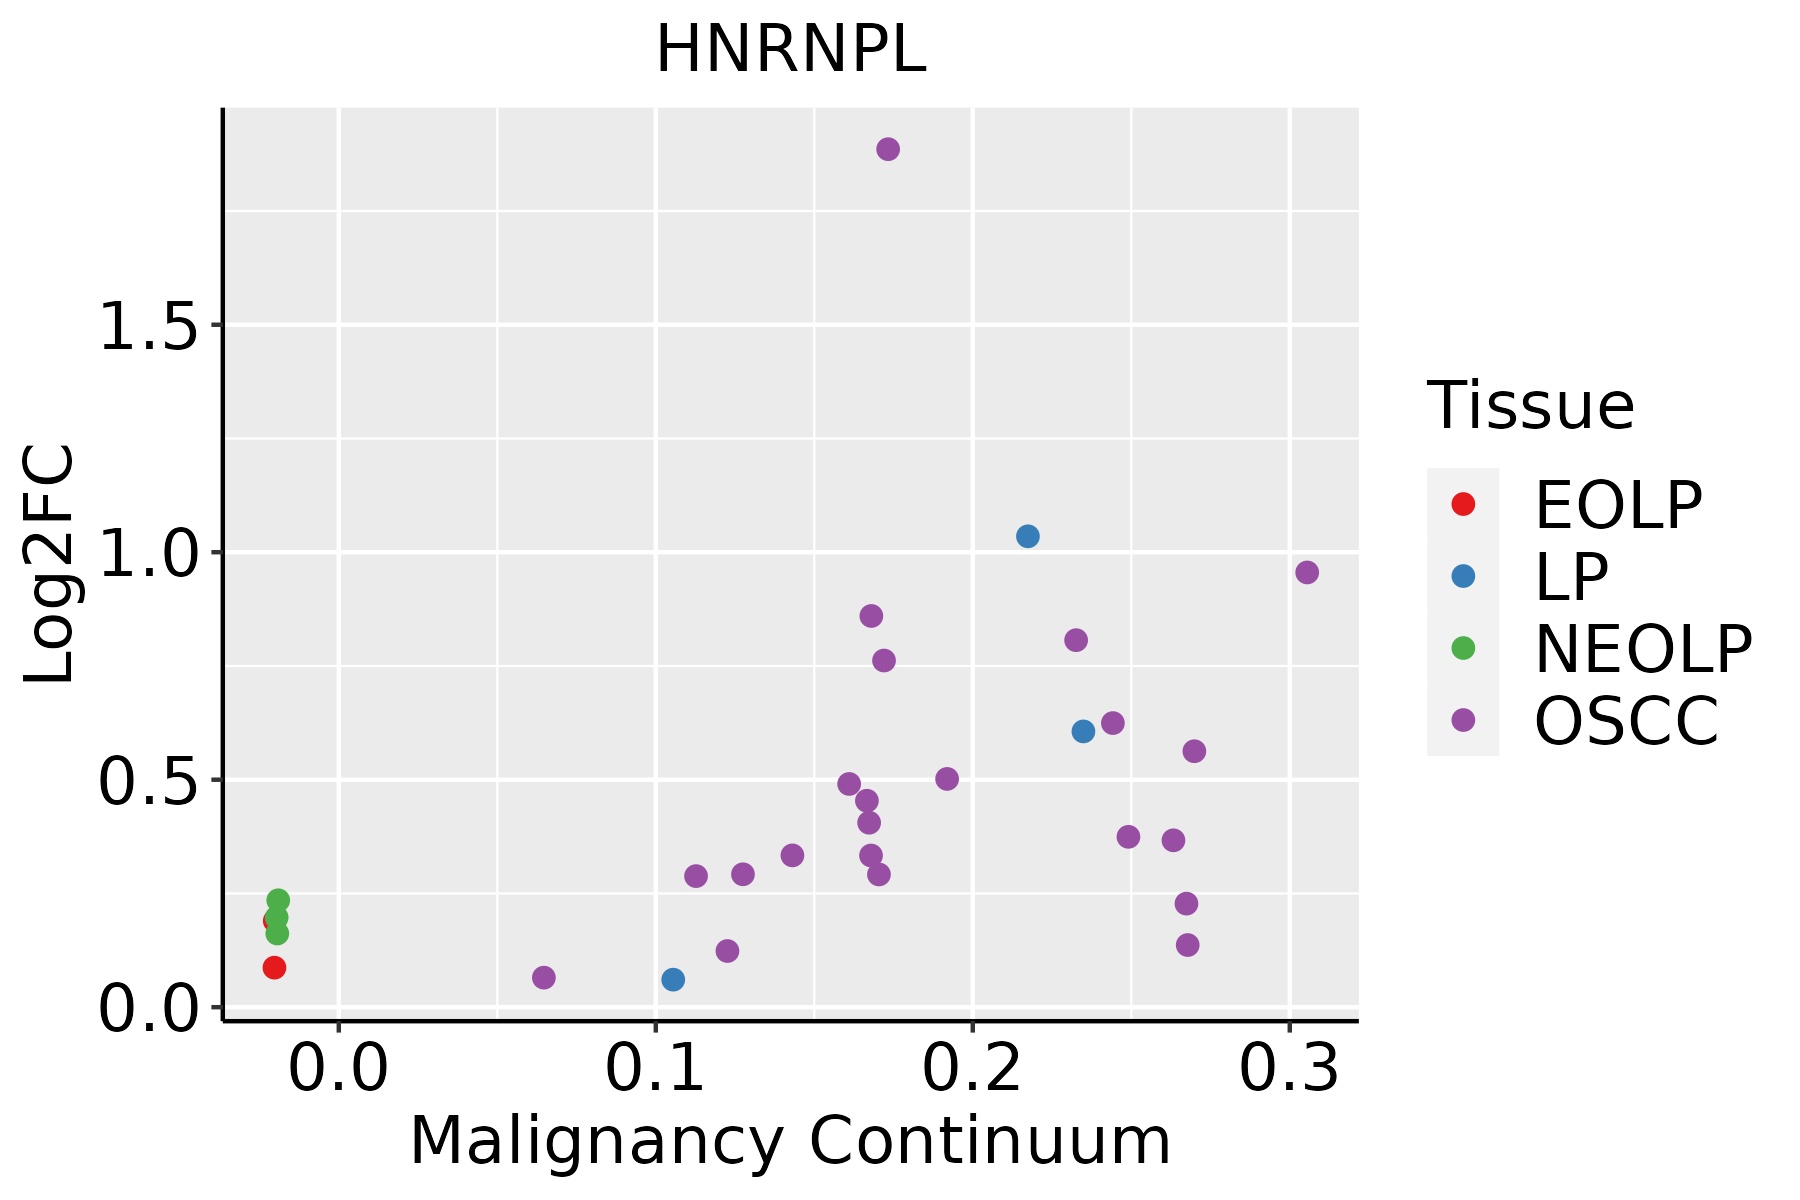
EOLP: Erosive Oral lichen planus
LP: leukoplakia
NEOLP: Non-erosive oral lichen planus
OSCC: Oral squamous cell carcinoma
SkinThe image shows the transcriptomic changes along malignancy continuum.log2FC in expression of this searched gene in stem-like cells from each diseased tissue sample relative to stem-like cells in normal samples in each tissue plotted against the malignancy continuum. Samples are colored based on if they are from different disease stage.
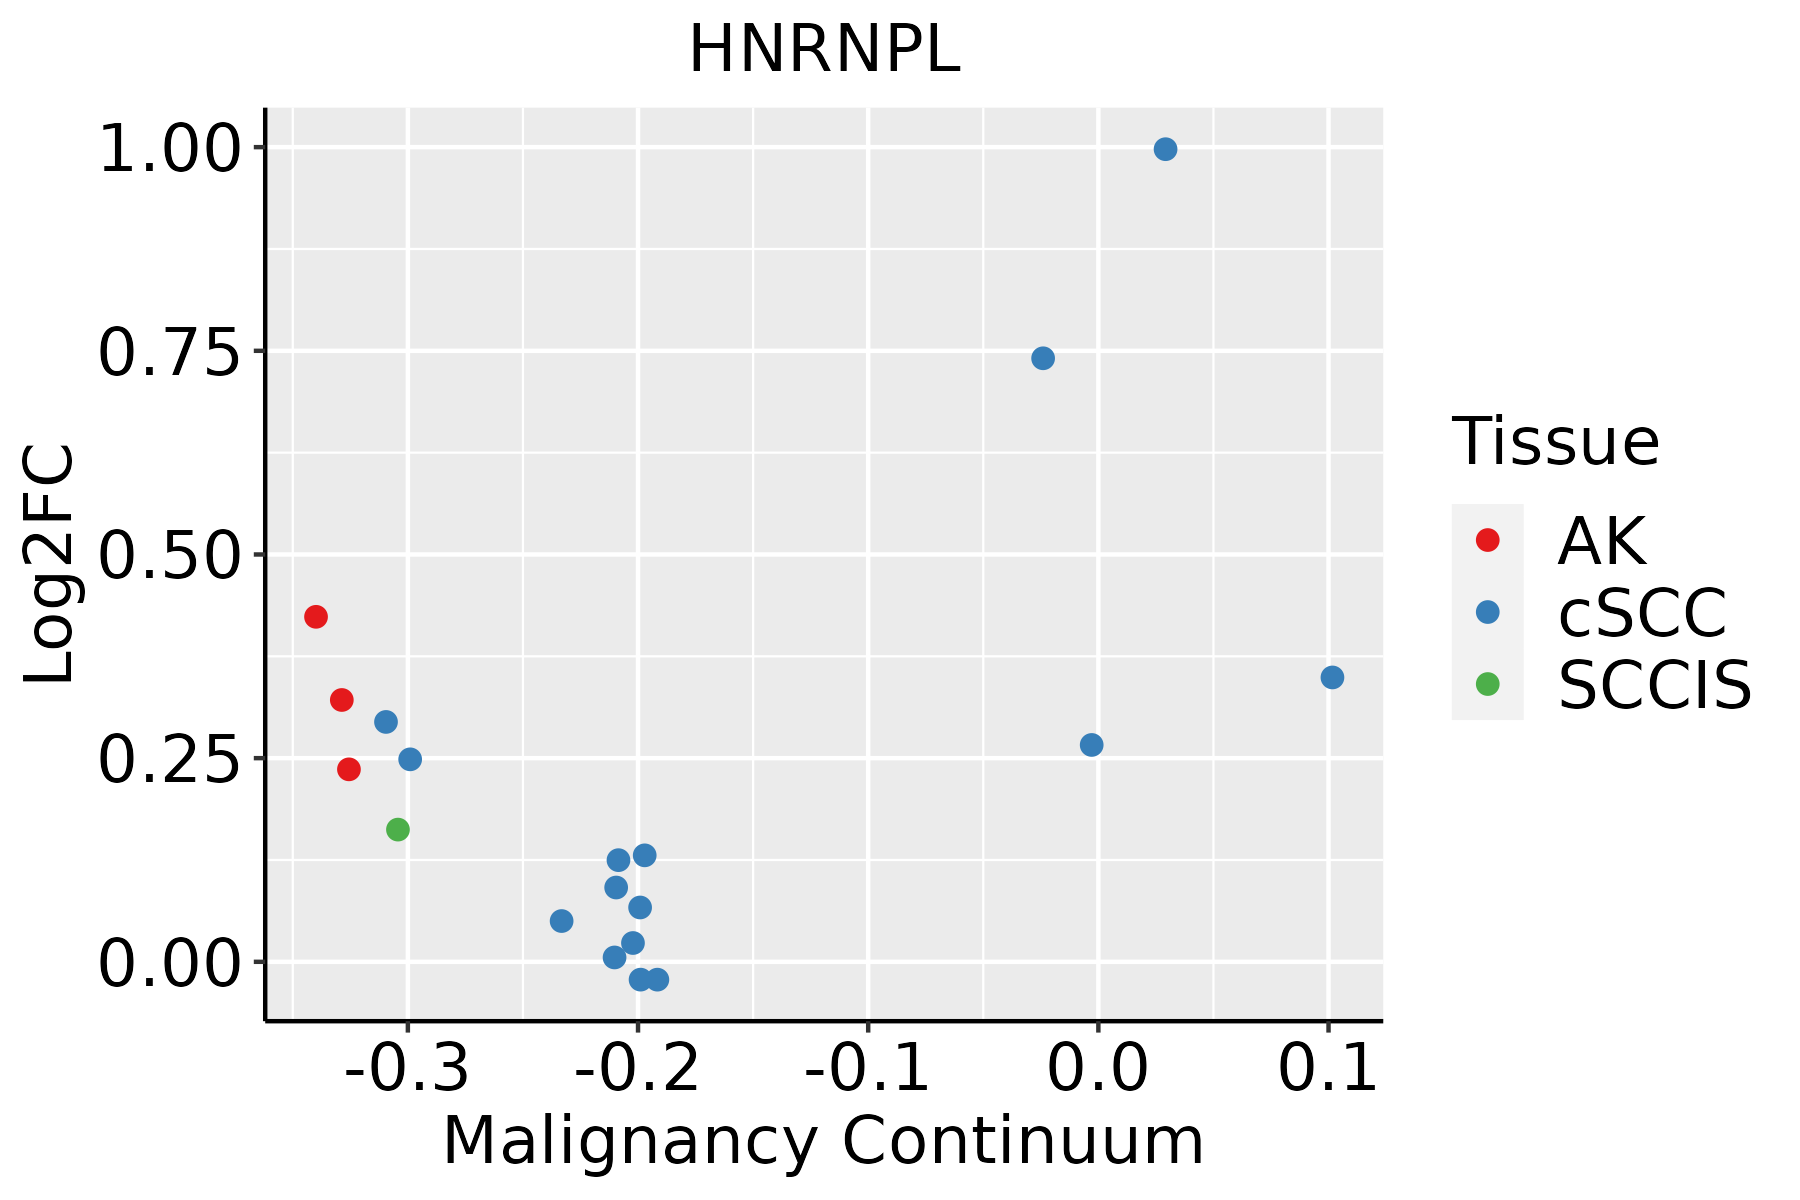
AK: Actinic keratosis
cSCC: Cutaneous squamous cell carcinoma
SCCIS:squamous cell carcinoma in situ
ThyroidThe image shows the transcriptomic changes along malignancy continuum.log2FC in expression of this searched gene in stem-like cells from each diseased tissue sample relative to stem-like cells in normal samples in each tissue plotted against the malignancy continuum. Samples are colored based on if they are from different disease stage.
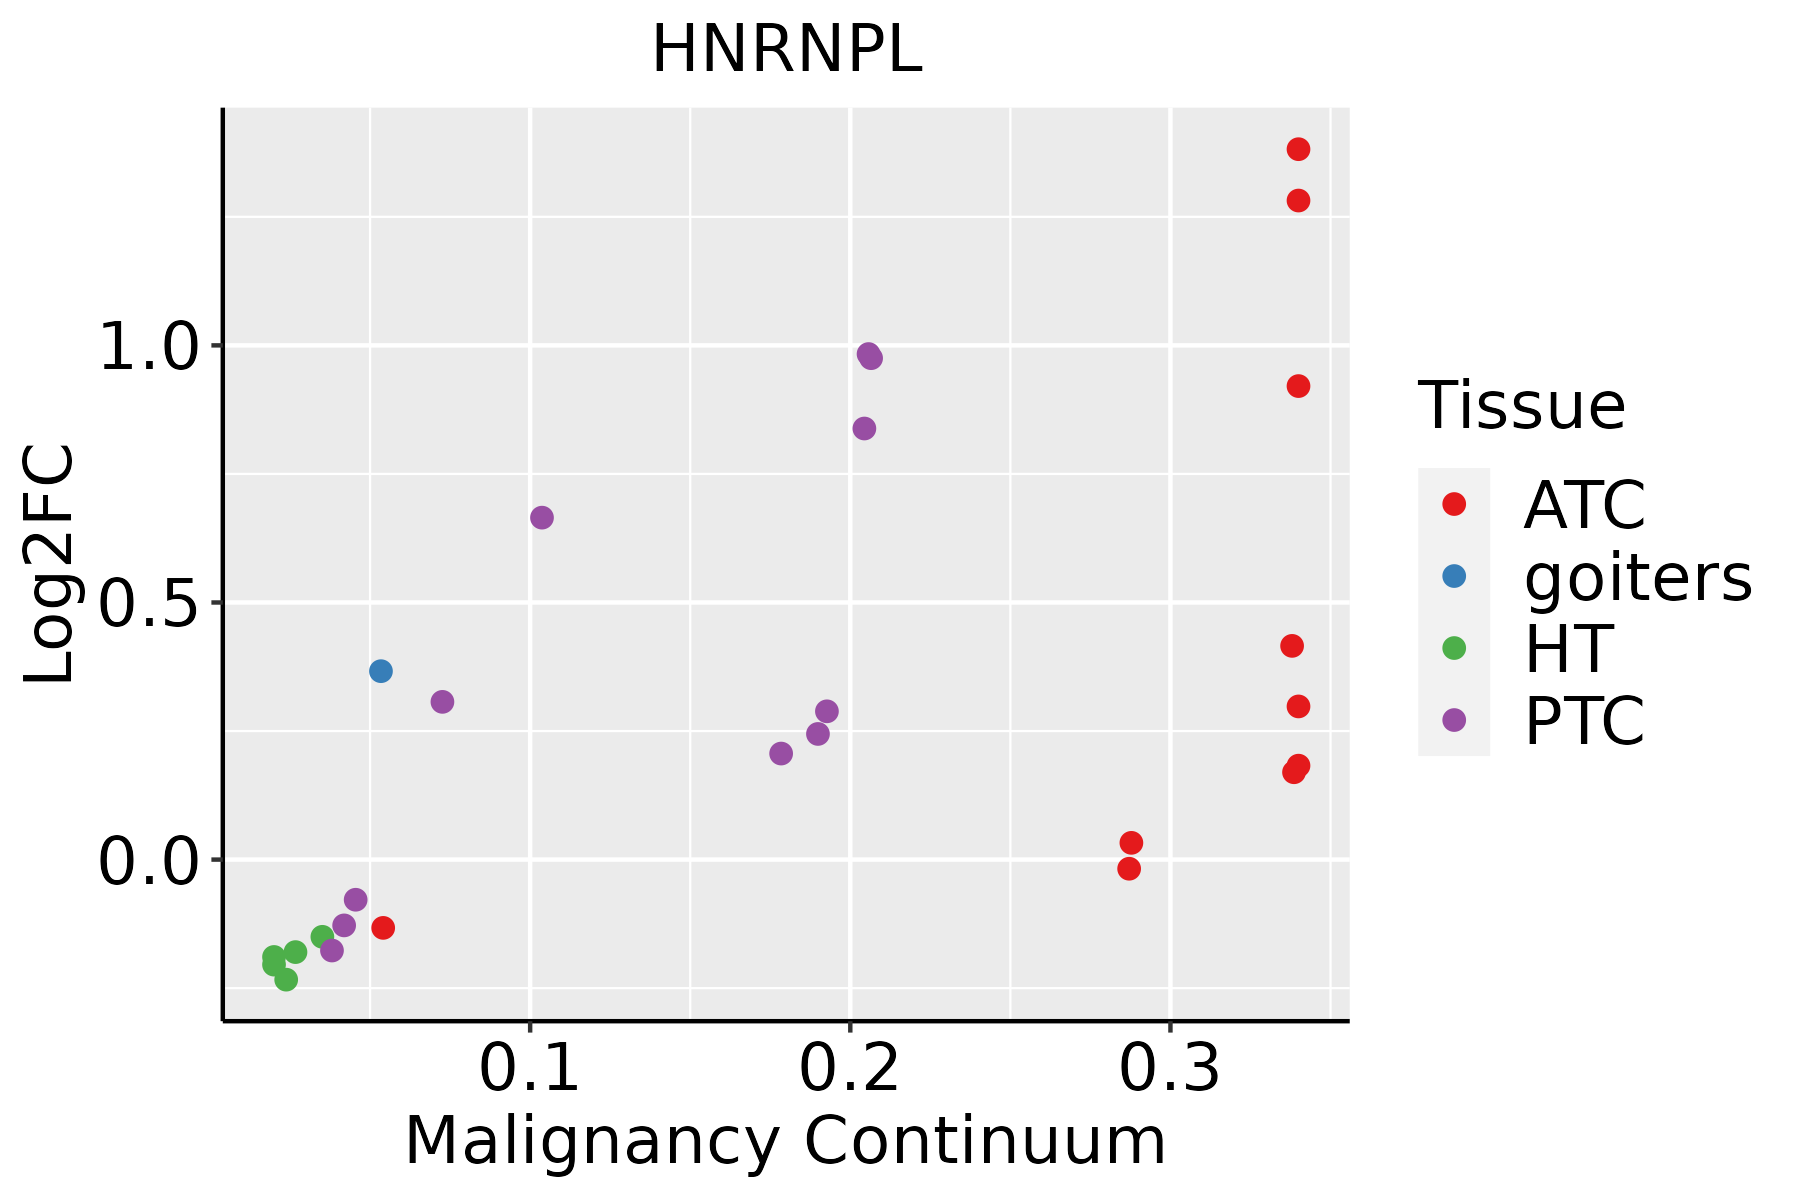
ATC: Anaplastic thyroid cancer
HT: Hashimoto's thyroiditis
PTC: Papillary thyroid cancer
∗log2FC in expression of this searched gene in stem-like cells from each diseased tissue sample relative to stem-like cells in normal samples in each tissue plotted against the malignancy continuum. Samples are colored based on if they are from different disease stage.

Top

Malignant transformation related pathway analysis

check buttonFind out the enriched GO biological processes and KEGG pathways involved in transition from healthy to precancer to cancer
check button Figure of enriched GO biological processes.
TissueDisease StageEnriched GO biological Processes
ColorectumADGO analysis - Figure of enriched GO biological processes: Top 15 enriched GO BP terms are showed in the bar plot of each disease state in each tissue. Each row represents a significant GO biological process which is colored according to the -log10(p.adjust).
ColorectumSERGO analysis - Figure of enriched GO biological processes: Top 15 enriched GO BP terms are showed in the bar plot of each disease state in each tissue. Each row represents a significant GO biological process which is colored according to the -log10(p.adjust).
ColorectumMSSGO analysis - Figure of enriched GO biological processes: Top 15 enriched GO BP terms are showed in the bar plot of each disease state in each tissue. Each row represents a significant GO biological process which is colored according to the -log10(p.adjust).
ColorectumMSI-HGO analysis - Figure of enriched GO biological processes: Top 15 enriched GO BP terms are showed in the bar plot of each disease state in each tissue. Each row represents a significant GO biological process which is colored according to the -log10(p.adjust).
ColorectumFAPGO analysis - Figure of enriched GO biological processes: Top 15 enriched GO BP terms are showed in the bar plot of each disease state in each tissue. Each row represents a significant GO biological process which is colored according to the -log10(p.adjust).
∗Top 15 enriched GO BP terms are showed in the bar plot of each disease state in each tissue. Each row represents a significant GO biological process which is colored according to the -log10(p.adjust).
Page: 1 2 3 4 5 6 7 8 9 

check button Enriched GO biological processes.
GO IDTissueDisease StageDescriptionGene RatioBg Ratiopvaluep.adjustCount
GO:000838017EndometriumEECRNA splicing111/2168434/187232.45e-161.13e-13111
GO:004348417EndometriumEECregulation of RNA splicing55/2168148/187235.21e-161.95e-1355
GO:000037516EndometriumEECRNA splicing, via transesterification reactions88/2168324/187237.46e-152.63e-1288
GO:000037716EndometriumEECRNA splicing, via transesterification reactions with bulged adenosine as nucleophile87/2168320/187239.97e-153.15e-1287
GO:000039816EndometriumEECmRNA splicing, via spliceosome87/2168320/187239.97e-153.15e-1287
GO:190331115EndometriumEECregulation of mRNA metabolic process79/2168288/187231.01e-132.64e-1179
GO:004802417EndometriumEECregulation of mRNA splicing, via spliceosome40/2168101/187234.45e-139.86e-1140
GO:005068414EndometriumEECregulation of mRNA processing43/2168137/187234.52e-104.59e-0843
GO:000038014EndometriumEECalternative mRNA splicing, via spliceosome26/216877/187232.42e-071.05e-0526
GO:000038114EndometriumEECregulation of alternative mRNA splicing, via spliceosome20/216860/187237.27e-061.67e-0420
GO:000838026EsophagusHGINRNA splicing160/2587434/187233.74e-341.12e-30160
GO:000037520EsophagusHGINRNA splicing, via transesterification reactions115/2587324/187233.16e-233.80e-20115
GO:000037720EsophagusHGINRNA splicing, via transesterification reactions with bulged adenosine as nucleophile113/2587320/187231.24e-229.26e-20113
GO:000039820EsophagusHGINmRNA splicing, via spliceosome113/2587320/187231.24e-229.26e-20113
GO:004348427EsophagusHGINregulation of RNA splicing59/2587148/187233.61e-157.22e-1359
GO:190331120EsophagusHGINregulation of mRNA metabolic process91/2587288/187235.06e-159.78e-1391
GO:005068419EsophagusHGINregulation of mRNA processing55/2587137/187232.17e-143.94e-1255
GO:004802426EsophagusHGINregulation of mRNA splicing, via spliceosome42/2587101/187236.35e-127.78e-1042
GO:000038018EsophagusHGINalternative mRNA splicing, via spliceosome32/258777/187232.06e-091.54e-0732
GO:000038118EsophagusHGINregulation of alternative mRNA splicing, via spliceosome22/258760/187237.92e-062.40e-0422
Page: 1 2 3 4 5 6 7 8 9 10 11 

check button Enriched KEGG pathways.
Pathway IDTissueDisease StageDescriptionGene RatioBg Ratiopvaluep.adjustqvalueCount
Page: 1 

Top

Cell-cell communication analysis

check buttonIdentification of potential cell-cell interactions between two cell types and their ligand-receptor pairs for different disease states
LigandReceptorLRpairPathwayTissueDisease Stage
Page: 1 

Top

Single-cell gene regulatory network inference analysis

check buttonFind out the significant the regulons (TFs) and the target genes of each regulon across cell types for different disease states
TFCell TypeTissueDisease StageTarget GeneRSSRegulon Activity
∗The dot plots of a searched regulon are shown for all cell subpopulations in each disease state of each tissue based on the regulon specific score inferred using pySCENIC and by calculating the average expression.
Page: 1 

Top

Somatic mutation of malignant transformation related genes

check buttonAnnotation of somatic variants for genes involved in malignant transformation
Hugo SymbolVariant ClassVariant ClassificationdbSNP RSHGVScHGVSpHGVSp ShortSWISSPROTBIOTYPESIFTPolyPhenTumor Sample BarcodeTissueHistologySexAgeStageTherapy TypesDrugsOutcome
HNRNPLSNVMissense_Mutationc.1540N>Ap.Glu514Lysp.E514KP14866protein_codingdeleterious(0.03)benign(0.033)TCGA-A2-A0EY-01Breastbreast invasive carcinomaFemale<65I/IIChemotherapyadriamycinSD
HNRNPLSNVMissense_Mutationnovelc.502N>Ap.Pro168Thrp.P168TP14866protein_codingdeleterious(0.04)probably_damaging(0.999)TCGA-A7-A3RF-01Breastbreast invasive carcinomaFemale>=65I/IIHormone TherapyanastrozolePD
HNRNPLSNVMissense_Mutationc.1391N>Tp.Ser464Leup.S464LP14866protein_codingtolerated(0.51)benign(0.059)TCGA-AC-A23H-01Breastbreast invasive carcinomaFemale>=65I/IIUnknownUnknownPD
HNRNPLSNVMissense_Mutationnovelc.1560N>Gp.Ile520Metp.I520MP14866protein_codingtolerated(0.23)benign(0.001)TCGA-AC-A3W5-01Breastbreast invasive carcinomaFemale>=65I/IIChemotherapydocetaxelCR
HNRNPLinsertionFrame_Shift_Insnovelc.850_851insCCTTAGAAACCAGCAGTGGCTCCTTTGAGAGTCTGGTGAGGGTp.Asp284AlafsTer26p.D284Afs*26P14866protein_codingTCGA-A2-A0CP-01Breastbreast invasive carcinomaFemale<65I/IIChemotherapycytoxanSD
HNRNPLinsertionFrame_Shift_Insnovelc.1284_1285insAGp.Gly429ArgfsTer5p.G429Rfs*5P14866protein_codingTCGA-AN-A04C-01Breastbreast invasive carcinomaFemale<65I/IIUnknownUnknownSD
HNRNPLinsertionIn_Frame_Insnovelc.1283_1284insGGGCCCAATTTCACAAGAACCGCATTGGCGp.Asp428delinsGluGlyProIleSerGlnGluProHisTrpArgp.D428delinsEGPISQEPHWRP14866protein_codingTCGA-AN-A04C-01Breastbreast invasive carcinomaFemale<65I/IIUnknownUnknownSD
HNRNPLSNVMissense_Mutationc.1021N>Ap.Glu341Lysp.E341KP14866protein_codingtolerated(0.56)benign(0.018)TCGA-C5-A1MI-01Cervixcervical & endocervical cancerFemale<65I/IIChemotherapycisplatinPD
HNRNPLSNVMissense_Mutationc.719N>Tp.Ser240Leup.S240LP14866protein_codingtolerated(0.09)benign(0.057)TCGA-MY-A5BD-01Cervixcervical & endocervical cancerFemale<65I/IIChemotherapycisplatinCR
HNRNPLSNVMissense_Mutationc.796N>Ap.Glu266Lysp.E266KP14866protein_codingdeleterious(0.02)benign(0.017)TCGA-AA-3715-01Colorectumcolon adenocarcinomaMale>=65I/IIUnknownUnknownPD
Page: 1 2 3 4 5 6 7 8 

Top

Related drugs of malignant transformation related genes

check buttonIdentification of chemicals and drugs interact with genes involved in malignant transfromation
(DGIdb 4.0)
Entrez IDSymbolCategoryInteraction TypesDrug Claim NameDrug NamePMIDs
Page: 1