
|
|||||
|
 | |
| |
| |
| |
| |
| |
|
Gene: GTF2F1 |
Gene summary for GTF2F1 |
| Gene information | Species | Human | Gene symbol | GTF2F1 | Gene ID | 2962 |
| Gene name | general transcription factor IIF subunit 1 | |
| Gene Alias | BTF4 | |
| Cytomap | 19p13.3 | |
| Gene Type | protein-coding | GO ID | GO:0006139 | UniProtAcc | P35269 |
Top |
Malignant transformation analysis |
| Identification of the aberrant gene expression in precancerous and cancerous lesions by comparing the gene expression of stem-like cells in diseased tissues with normal stem cells |
| Entrez ID | Symbol | Replicates | Species | Organ | Tissue | Adj P-value | Log2FC | Malignancy |
| 2962 | GTF2F1 | LZE2T | Human | Esophagus | ESCC | 8.54e-03 | 2.12e-01 | 0.082 |
| 2962 | GTF2F1 | LZE4T | Human | Esophagus | ESCC | 6.40e-10 | 3.27e-01 | 0.0811 |
| 2962 | GTF2F1 | LZE7T | Human | Esophagus | ESCC | 6.94e-09 | 4.57e-01 | 0.0667 |
| 2962 | GTF2F1 | LZE8T | Human | Esophagus | ESCC | 7.76e-08 | 3.65e-01 | 0.067 |
| 2962 | GTF2F1 | LZE20T | Human | Esophagus | ESCC | 3.08e-04 | 4.74e-02 | 0.0662 |
| 2962 | GTF2F1 | LZE24T | Human | Esophagus | ESCC | 1.09e-20 | 5.29e-01 | 0.0596 |
| 2962 | GTF2F1 | LZE21T | Human | Esophagus | ESCC | 9.13e-04 | 2.66e-01 | 0.0655 |
| 2962 | GTF2F1 | LZE6T | Human | Esophagus | ESCC | 8.43e-03 | 2.21e-01 | 0.0845 |
| 2962 | GTF2F1 | P1T-E | Human | Esophagus | ESCC | 1.01e-06 | 5.21e-01 | 0.0875 |
| 2962 | GTF2F1 | P2T-E | Human | Esophagus | ESCC | 4.69e-29 | 4.52e-01 | 0.1177 |
| 2962 | GTF2F1 | P4T-E | Human | Esophagus | ESCC | 1.62e-18 | 5.96e-01 | 0.1323 |
| 2962 | GTF2F1 | P5T-E | Human | Esophagus | ESCC | 5.12e-23 | 4.41e-01 | 0.1327 |
| 2962 | GTF2F1 | P8T-E | Human | Esophagus | ESCC | 2.35e-39 | 7.20e-01 | 0.0889 |
| 2962 | GTF2F1 | P9T-E | Human | Esophagus | ESCC | 4.15e-19 | 5.31e-01 | 0.1131 |
| 2962 | GTF2F1 | P10T-E | Human | Esophagus | ESCC | 7.99e-37 | 6.85e-01 | 0.116 |
| 2962 | GTF2F1 | P11T-E | Human | Esophagus | ESCC | 6.05e-18 | 6.62e-01 | 0.1426 |
| 2962 | GTF2F1 | P12T-E | Human | Esophagus | ESCC | 8.08e-33 | 6.08e-01 | 0.1122 |
| 2962 | GTF2F1 | P15T-E | Human | Esophagus | ESCC | 7.35e-23 | 5.38e-01 | 0.1149 |
| 2962 | GTF2F1 | P16T-E | Human | Esophagus | ESCC | 8.59e-21 | 3.59e-01 | 0.1153 |
| 2962 | GTF2F1 | P17T-E | Human | Esophagus | ESCC | 2.48e-19 | 7.31e-01 | 0.1278 |
| Page: 1 2 3 4 5 6 7 |
| Tissue | Expression Dynamics | Abbreviation |
| Esophagus | 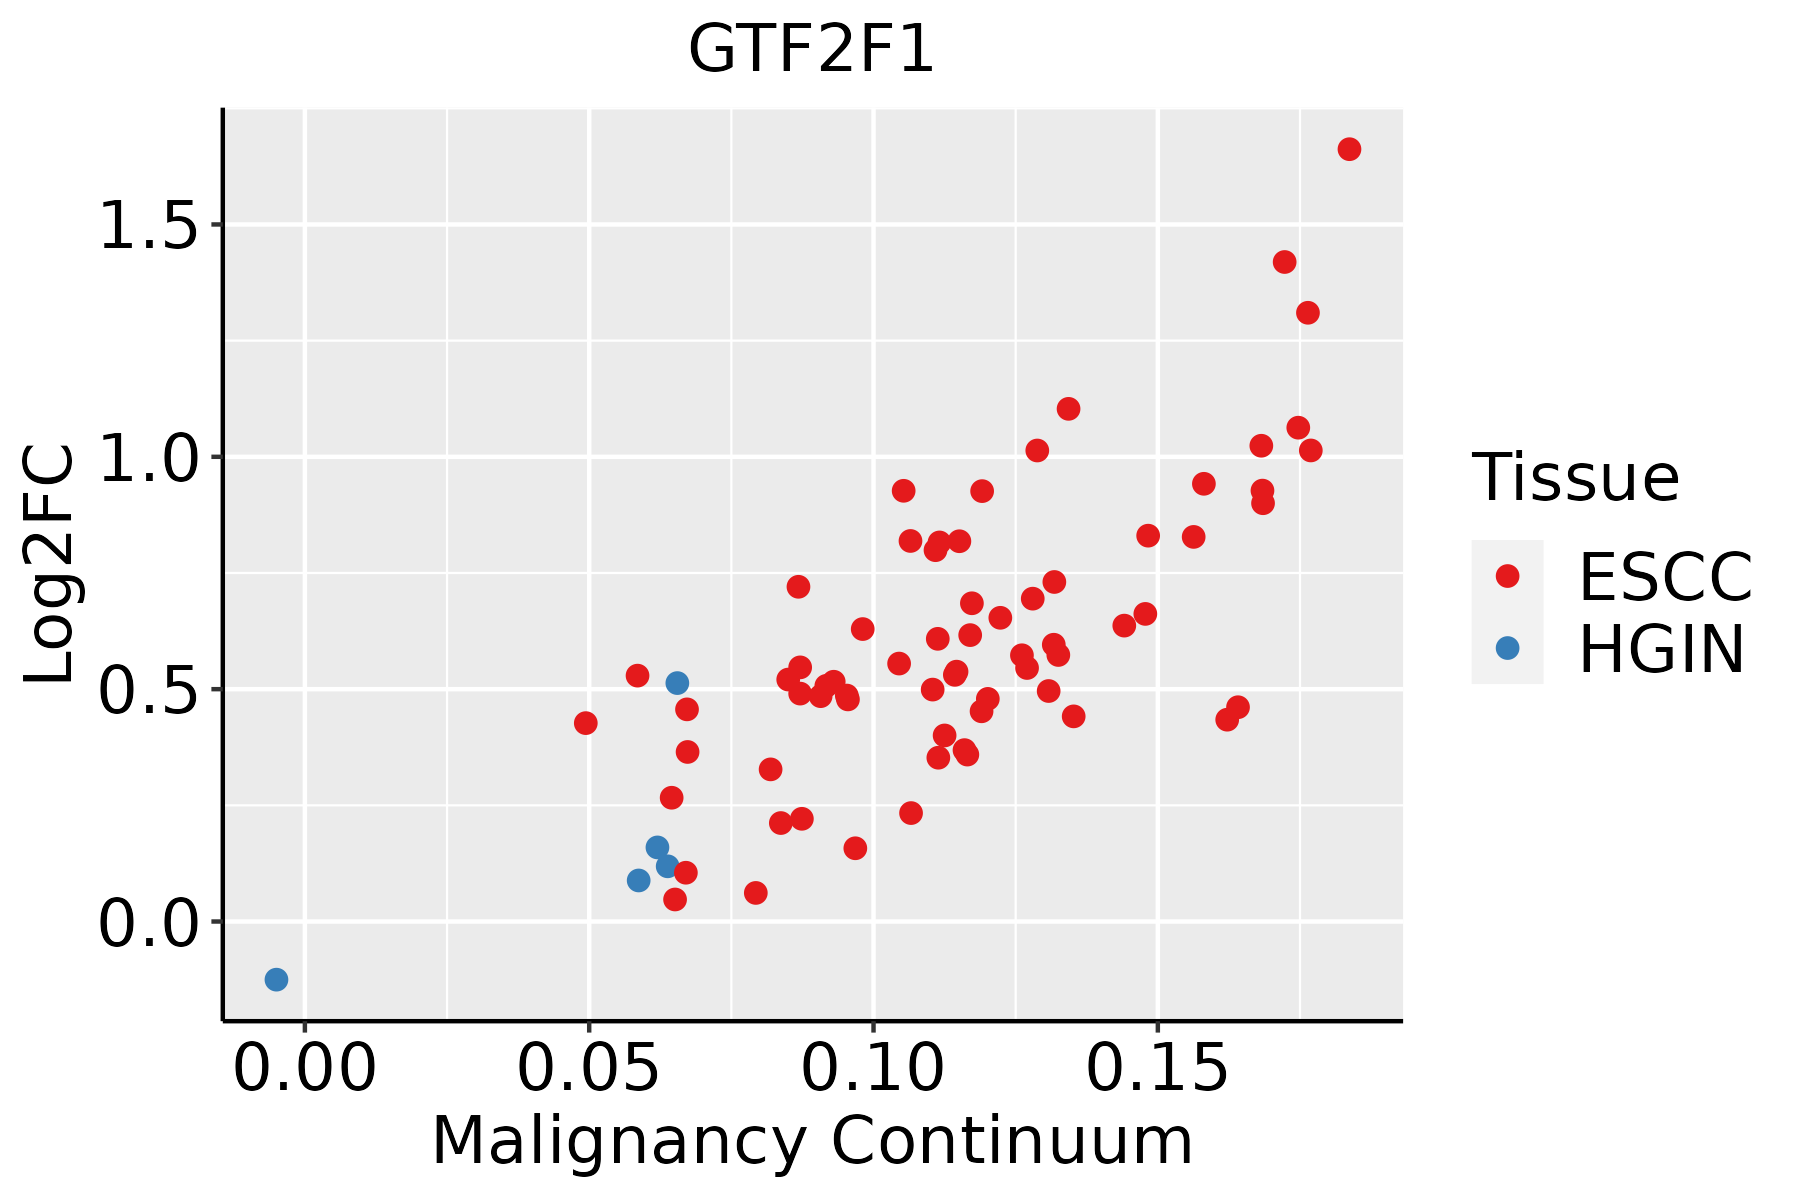 | ESCC: Esophageal squamous cell carcinoma |
| HGIN: High-grade intraepithelial neoplasias | ||
| LGIN: Low-grade intraepithelial neoplasias | ||
| Liver | 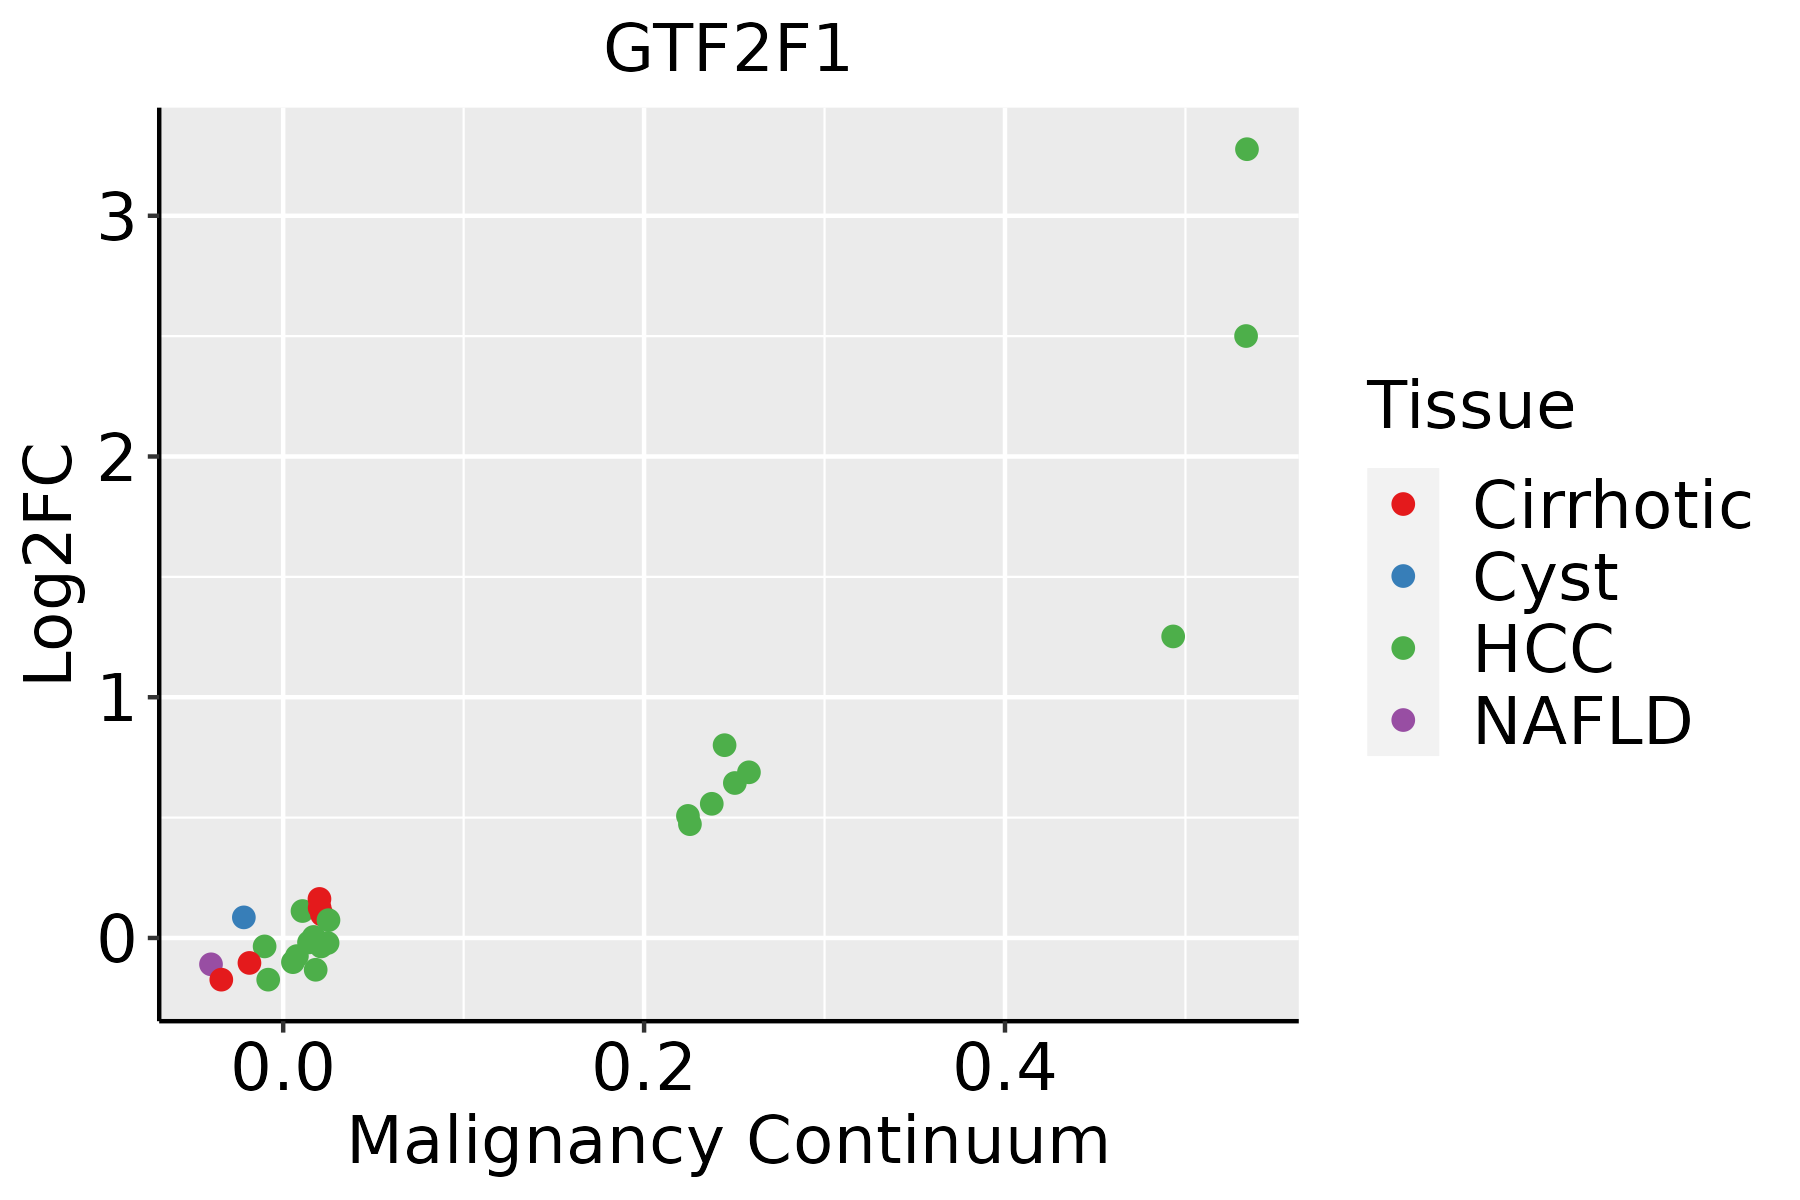 | HCC: Hepatocellular carcinoma |
| NAFLD: Non-alcoholic fatty liver disease | ||
| Oral Cavity | 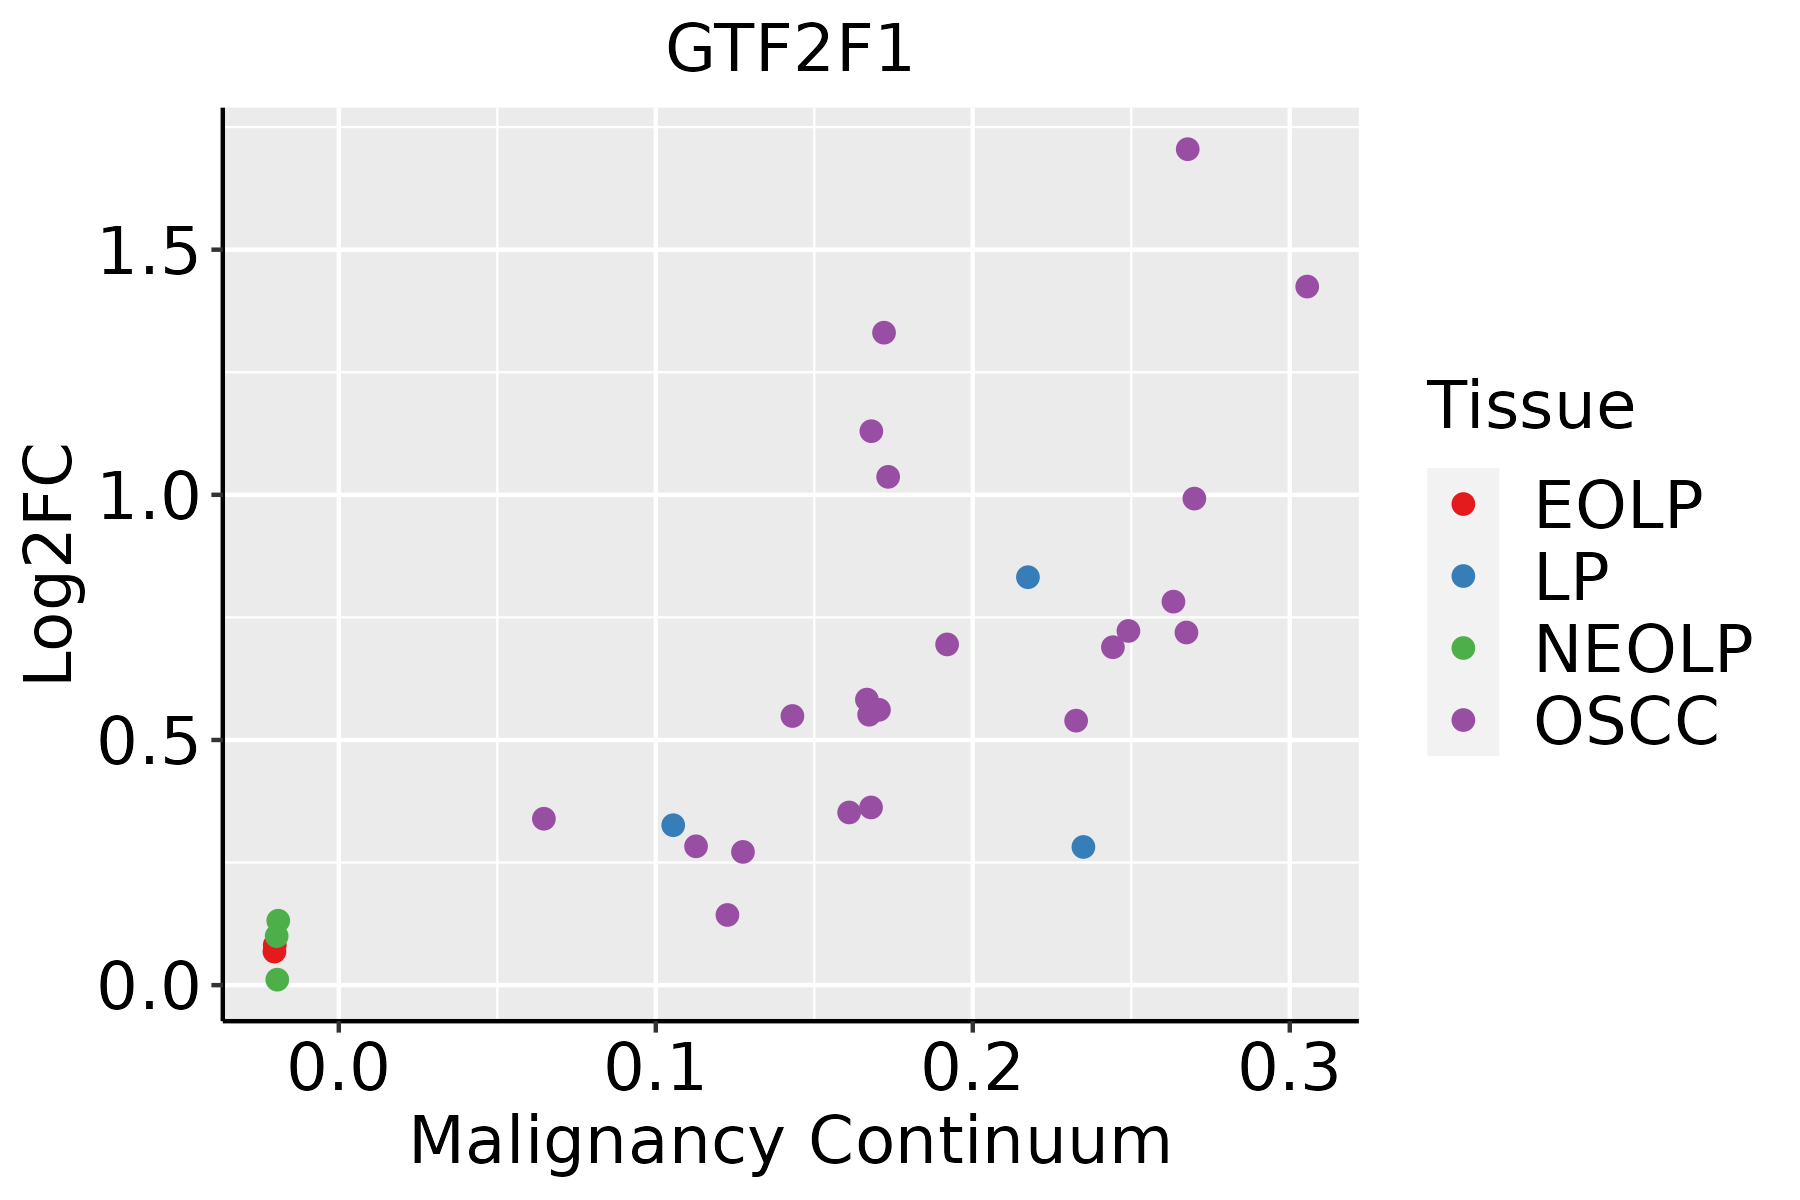 | EOLP: Erosive Oral lichen planus |
| LP: leukoplakia | ||
| NEOLP: Non-erosive oral lichen planus | ||
| OSCC: Oral squamous cell carcinoma | ||
| Prostate | 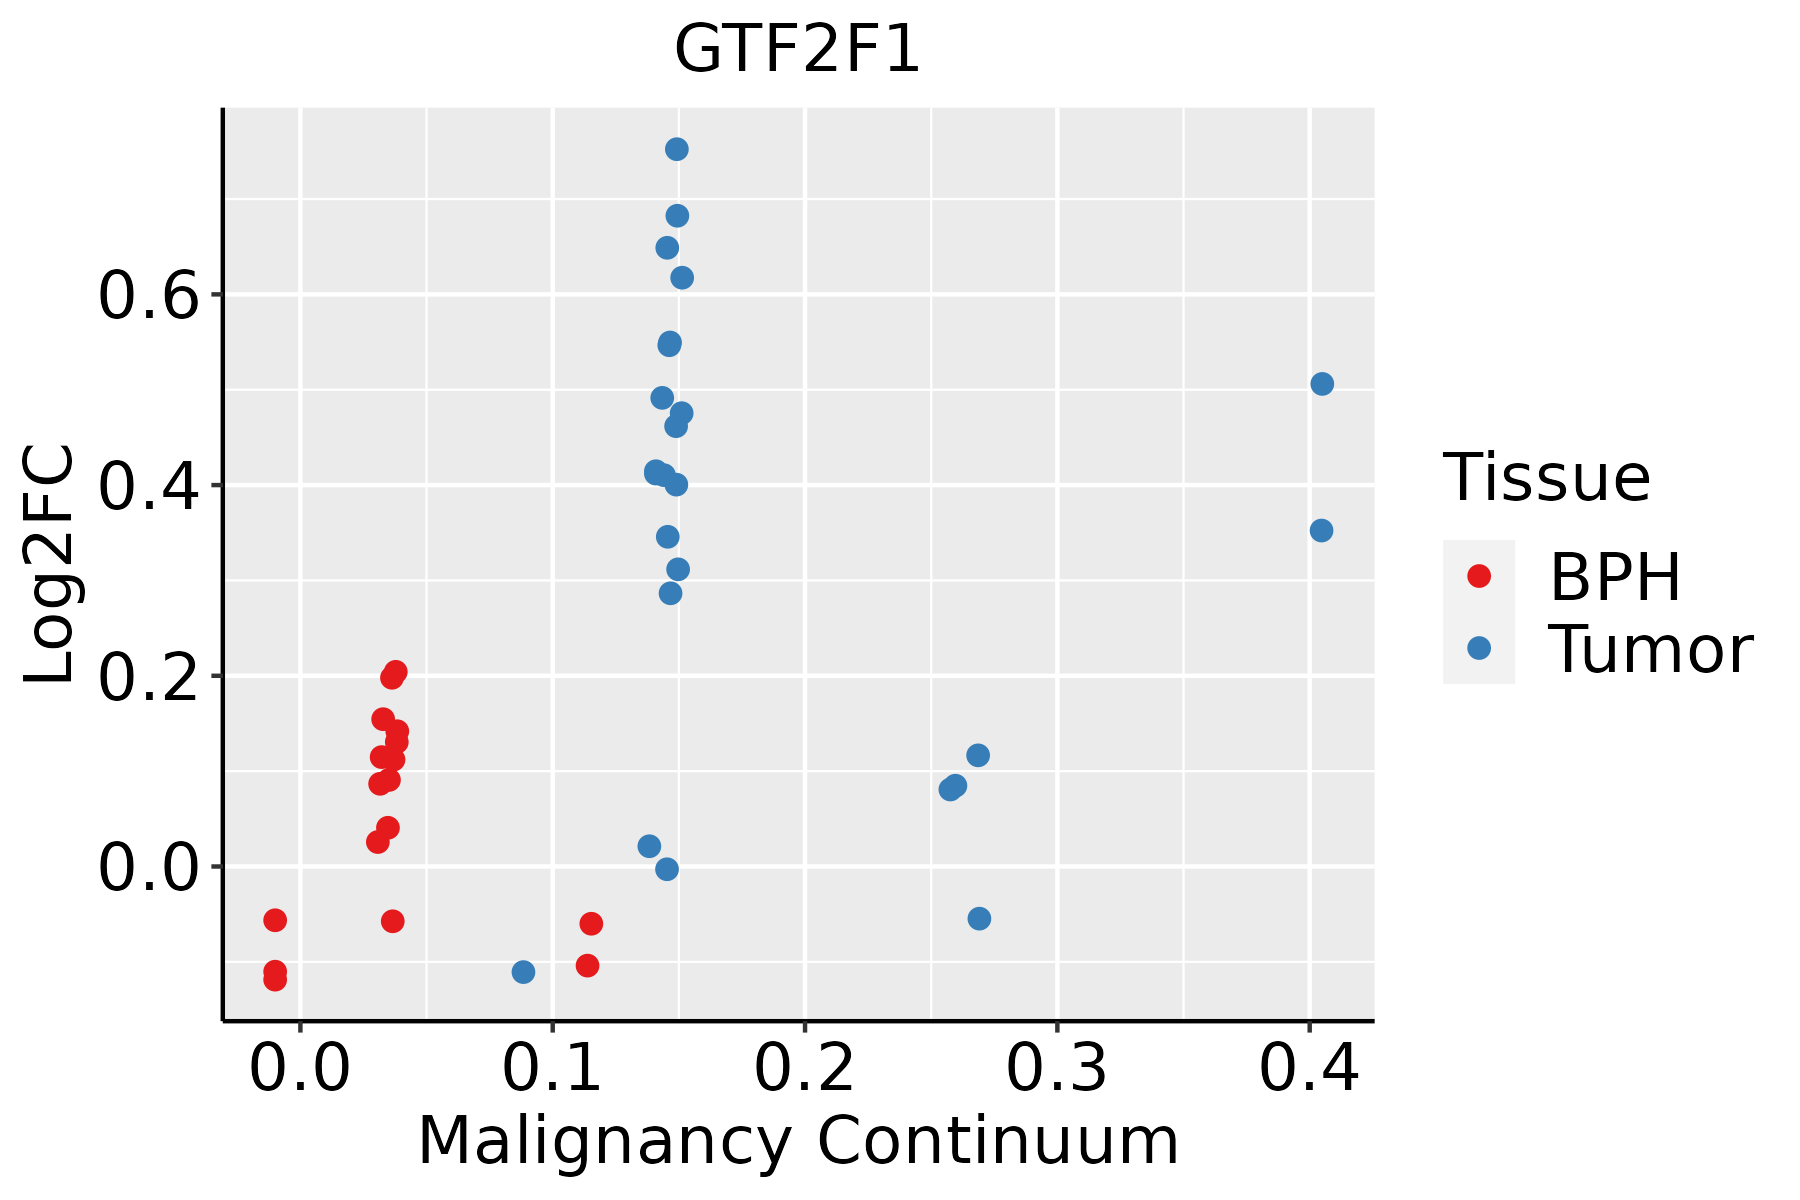 | BPH: Benign Prostatic Hyperplasia |
| Skin | 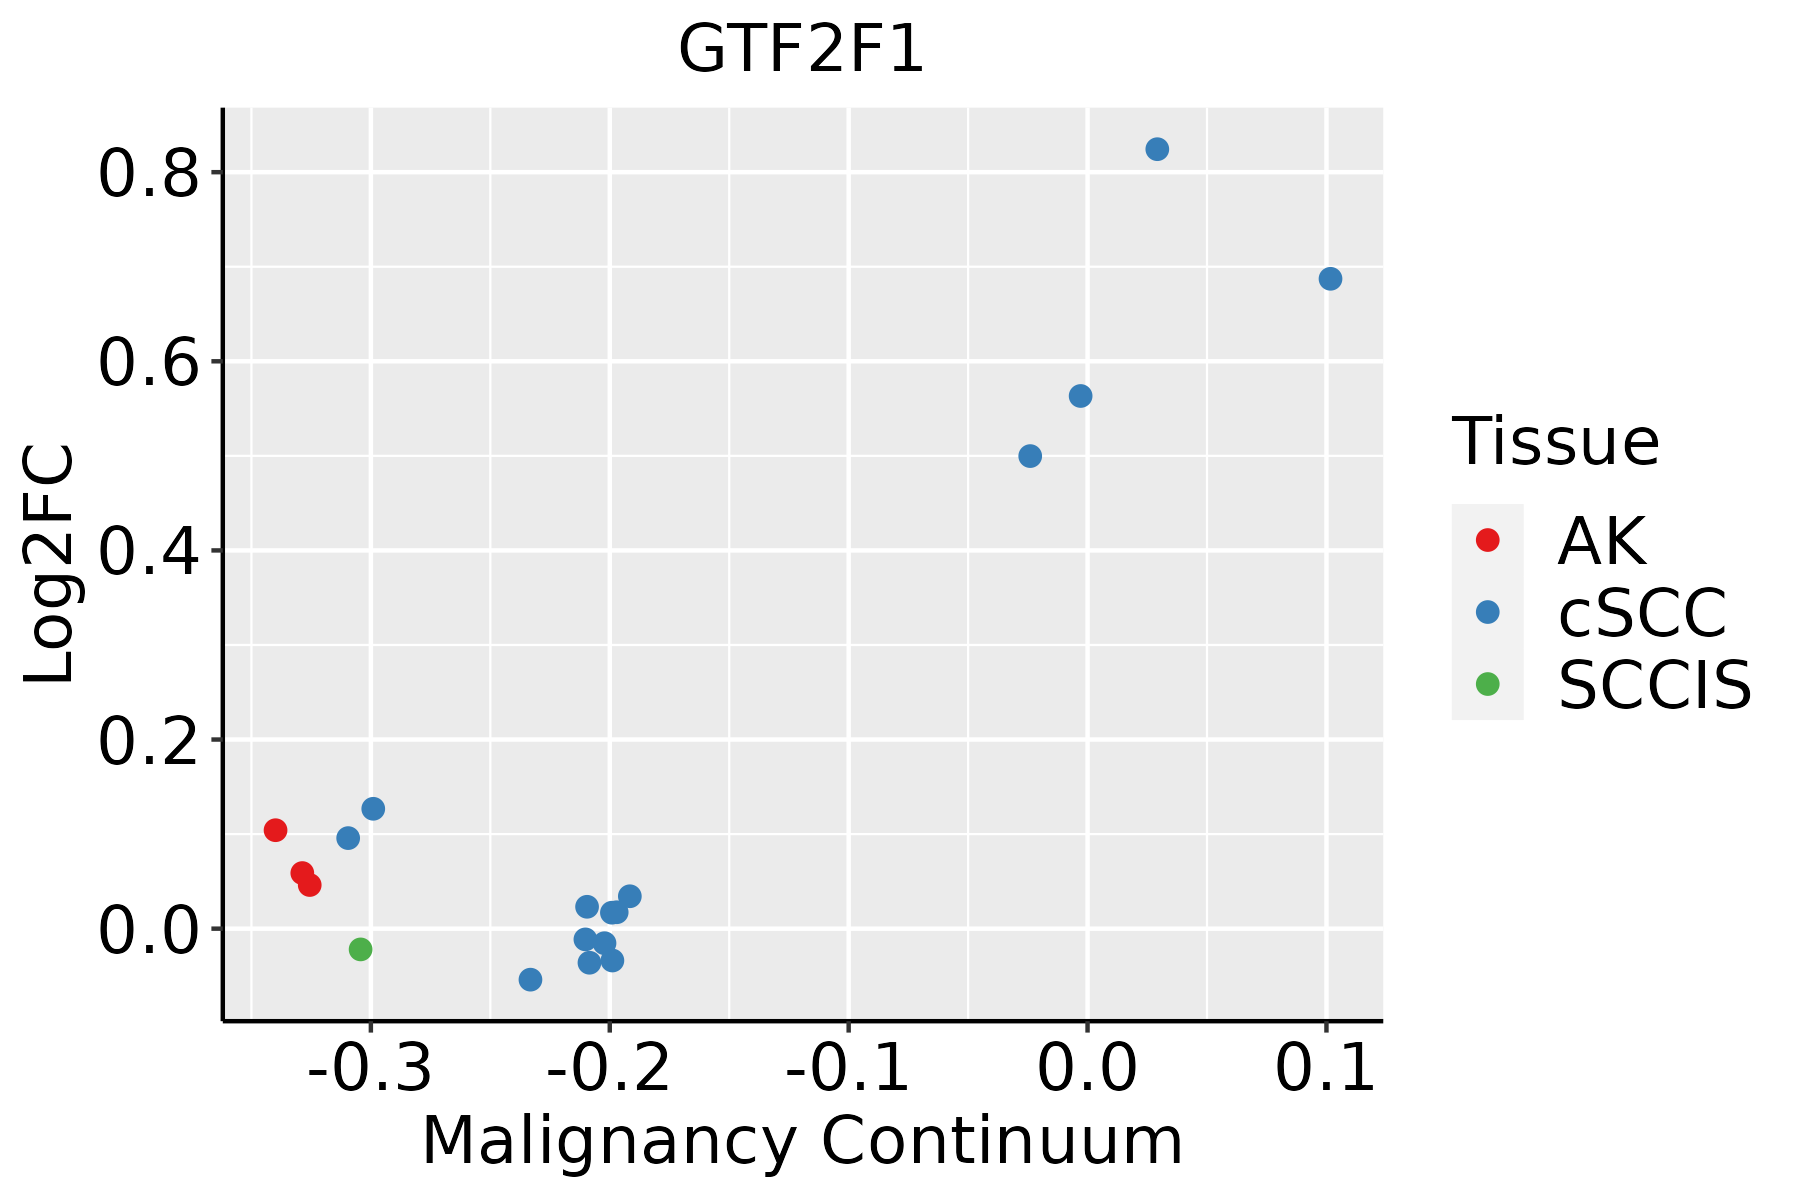 | AK: Actinic keratosis |
| cSCC: Cutaneous squamous cell carcinoma | ||
| SCCIS:squamous cell carcinoma in situ | ||
| Thyroid | 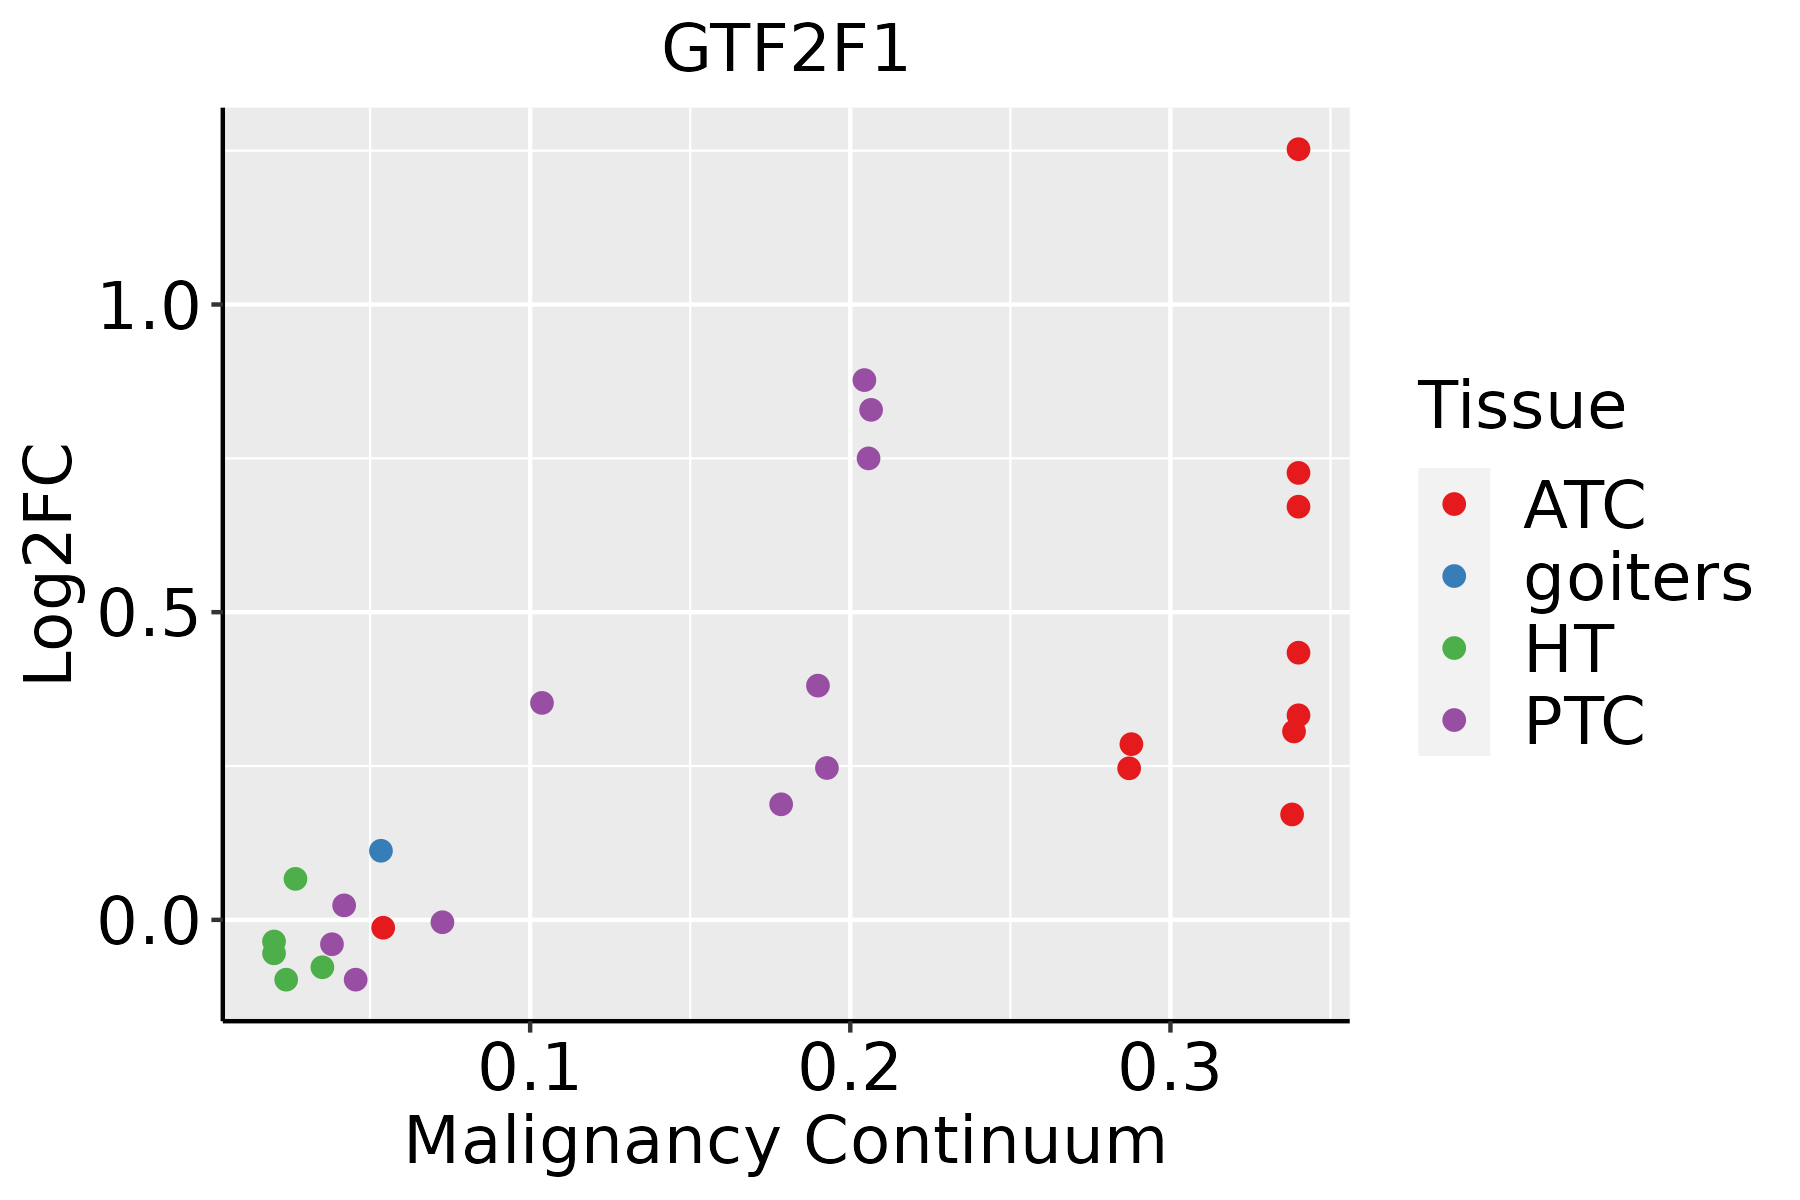 | ATC: Anaplastic thyroid cancer |
| HT: Hashimoto's thyroiditis | ||
| PTC: Papillary thyroid cancer |
| ∗log2FC in expression of this searched gene in stem-like cells from each diseased tissue sample relative to stem-like cells in normal samples in each tissue plotted against the malignancy continuum. Samples are colored based on if they are from different disease stage. |
Top |
Malignant transformation related pathway analysis |
| Find out the enriched GO biological processes and KEGG pathways involved in transition from healthy to precancer to cancer |
| Tissue | Disease Stage | Enriched GO biological Processes |
| Colorectum | AD |  |
| Colorectum | SER |  |
| Colorectum | MSS |  |
| Colorectum | MSI-H |  |
| Colorectum | FAP |  |
| ∗Top 15 enriched GO BP terms are showed in the bar plot of each disease state in each tissue. Each row represents a significant GO biological process which is colored according to the -log10(p.adjust). |
| Page: 1 2 3 4 5 6 7 8 9 |
| GO ID | Tissue | Disease Stage | Description | Gene Ratio | Bg Ratio | pvalue | p.adjust | Count |
| GO:004339316 | Prostate | BPH | regulation of protein binding | 60/3107 | 196/18723 | 7.72e-07 | 1.45e-05 | 60 |
| GO:005110017 | Prostate | BPH | negative regulation of binding | 52/3107 | 162/18723 | 8.41e-07 | 1.56e-05 | 52 |
| GO:00320918 | Prostate | BPH | negative regulation of protein binding | 31/3107 | 94/18723 | 7.37e-05 | 7.20e-04 | 31 |
| GO:00063546 | Prostate | BPH | DNA-templated transcription, elongation | 30/3107 | 91/18723 | 9.63e-05 | 9.00e-04 | 30 |
| GO:00063685 | Prostate | BPH | transcription elongation from RNA polymerase II promoter | 24/3107 | 69/18723 | 1.85e-04 | 1.55e-03 | 24 |
| GO:00327864 | Prostate | BPH | positive regulation of DNA-templated transcription, elongation | 12/3107 | 27/18723 | 6.34e-04 | 4.32e-03 | 12 |
| GO:00327842 | Prostate | BPH | regulation of DNA-templated transcription, elongation | 17/3107 | 53/18723 | 4.11e-03 | 2.04e-02 | 17 |
| GO:00342432 | Prostate | BPH | regulation of transcription elongation from RNA polymerase II promoter | 11/3107 | 32/18723 | 1.11e-02 | 4.55e-02 | 11 |
| GO:00329683 | Prostate | BPH | positive regulation of transcription elongation from RNA polymerase II promoter | 6/3107 | 13/18723 | 1.24e-02 | 4.94e-02 | 6 |
| GO:005109819 | Prostate | Tumor | regulation of binding | 122/3246 | 363/18723 | 2.86e-14 | 3.63e-12 | 122 |
| GO:000961514 | Prostate | Tumor | response to virus | 101/3246 | 367/18723 | 6.40e-07 | 1.32e-05 | 101 |
| GO:005110018 | Prostate | Tumor | negative regulation of binding | 52/3246 | 162/18723 | 3.22e-06 | 5.29e-05 | 52 |
| GO:004339317 | Prostate | Tumor | regulation of protein binding | 60/3246 | 196/18723 | 3.36e-06 | 5.45e-05 | 60 |
| GO:000635412 | Prostate | Tumor | DNA-templated transcription, elongation | 31/3246 | 91/18723 | 8.58e-05 | 8.53e-04 | 31 |
| GO:000636812 | Prostate | Tumor | transcription elongation from RNA polymerase II promoter | 25/3246 | 69/18723 | 1.33e-04 | 1.23e-03 | 25 |
| GO:003209114 | Prostate | Tumor | negative regulation of protein binding | 31/3246 | 94/18723 | 1.69e-04 | 1.50e-03 | 31 |
| GO:003278611 | Prostate | Tumor | positive regulation of DNA-templated transcription, elongation | 12/3246 | 27/18723 | 9.52e-04 | 6.20e-03 | 12 |
| GO:00327841 | Prostate | Tumor | regulation of DNA-templated transcription, elongation | 18/3246 | 53/18723 | 2.59e-03 | 1.43e-02 | 18 |
| GO:00342431 | Prostate | Tumor | regulation of transcription elongation from RNA polymerase II promoter | 12/3246 | 32/18723 | 5.30e-03 | 2.54e-02 | 12 |
| GO:005109827 | Skin | cSCC | regulation of binding | 152/4864 | 363/18723 | 2.21e-11 | 1.10e-09 | 152 |
| Page: 1 2 3 4 5 6 |
| Pathway ID | Tissue | Disease Stage | Description | Gene Ratio | Bg Ratio | pvalue | p.adjust | qvalue | Count |
| hsa030222 | Esophagus | ESCC | Basal transcription factors | 35/4205 | 45/8465 | 1.01e-04 | 4.06e-04 | 2.08e-04 | 35 |
| hsa0302211 | Esophagus | ESCC | Basal transcription factors | 35/4205 | 45/8465 | 1.01e-04 | 4.06e-04 | 2.08e-04 | 35 |
| hsa03022 | Oral cavity | OSCC | Basal transcription factors | 28/3704 | 45/8465 | 9.53e-03 | 2.11e-02 | 1.08e-02 | 28 |
| hsa030221 | Oral cavity | OSCC | Basal transcription factors | 28/3704 | 45/8465 | 9.53e-03 | 2.11e-02 | 1.08e-02 | 28 |
| Page: 1 |
Top |
Cell-cell communication analysis |
| Identification of potential cell-cell interactions between two cell types and their ligand-receptor pairs for different disease states |
| Ligand | Receptor | LRpair | Pathway | Tissue | Disease Stage |
| Page: 1 |
Top |
Single-cell gene regulatory network inference analysis |
| Find out the significant the regulons (TFs) and the target genes of each regulon across cell types for different disease states |
| TF | Cell Type | Tissue | Disease Stage | Target Gene | RSS | Regulon Activity |
| GTF2F1 | STM | Cervix | ADJ | IFIT1,AL158206.1,CEACAM6, etc. | 1.63e-01 |  |
| GTF2F1 | PLA | Liver | Healthy | HSPA1A,ID1,PRSS23, etc. | 5.65e-01 |  |
| GTF2F1 | TFC | Thyroid | ADJ | LYPD3,BEX5,AC073611.1, etc. | 4.00e-01 |  |
| ∗The dot plots of a searched regulon are shown for all cell subpopulations in each disease state of each tissue based on the regulon specific score inferred using pySCENIC and by calculating the average expression. |
| Page: 1 |
Top |
Somatic mutation of malignant transformation related genes |
| Annotation of somatic variants for genes involved in malignant transformation |
| Hugo Symbol | Variant Class | Variant Classification | dbSNP RS | HGVSc | HGVSp | HGVSp Short | SWISSPROT | BIOTYPE | SIFT | PolyPhen | Tumor Sample Barcode | Tissue | Histology | Sex | Age | Stage | Therapy Types | Drugs | Outcome |
| GTF2F1 | deletion | Frame_Shift_Del | novel | c.1449delN | p.Leu484Ter | p.L484* | P35269 | protein_coding | TCGA-EW-A2FV-01 | Breast | breast invasive carcinoma | Female | <65 | III/IV | Chemotherapy | docetaxel | SD | ||
| GTF2F1 | deletion | Frame_Shift_Del | novel | c.332delN | p.Lys111ArgfsTer8 | p.K111Rfs*8 | P35269 | protein_coding | TCGA-EW-A2FV-01 | Breast | breast invasive carcinoma | Female | <65 | III/IV | Chemotherapy | docetaxel | SD | ||
| GTF2F1 | SNV | Missense_Mutation | rs201557731 | c.406N>A | p.Glu136Lys | p.E136K | P35269 | protein_coding | deleterious(0) | possibly_damaging(0.83) | TCGA-FU-A3HZ-01 | Cervix | cervical & endocervical cancer | Female | <65 | I/II | Chemotherapy | cisplatin | CR |
| GTF2F1 | SNV | Missense_Mutation | rs148016023 | c.472N>A | p.Glu158Lys | p.E158K | P35269 | protein_coding | deleterious(0) | probably_damaging(0.965) | TCGA-IR-A3LL-01 | Cervix | cervical & endocervical cancer | Female | <65 | I/II | Chemotherapy | cisplatin | CR |
| GTF2F1 | SNV | Missense_Mutation | novel | c.842N>G | p.Ser281Cys | p.S281C | P35269 | protein_coding | deleterious(0) | probably_damaging(0.997) | TCGA-VS-A94Z-01 | Cervix | cervical & endocervical cancer | Female | <65 | I/II | Chemotherapy | cisplatin | CR |
| GTF2F1 | SNV | Missense_Mutation | rs147291523 | c.1103C>T | p.Thr368Met | p.T368M | P35269 | protein_coding | deleterious(0.02) | possibly_damaging(0.824) | TCGA-AA-3663-01 | Colorectum | colon adenocarcinoma | Male | <65 | I/II | Unknown | Unknown | SD |
| GTF2F1 | SNV | Missense_Mutation | rs146571246 | c.1511N>A | p.Arg504His | p.R504H | P35269 | protein_coding | deleterious(0.01) | benign(0.142) | TCGA-AA-3715-01 | Colorectum | colon adenocarcinoma | Male | >=65 | I/II | Unknown | Unknown | PD |
| GTF2F1 | SNV | Missense_Mutation | novel | c.1067A>G | p.Glu356Gly | p.E356G | P35269 | protein_coding | tolerated(0.05) | possibly_damaging(0.629) | TCGA-AA-A00N-01 | Colorectum | colon adenocarcinoma | Male | >=65 | I/II | Unknown | Unknown | PD |
| GTF2F1 | SNV | Missense_Mutation | rs201557731 | c.406G>A | p.Glu136Lys | p.E136K | P35269 | protein_coding | deleterious(0) | possibly_damaging(0.83) | TCGA-AA-A01P-01 | Colorectum | colon adenocarcinoma | Female | >=65 | III/IV | Unknown | Unknown | PD |
| GTF2F1 | SNV | Missense_Mutation | novel | c.989N>T | p.Pro330Leu | p.P330L | P35269 | protein_coding | tolerated(0.1) | benign(0.15) | TCGA-AY-4071-01 | Colorectum | colon adenocarcinoma | Female | <65 | I/II | Unknown | Unknown | SD |
| Page: 1 2 3 4 5 |
Top |
Related drugs of malignant transformation related genes |
| Identification of chemicals and drugs interact with genes involved in malignant transfromation |
| (DGIdb 4.0) |
| Entrez ID | Symbol | Category | Interaction Types | Drug Claim Name | Drug Name | PMIDs |
| Page: 1 |

Copyright 2023-Present -The University of Texas Health Science Center at Houston |