
|
|||||
|
 | |
| |
| |
| |
| |
| |
|
Gene: GMPS |
Gene summary for GMPS |
| Gene information | Species | Human | Gene symbol | GMPS | Gene ID | 8833 |
| Gene name | guanine monophosphate synthase | |
| Gene Alias | GATD7 | |
| Cytomap | 3q25.31 | |
| Gene Type | protein-coding | GO ID | GO:0006082 | UniProtAcc | A0A140VJK6 |
Top |
Malignant transformation analysis |
| Identification of the aberrant gene expression in precancerous and cancerous lesions by comparing the gene expression of stem-like cells in diseased tissues with normal stem cells |
| Entrez ID | Symbol | Replicates | Species | Organ | Tissue | Adj P-value | Log2FC | Malignancy |
| 8833 | GMPS | GSM4909282 | Human | Breast | IDC | 4.61e-11 | 4.14e-01 | -0.0288 |
| 8833 | GMPS | GSM4909285 | Human | Breast | IDC | 4.27e-38 | 7.13e-01 | 0.21 |
| 8833 | GMPS | GSM4909287 | Human | Breast | IDC | 5.48e-06 | 3.17e-01 | 0.2057 |
| 8833 | GMPS | GSM4909293 | Human | Breast | IDC | 7.98e-06 | 2.20e-01 | 0.1581 |
| 8833 | GMPS | GSM4909297 | Human | Breast | IDC | 3.12e-03 | -5.68e-02 | 0.1517 |
| 8833 | GMPS | GSM4909311 | Human | Breast | IDC | 4.94e-08 | -1.49e-01 | 0.1534 |
| 8833 | GMPS | GSM4909319 | Human | Breast | IDC | 2.85e-12 | -1.17e-01 | 0.1563 |
| 8833 | GMPS | GSM4909321 | Human | Breast | IDC | 2.89e-04 | -7.85e-02 | 0.1559 |
| 8833 | GMPS | M2 | Human | Breast | IDC | 1.14e-02 | 2.49e-01 | 0.21 |
| 8833 | GMPS | NCCBC14 | Human | Breast | DCIS | 8.93e-07 | 2.83e-01 | 0.2021 |
| 8833 | GMPS | NCCBC5 | Human | Breast | DCIS | 1.58e-04 | 6.48e-03 | 0.2046 |
| 8833 | GMPS | P1 | Human | Breast | IDC | 2.70e-05 | 1.75e-02 | 0.1527 |
| 8833 | GMPS | P2 | Human | Breast | IDC | 1.01e-13 | 5.56e-01 | 0.21 |
| 8833 | GMPS | DCIS2 | Human | Breast | DCIS | 5.23e-47 | 2.22e-01 | 0.0085 |
| 8833 | GMPS | CCI_2 | Human | Cervix | CC | 6.32e-12 | 1.34e+00 | 0.5249 |
| 8833 | GMPS | CCI_3 | Human | Cervix | CC | 4.94e-08 | 6.61e-01 | 0.516 |
| 8833 | GMPS | Tumor | Human | Cervix | CC | 1.68e-06 | 2.64e-01 | 0.1241 |
| 8833 | GMPS | sample3 | Human | Cervix | CC | 7.86e-10 | 2.82e-01 | 0.1387 |
| 8833 | GMPS | T3 | Human | Cervix | CC | 2.88e-13 | 2.95e-01 | 0.1389 |
| 8833 | GMPS | LZE2T | Human | Esophagus | ESCC | 1.26e-07 | 1.07e+00 | 0.082 |
| Page: 1 2 3 4 5 6 7 |
| Tissue | Expression Dynamics | Abbreviation |
| Breast | 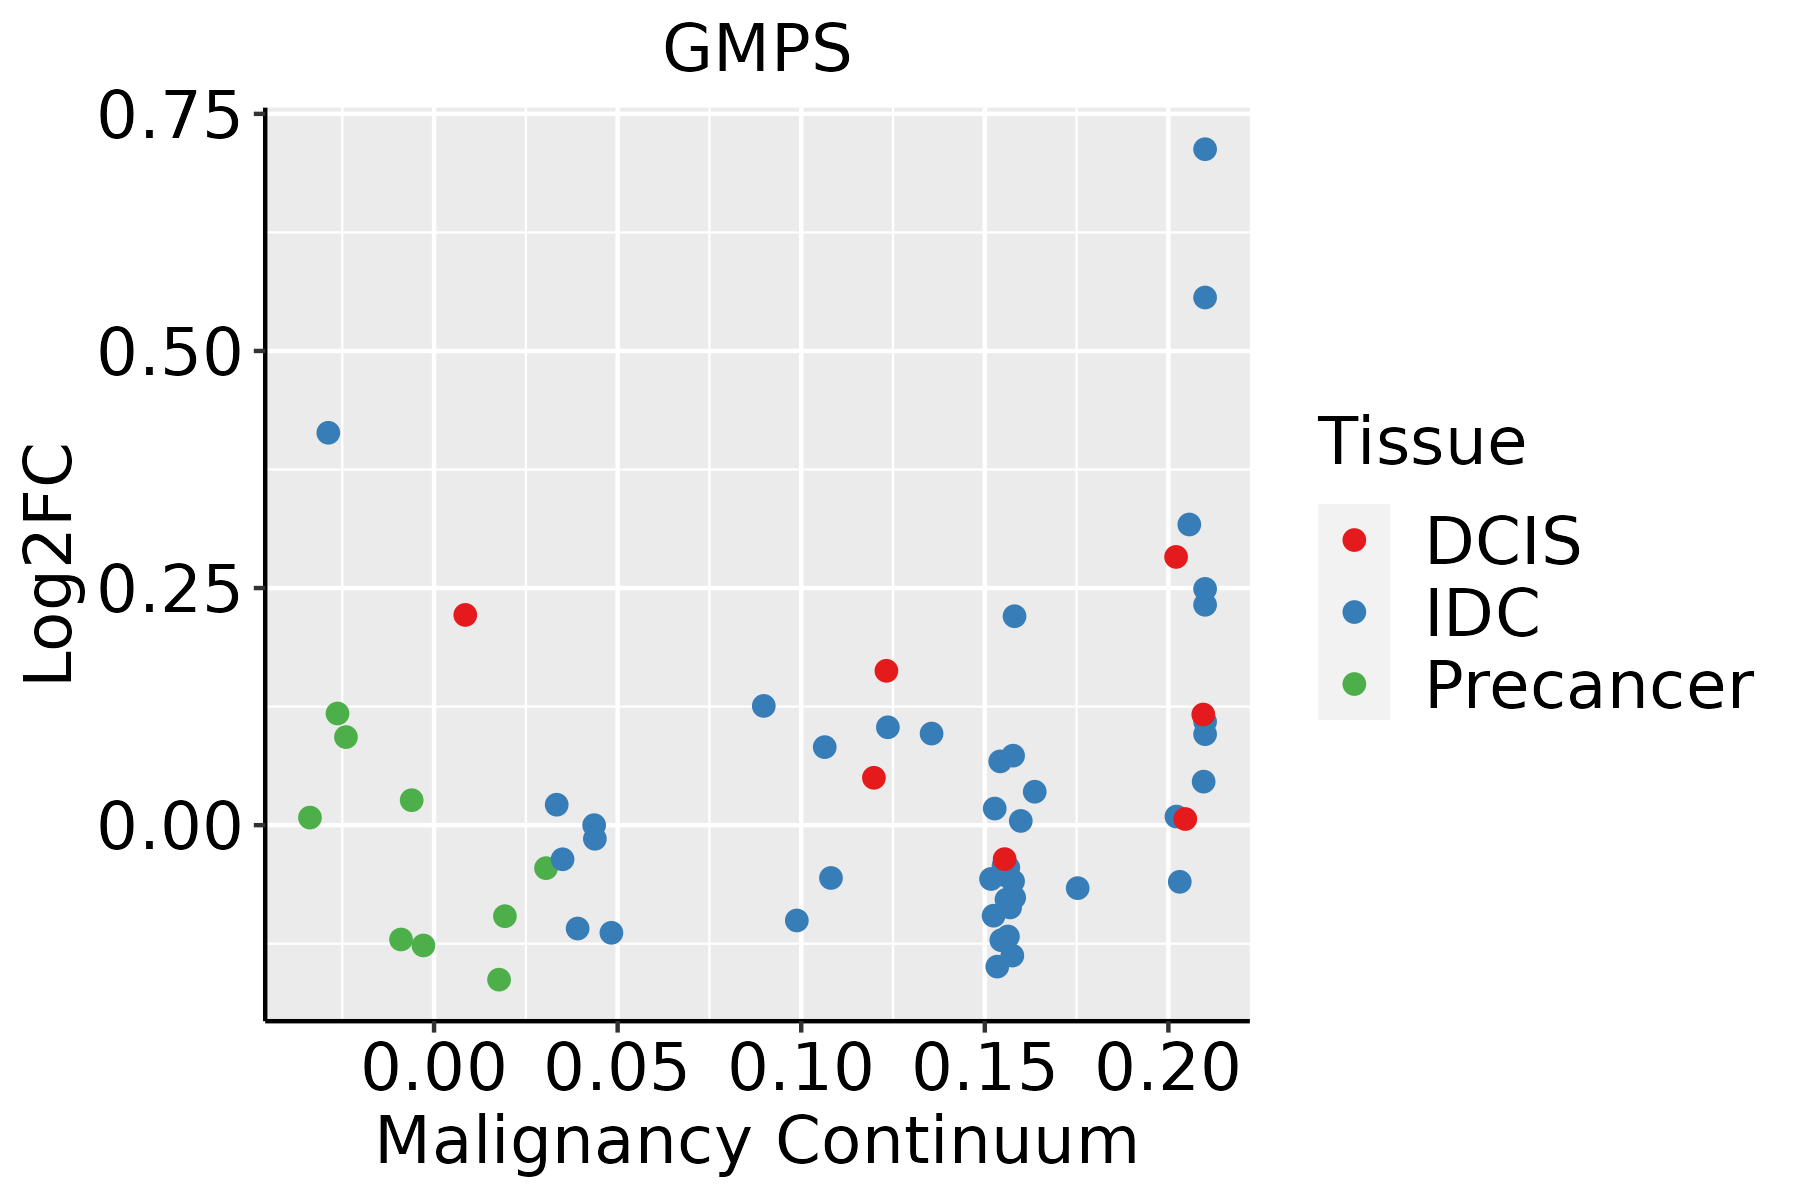 | IDC: Invasive ductal carcinoma |
| DCIS: Ductal carcinoma in situ | ||
| Precancer(BRCA1-mut): Precancerous lesion from BRCA1 mutation carriers | ||
| Cervix | 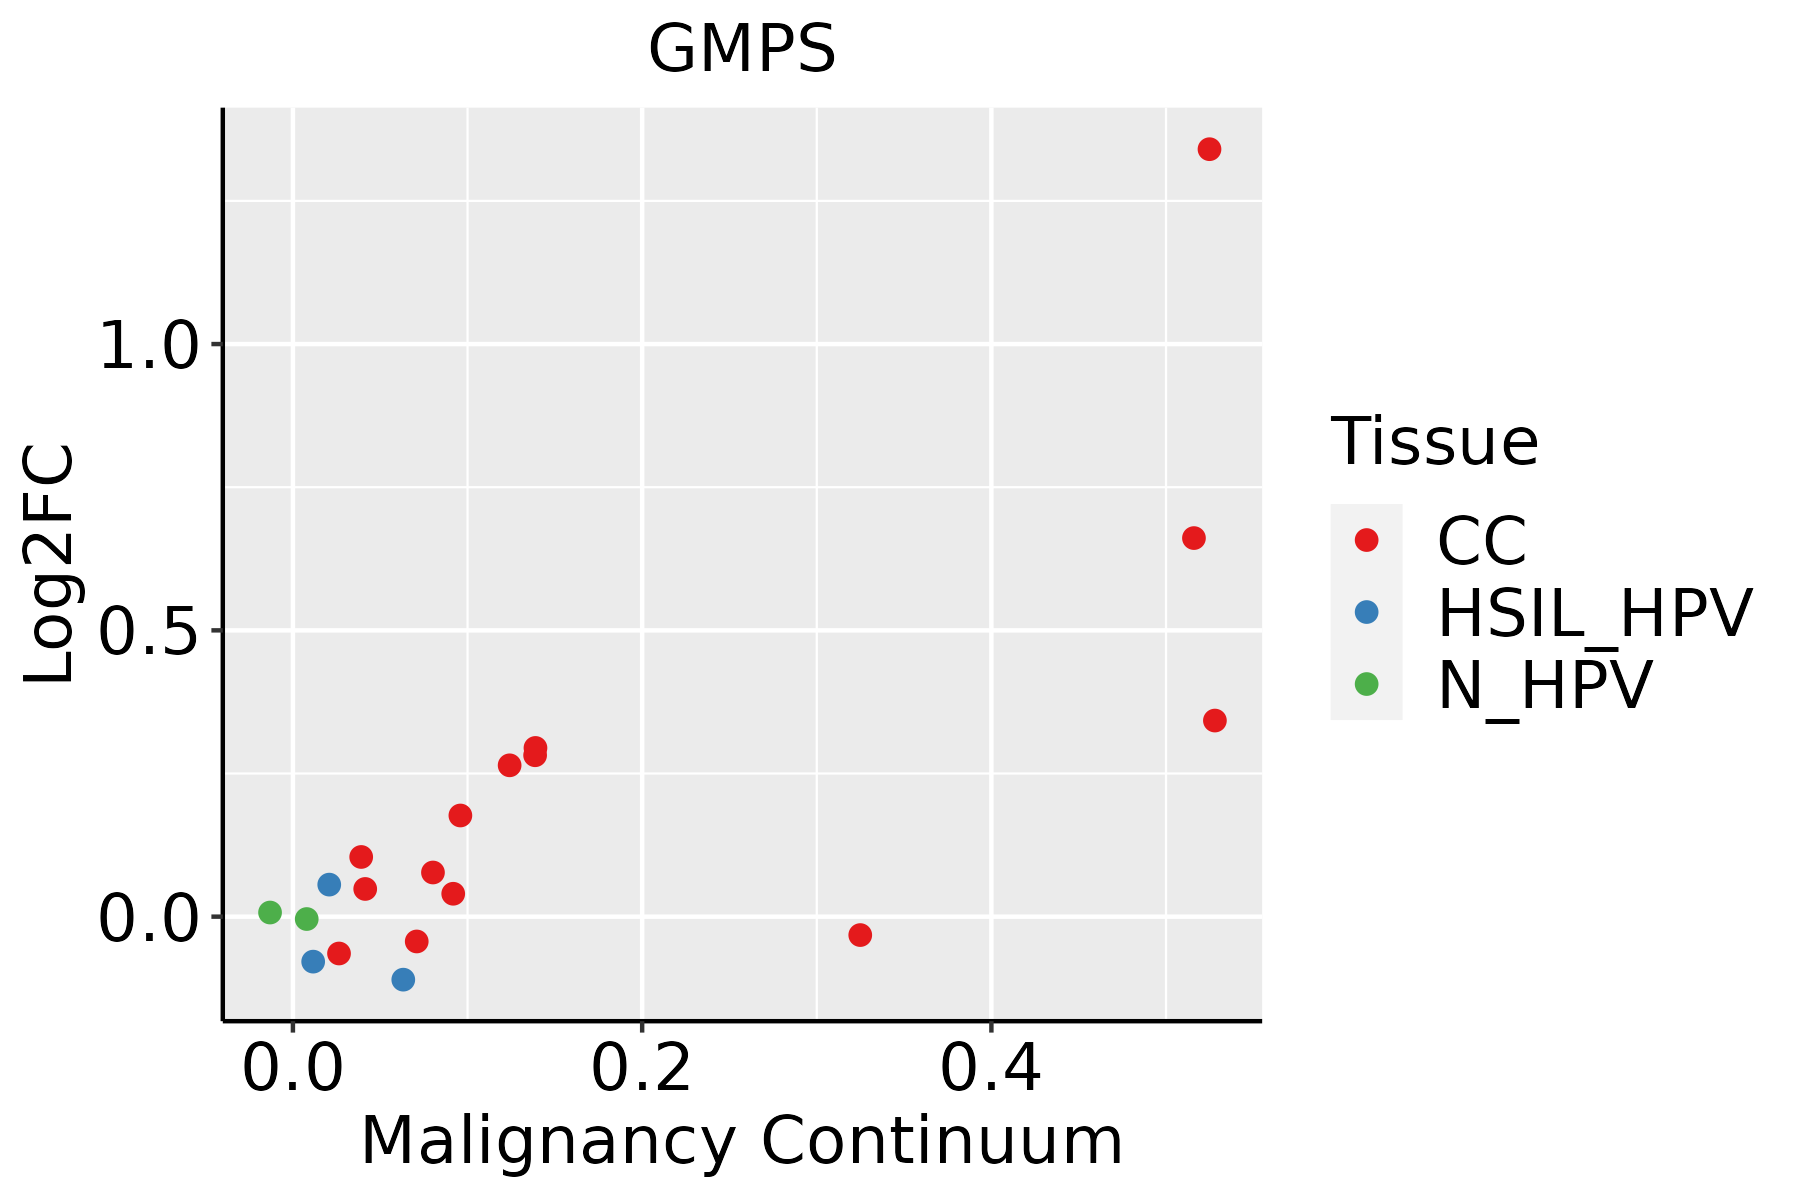 | CC: Cervix cancer |
| HSIL_HPV: HPV-infected high-grade squamous intraepithelial lesions | ||
| N_HPV: HPV-infected normal cervix | ||
| Esophagus | 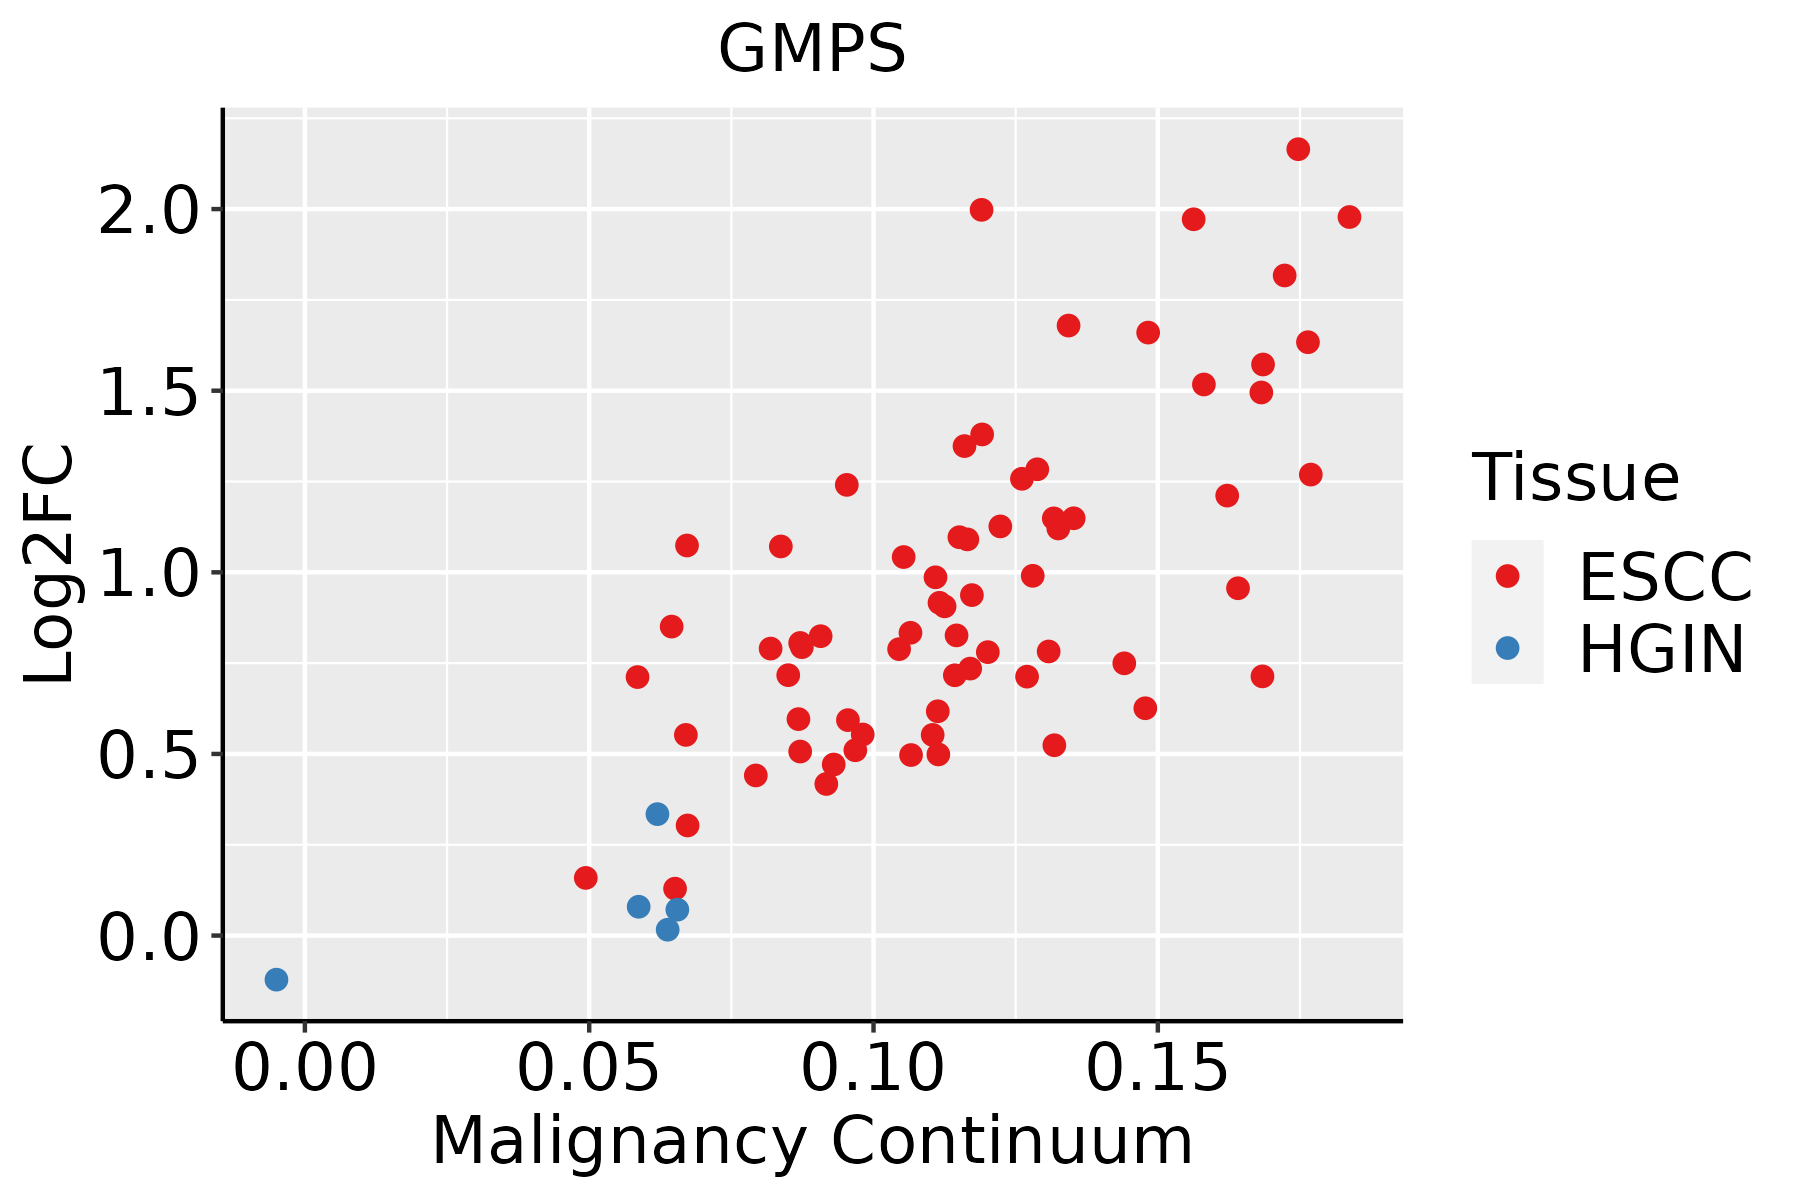 | ESCC: Esophageal squamous cell carcinoma |
| HGIN: High-grade intraepithelial neoplasias | ||
| LGIN: Low-grade intraepithelial neoplasias | ||
| Liver | 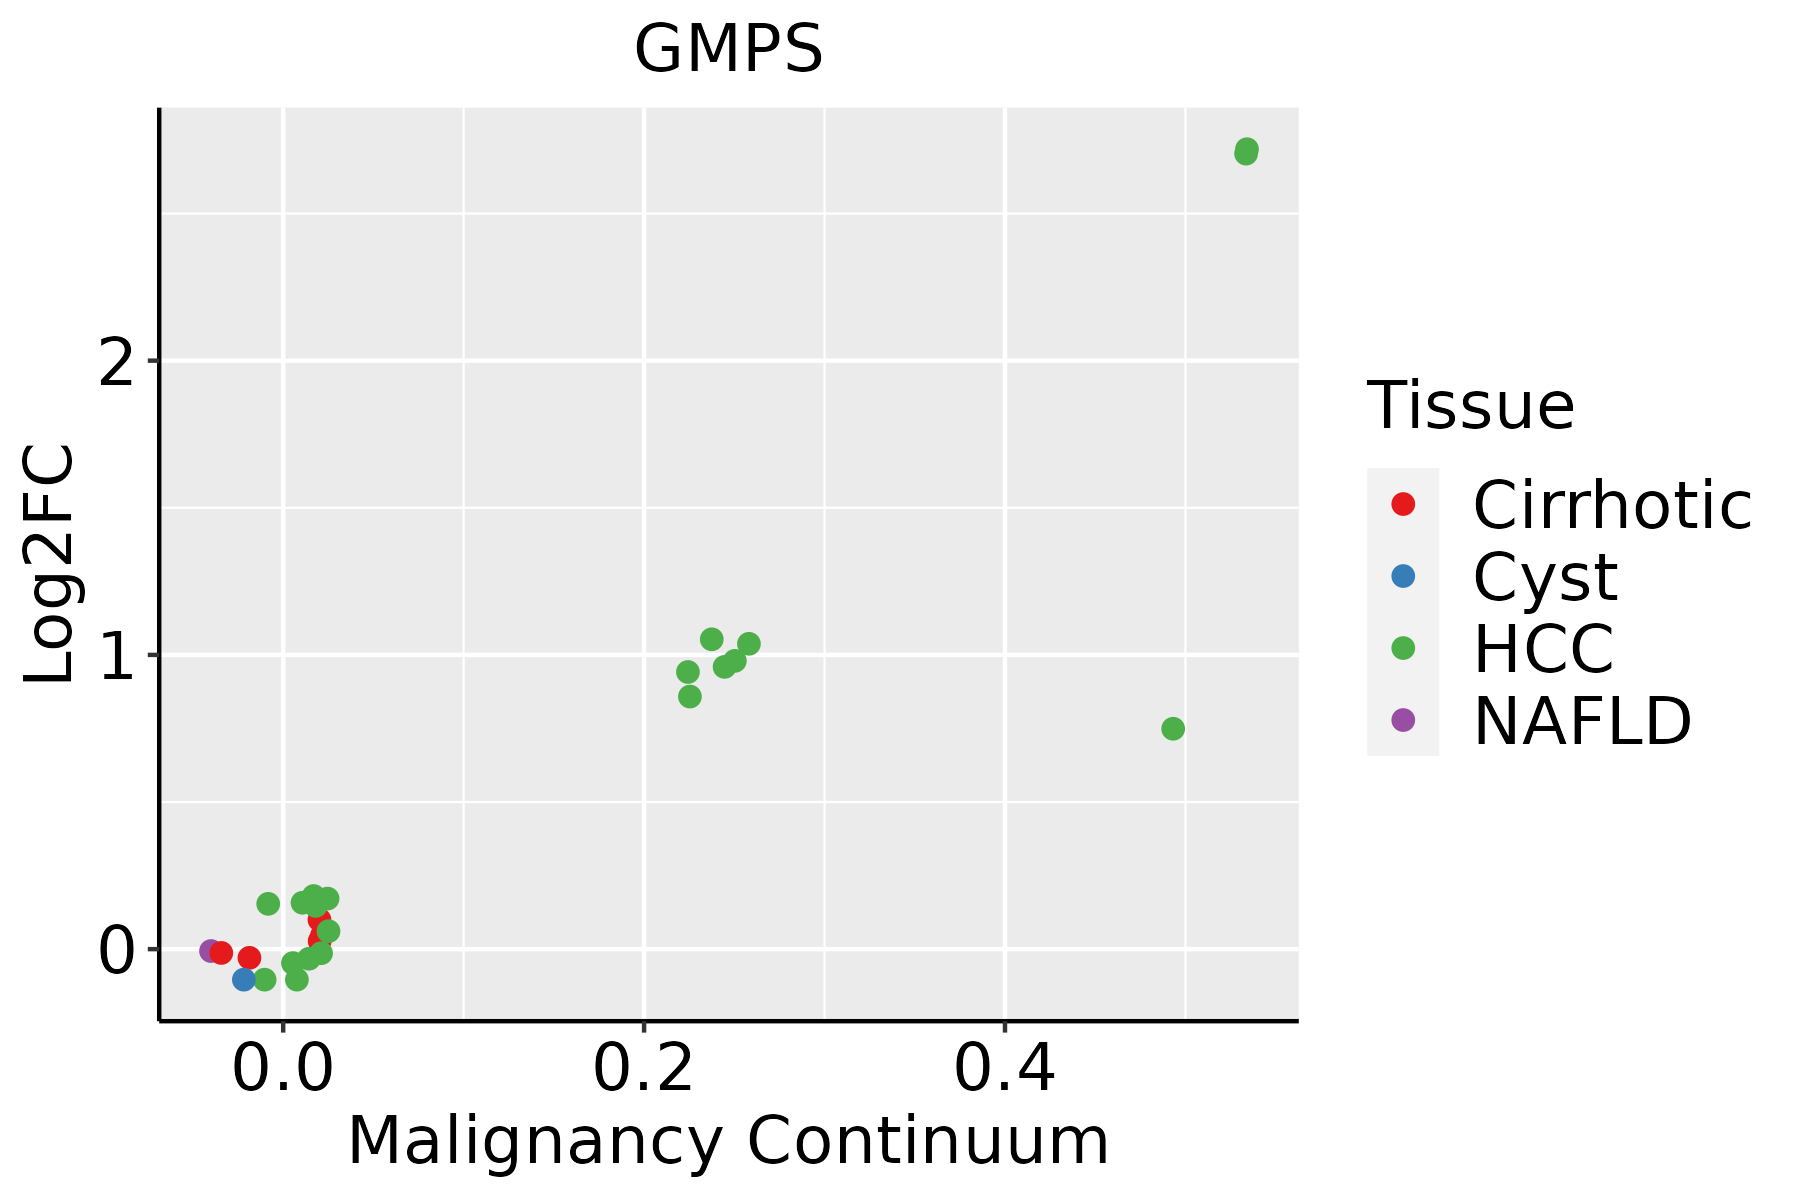 | HCC: Hepatocellular carcinoma |
| NAFLD: Non-alcoholic fatty liver disease | ||
| Oral Cavity | 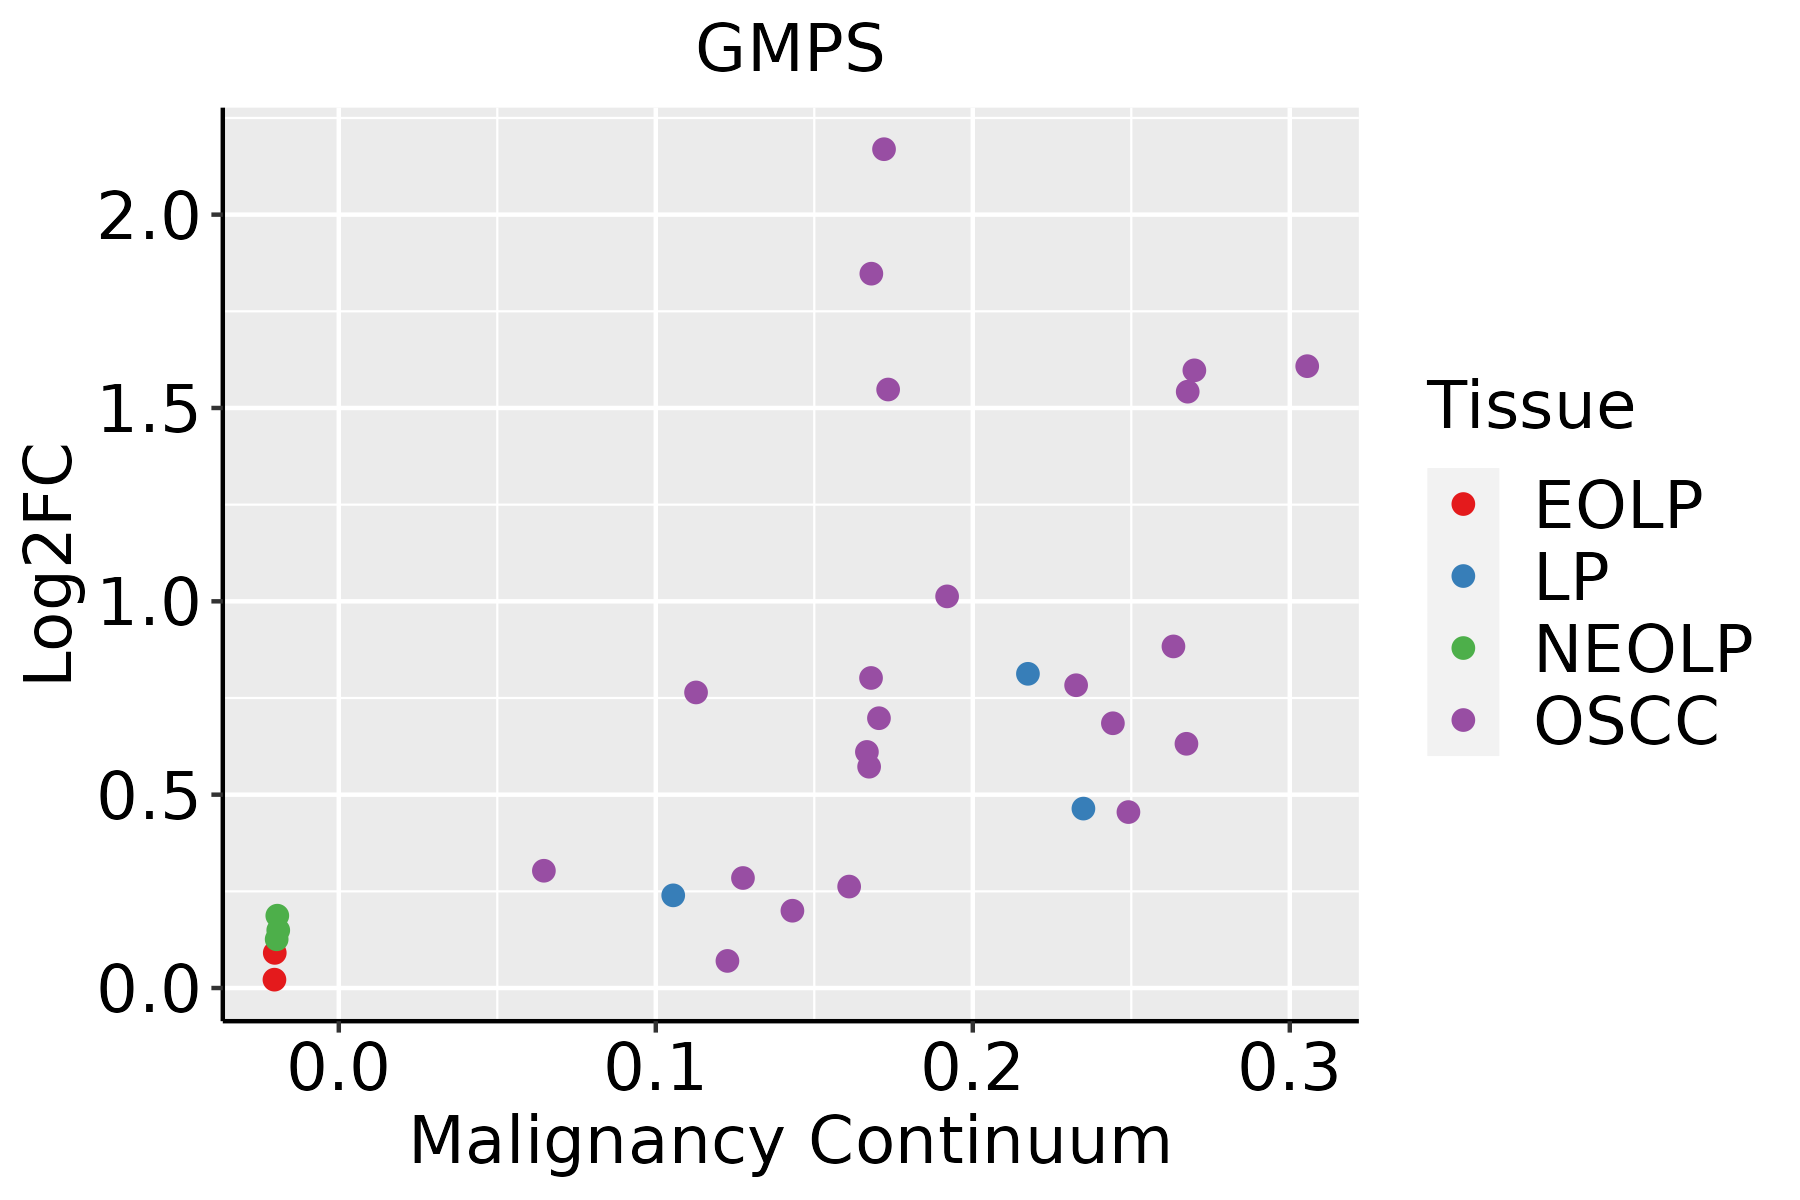 | EOLP: Erosive Oral lichen planus |
| LP: leukoplakia | ||
| NEOLP: Non-erosive oral lichen planus | ||
| OSCC: Oral squamous cell carcinoma | ||
| Skin | 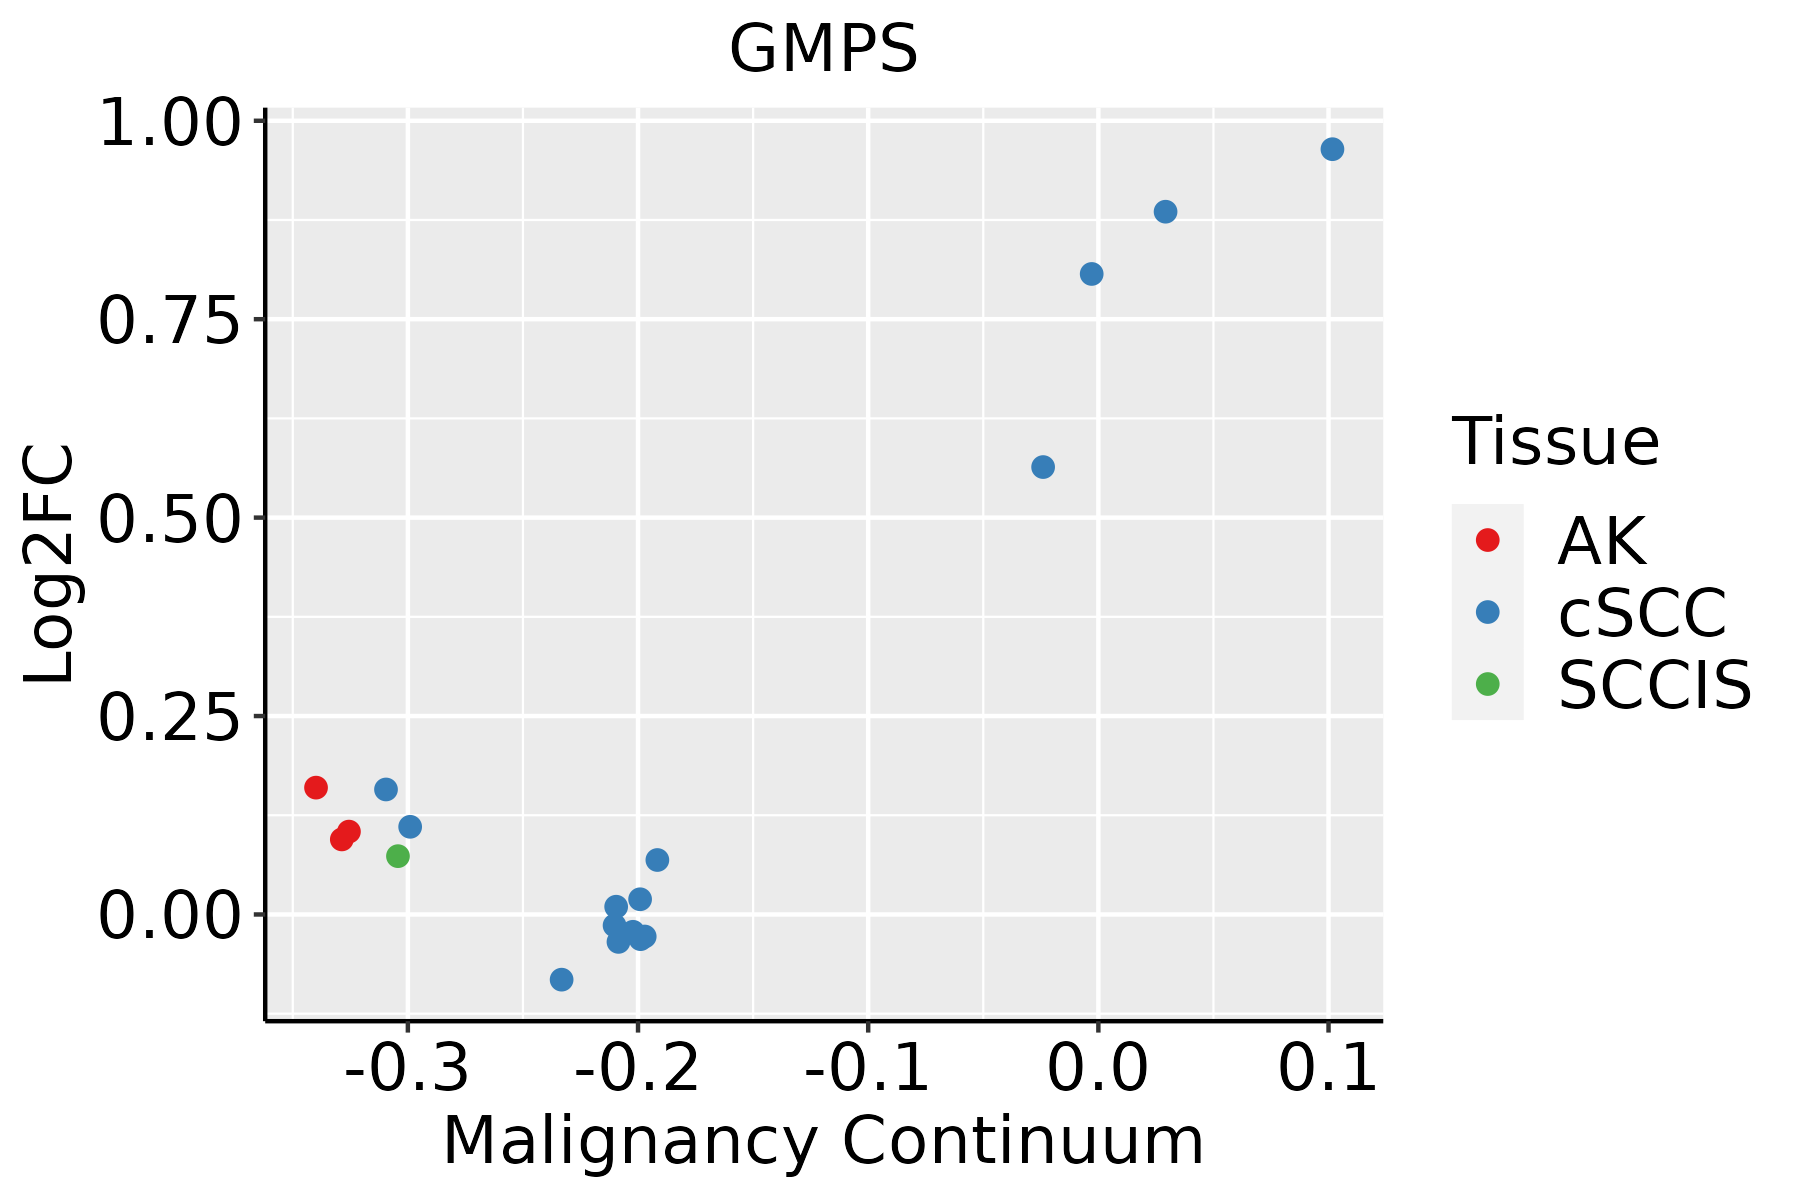 | AK: Actinic keratosis |
| cSCC: Cutaneous squamous cell carcinoma | ||
| SCCIS:squamous cell carcinoma in situ | ||
| Thyroid | 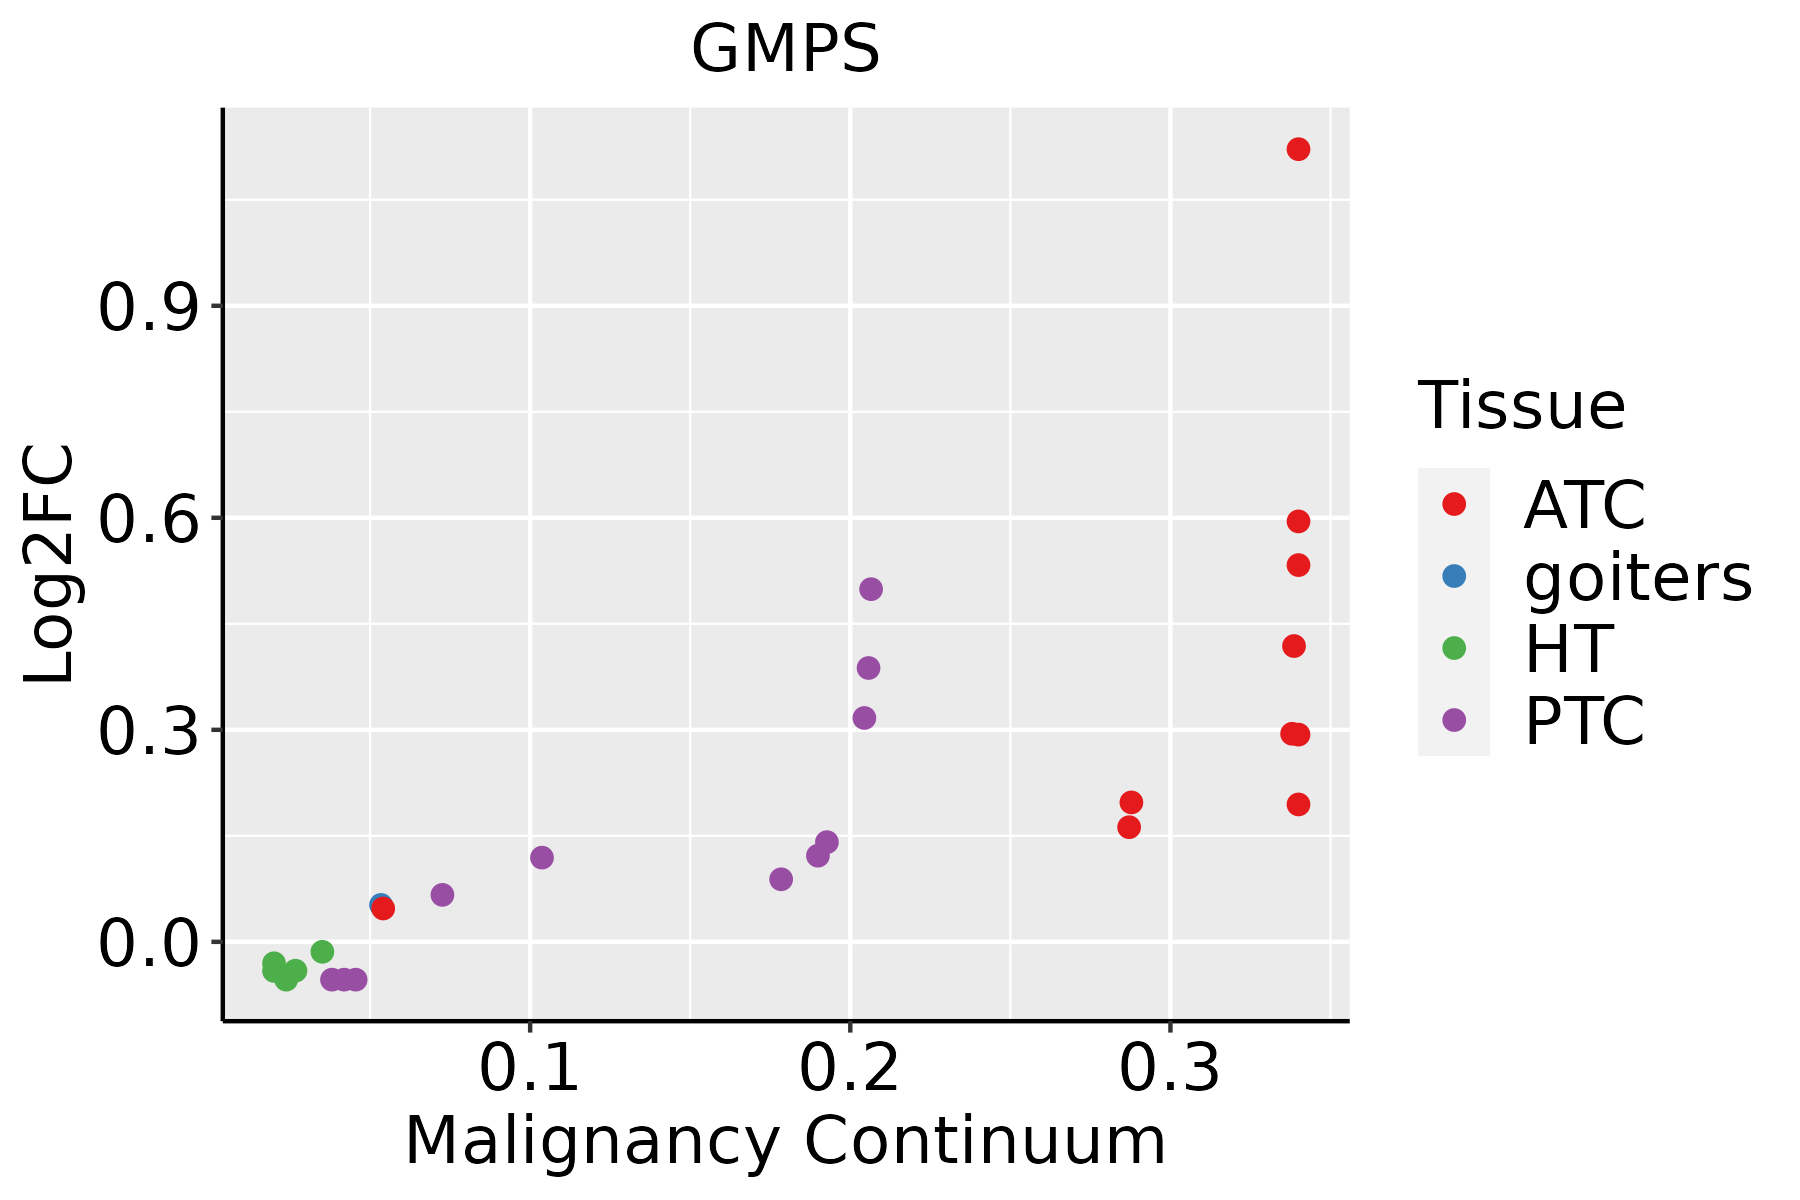 | ATC: Anaplastic thyroid cancer |
| HT: Hashimoto's thyroiditis | ||
| PTC: Papillary thyroid cancer |
| ∗log2FC in expression of this searched gene in stem-like cells from each diseased tissue sample relative to stem-like cells in normal samples in each tissue plotted against the malignancy continuum. Samples are colored based on if they are from different disease stage. |
Top |
Malignant transformation related pathway analysis |
| Find out the enriched GO biological processes and KEGG pathways involved in transition from healthy to precancer to cancer |
| Tissue | Disease Stage | Enriched GO biological Processes |
| Colorectum | AD |  |
| Colorectum | SER |  |
| Colorectum | MSS |  |
| Colorectum | MSI-H |  |
| Colorectum | FAP |  |
| ∗Top 15 enriched GO BP terms are showed in the bar plot of each disease state in each tissue. Each row represents a significant GO biological process which is colored according to the -log10(p.adjust). |
| Page: 1 2 3 4 5 6 7 8 9 |
| GO ID | Tissue | Disease Stage | Description | Gene Ratio | Bg Ratio | pvalue | p.adjust | Count |
| GO:00091563 | Esophagus | ESCC | ribonucleoside monophosphate biosynthetic process | 23/8552 | 33/18723 | 4.57e-03 | 1.78e-02 | 23 |
| GO:00091678 | Esophagus | ESCC | purine ribonucleoside monophosphate metabolic process | 27/8552 | 41/18723 | 7.31e-03 | 2.63e-02 | 27 |
| GO:00424401 | Esophagus | ESCC | pigment metabolic process | 50/8552 | 84/18723 | 7.34e-03 | 2.64e-02 | 50 |
| GO:00061444 | Esophagus | ESCC | purine nucleobase metabolic process | 14/8552 | 19/18723 | 1.27e-02 | 4.21e-02 | 14 |
| GO:00091273 | Esophagus | ESCC | purine nucleoside monophosphate biosynthetic process | 15/8552 | 21/18723 | 1.54e-02 | 4.96e-02 | 15 |
| GO:000911722 | Liver | HCC | nucleotide metabolic process | 300/7958 | 489/18723 | 1.61e-17 | 1.71e-15 | 300 |
| GO:000675322 | Liver | HCC | nucleoside phosphate metabolic process | 304/7958 | 497/18723 | 1.78e-17 | 1.85e-15 | 304 |
| GO:001969322 | Liver | HCC | ribose phosphate metabolic process | 248/7958 | 396/18723 | 3.15e-16 | 2.70e-14 | 248 |
| GO:000925922 | Liver | HCC | ribonucleotide metabolic process | 240/7958 | 385/18723 | 2.07e-15 | 1.51e-13 | 240 |
| GO:000915022 | Liver | HCC | purine ribonucleotide metabolic process | 226/7958 | 368/18723 | 1.36e-13 | 7.69e-12 | 226 |
| GO:007252122 | Liver | HCC | purine-containing compound metabolic process | 250/7958 | 416/18723 | 2.26e-13 | 1.24e-11 | 250 |
| GO:000616322 | Liver | HCC | purine nucleotide metabolic process | 236/7958 | 396/18723 | 3.59e-12 | 1.62e-10 | 236 |
| GO:19016052 | Liver | HCC | alpha-amino acid metabolic process | 124/7958 | 195/18723 | 2.07e-09 | 5.79e-08 | 124 |
| GO:00065202 | Liver | HCC | cellular amino acid metabolic process | 167/7958 | 284/18723 | 1.91e-08 | 4.56e-07 | 167 |
| GO:000916512 | Liver | HCC | nucleotide biosynthetic process | 150/7958 | 254/18723 | 6.79e-08 | 1.40e-06 | 150 |
| GO:190129312 | Liver | HCC | nucleoside phosphate biosynthetic process | 151/7958 | 256/18723 | 6.84e-08 | 1.41e-06 | 151 |
| GO:004639012 | Liver | HCC | ribose phosphate biosynthetic process | 116/7958 | 190/18723 | 1.79e-07 | 3.29e-06 | 116 |
| GO:000926012 | Liver | HCC | ribonucleotide biosynthetic process | 111/7958 | 182/18723 | 3.53e-07 | 6.03e-06 | 111 |
| GO:00091122 | Liver | HCC | nucleobase metabolic process | 28/7958 | 34/18723 | 2.21e-06 | 2.99e-05 | 28 |
| GO:000915212 | Liver | HCC | purine ribonucleotide biosynthetic process | 101/7958 | 169/18723 | 4.30e-06 | 5.50e-05 | 101 |
| Page: 1 2 3 4 5 6 7 8 9 10 |
| Pathway ID | Tissue | Disease Stage | Description | Gene Ratio | Bg Ratio | pvalue | p.adjust | qvalue | Count |
| hsa012325 | Esophagus | ESCC | Nucleotide metabolism | 59/4205 | 85/8465 | 1.67e-04 | 6.58e-04 | 3.37e-04 | 59 |
| hsa0123212 | Esophagus | ESCC | Nucleotide metabolism | 59/4205 | 85/8465 | 1.67e-04 | 6.58e-04 | 3.37e-04 | 59 |
| hsa012322 | Liver | HCC | Nucleotide metabolism | 59/4020 | 85/8465 | 3.30e-05 | 1.88e-04 | 1.04e-04 | 59 |
| hsa009832 | Liver | HCC | Drug metabolism - other enzymes | 54/4020 | 80/8465 | 2.25e-04 | 1.09e-03 | 6.08e-04 | 54 |
| hsa012323 | Liver | HCC | Nucleotide metabolism | 59/4020 | 85/8465 | 3.30e-05 | 1.88e-04 | 1.04e-04 | 59 |
| hsa009833 | Liver | HCC | Drug metabolism - other enzymes | 54/4020 | 80/8465 | 2.25e-04 | 1.09e-03 | 6.08e-04 | 54 |
| hsa012324 | Oral cavity | OSCC | Nucleotide metabolism | 54/3704 | 85/8465 | 1.78e-04 | 5.95e-04 | 3.03e-04 | 54 |
| hsa0123211 | Oral cavity | OSCC | Nucleotide metabolism | 54/3704 | 85/8465 | 1.78e-04 | 5.95e-04 | 3.03e-04 | 54 |
| Page: 1 |
Top |
Cell-cell communication analysis |
| Identification of potential cell-cell interactions between two cell types and their ligand-receptor pairs for different disease states |
| Ligand | Receptor | LRpair | Pathway | Tissue | Disease Stage |
| Page: 1 |
Top |
Single-cell gene regulatory network inference analysis |
| Find out the significant the regulons (TFs) and the target genes of each regulon across cell types for different disease states |
| TF | Cell Type | Tissue | Disease Stage | Target Gene | RSS | Regulon Activity |
| ∗The dot plots of a searched regulon are shown for all cell subpopulations in each disease state of each tissue based on the regulon specific score inferred using pySCENIC and by calculating the average expression. |
| Page: 1 |
Top |
Somatic mutation of malignant transformation related genes |
| Annotation of somatic variants for genes involved in malignant transformation |
| Hugo Symbol | Variant Class | Variant Classification | dbSNP RS | HGVSc | HGVSp | HGVSp Short | SWISSPROT | BIOTYPE | SIFT | PolyPhen | Tumor Sample Barcode | Tissue | Histology | Sex | Age | Stage | Therapy Types | Drugs | Outcome |
| GMPS | SNV | Missense_Mutation | c.472G>C | p.Asp158His | p.D158H | P49915 | protein_coding | tolerated(0.05) | benign(0.151) | TCGA-A2-A0CM-01 | Breast | breast invasive carcinoma | Female | <65 | I/II | Chemotherapy | adriamycin | PD | |
| GMPS | SNV | Missense_Mutation | c.420N>G | p.Phe140Leu | p.F140L | P49915 | protein_coding | deleterious(0) | possibly_damaging(0.784) | TCGA-AC-A23H-01 | Breast | breast invasive carcinoma | Female | >=65 | I/II | Unknown | Unknown | PD | |
| GMPS | SNV | Missense_Mutation | novel | c.207N>G | p.Phe69Leu | p.F69L | P49915 | protein_coding | tolerated(0.13) | benign(0.003) | TCGA-AN-A046-01 | Breast | breast invasive carcinoma | Female | >=65 | I/II | Unknown | Unknown | SD |
| GMPS | SNV | Missense_Mutation | c.1783N>C | p.Ala595Pro | p.A595P | P49915 | protein_coding | deleterious(0.01) | probably_damaging(0.988) | TCGA-D8-A1Y1-01 | Breast | breast invasive carcinoma | Female | >=65 | III/IV | Hormone Therapy | tamoxiphen | PD | |
| GMPS | SNV | Missense_Mutation | novel | c.91C>G | p.Leu31Val | p.L31V | P49915 | protein_coding | deleterious(0) | possibly_damaging(0.857) | TCGA-C5-A2LY-01 | Cervix | cervical & endocervical cancer | Female | <65 | I/II | Chemotherapy | cisplatin | SD |
| GMPS | SNV | Missense_Mutation | c.905N>T | p.Ser302Phe | p.S302F | P49915 | protein_coding | tolerated(0.06) | benign(0.127) | TCGA-DR-A0ZM-01 | Cervix | cervical & endocervical cancer | Female | <65 | III/IV | Unspecific | Cisplatin | SD | |
| GMPS | SNV | Missense_Mutation | rs879113982 | c.1913N>A | p.Arg638Gln | p.R638Q | P49915 | protein_coding | deleterious(0) | probably_damaging(1) | TCGA-EK-A2PG-01 | Cervix | cervical & endocervical cancer | Female | >=65 | I/II | Unknown | Unknown | SD |
| GMPS | SNV | Missense_Mutation | novel | c.380N>C | p.Gly127Ala | p.G127A | P49915 | protein_coding | deleterious(0.01) | probably_damaging(1) | TCGA-VS-A958-01 | Cervix | cervical & endocervical cancer | Female | <65 | I/II | Chemotherapy | cisplatin | CR |
| GMPS | SNV | Missense_Mutation | c.1711N>T | p.Pro571Ser | p.P571S | P49915 | protein_coding | tolerated(0.27) | benign(0.063) | TCGA-VS-A958-01 | Cervix | cervical & endocervical cancer | Female | <65 | I/II | Chemotherapy | cisplatin | CR | |
| GMPS | SNV | Missense_Mutation | c.2059N>A | p.Pro687Thr | p.P687T | P49915 | protein_coding | deleterious(0) | probably_damaging(1) | TCGA-AA-3710-01 | Colorectum | colon adenocarcinoma | Female | >=65 | I/II | Unknown | Unknown | SD |
| Page: 1 2 3 4 5 6 7 8 |
Top |
Related drugs of malignant transformation related genes |
| Identification of chemicals and drugs interact with genes involved in malignant transfromation |
| (DGIdb 4.0) |
| Entrez ID | Symbol | Category | Interaction Types | Drug Claim Name | Drug Name | PMIDs |
| Page: 1 |

Copyright 2023-Present -The University of Texas Health Science Center at Houston |