
|
|||||
|
 | |
| |
| |
| |
| |
| |
|
Gene: GLE1 |
Gene summary for GLE1 |
| Gene information | Species | Human | Gene symbol | GLE1 | Gene ID | 2733 |
| Gene name | GLE1 RNA export mediator | |
| Gene Alias | CAAHC | |
| Cytomap | 9q34.11 | |
| Gene Type | protein-coding | GO ID | GO:0006403 | UniProtAcc | Q53GS7 |
Top |
Malignant transformation analysis |
| Identification of the aberrant gene expression in precancerous and cancerous lesions by comparing the gene expression of stem-like cells in diseased tissues with normal stem cells |
| Entrez ID | Symbol | Replicates | Species | Organ | Tissue | Adj P-value | Log2FC | Malignancy |
| 2733 | GLE1 | LZE2T | Human | Esophagus | ESCC | 6.90e-03 | 3.34e-01 | 0.082 |
| 2733 | GLE1 | LZE4T | Human | Esophagus | ESCC | 3.09e-12 | 3.07e-01 | 0.0811 |
| 2733 | GLE1 | LZE7T | Human | Esophagus | ESCC | 4.46e-11 | 3.55e-01 | 0.0667 |
| 2733 | GLE1 | LZE8T | Human | Esophagus | ESCC | 1.28e-02 | 1.61e-01 | 0.067 |
| 2733 | GLE1 | LZE20T | Human | Esophagus | ESCC | 9.15e-08 | 2.84e-01 | 0.0662 |
| 2733 | GLE1 | LZE24T | Human | Esophagus | ESCC | 1.03e-07 | 2.31e-01 | 0.0596 |
| 2733 | GLE1 | P2T-E | Human | Esophagus | ESCC | 2.29e-30 | 4.83e-01 | 0.1177 |
| 2733 | GLE1 | P4T-E | Human | Esophagus | ESCC | 9.06e-06 | 1.55e-01 | 0.1323 |
| 2733 | GLE1 | P5T-E | Human | Esophagus | ESCC | 8.14e-11 | 1.12e-01 | 0.1327 |
| 2733 | GLE1 | P8T-E | Human | Esophagus | ESCC | 6.94e-26 | 4.47e-01 | 0.0889 |
| 2733 | GLE1 | P9T-E | Human | Esophagus | ESCC | 6.06e-10 | 2.12e-01 | 0.1131 |
| 2733 | GLE1 | P10T-E | Human | Esophagus | ESCC | 1.23e-16 | 1.89e-01 | 0.116 |
| 2733 | GLE1 | P11T-E | Human | Esophagus | ESCC | 4.52e-11 | 4.25e-01 | 0.1426 |
| 2733 | GLE1 | P12T-E | Human | Esophagus | ESCC | 8.88e-13 | 1.60e-01 | 0.1122 |
| 2733 | GLE1 | P15T-E | Human | Esophagus | ESCC | 6.51e-16 | 3.03e-01 | 0.1149 |
| 2733 | GLE1 | P16T-E | Human | Esophagus | ESCC | 2.37e-18 | 1.61e-01 | 0.1153 |
| 2733 | GLE1 | P17T-E | Human | Esophagus | ESCC | 6.57e-03 | 2.10e-01 | 0.1278 |
| 2733 | GLE1 | P19T-E | Human | Esophagus | ESCC | 4.71e-03 | 4.06e-01 | 0.1662 |
| 2733 | GLE1 | P20T-E | Human | Esophagus | ESCC | 3.65e-10 | 2.28e-01 | 0.1124 |
| 2733 | GLE1 | P21T-E | Human | Esophagus | ESCC | 6.69e-24 | 4.84e-01 | 0.1617 |
| Page: 1 2 3 4 |
| Tissue | Expression Dynamics | Abbreviation |
| Esophagus | 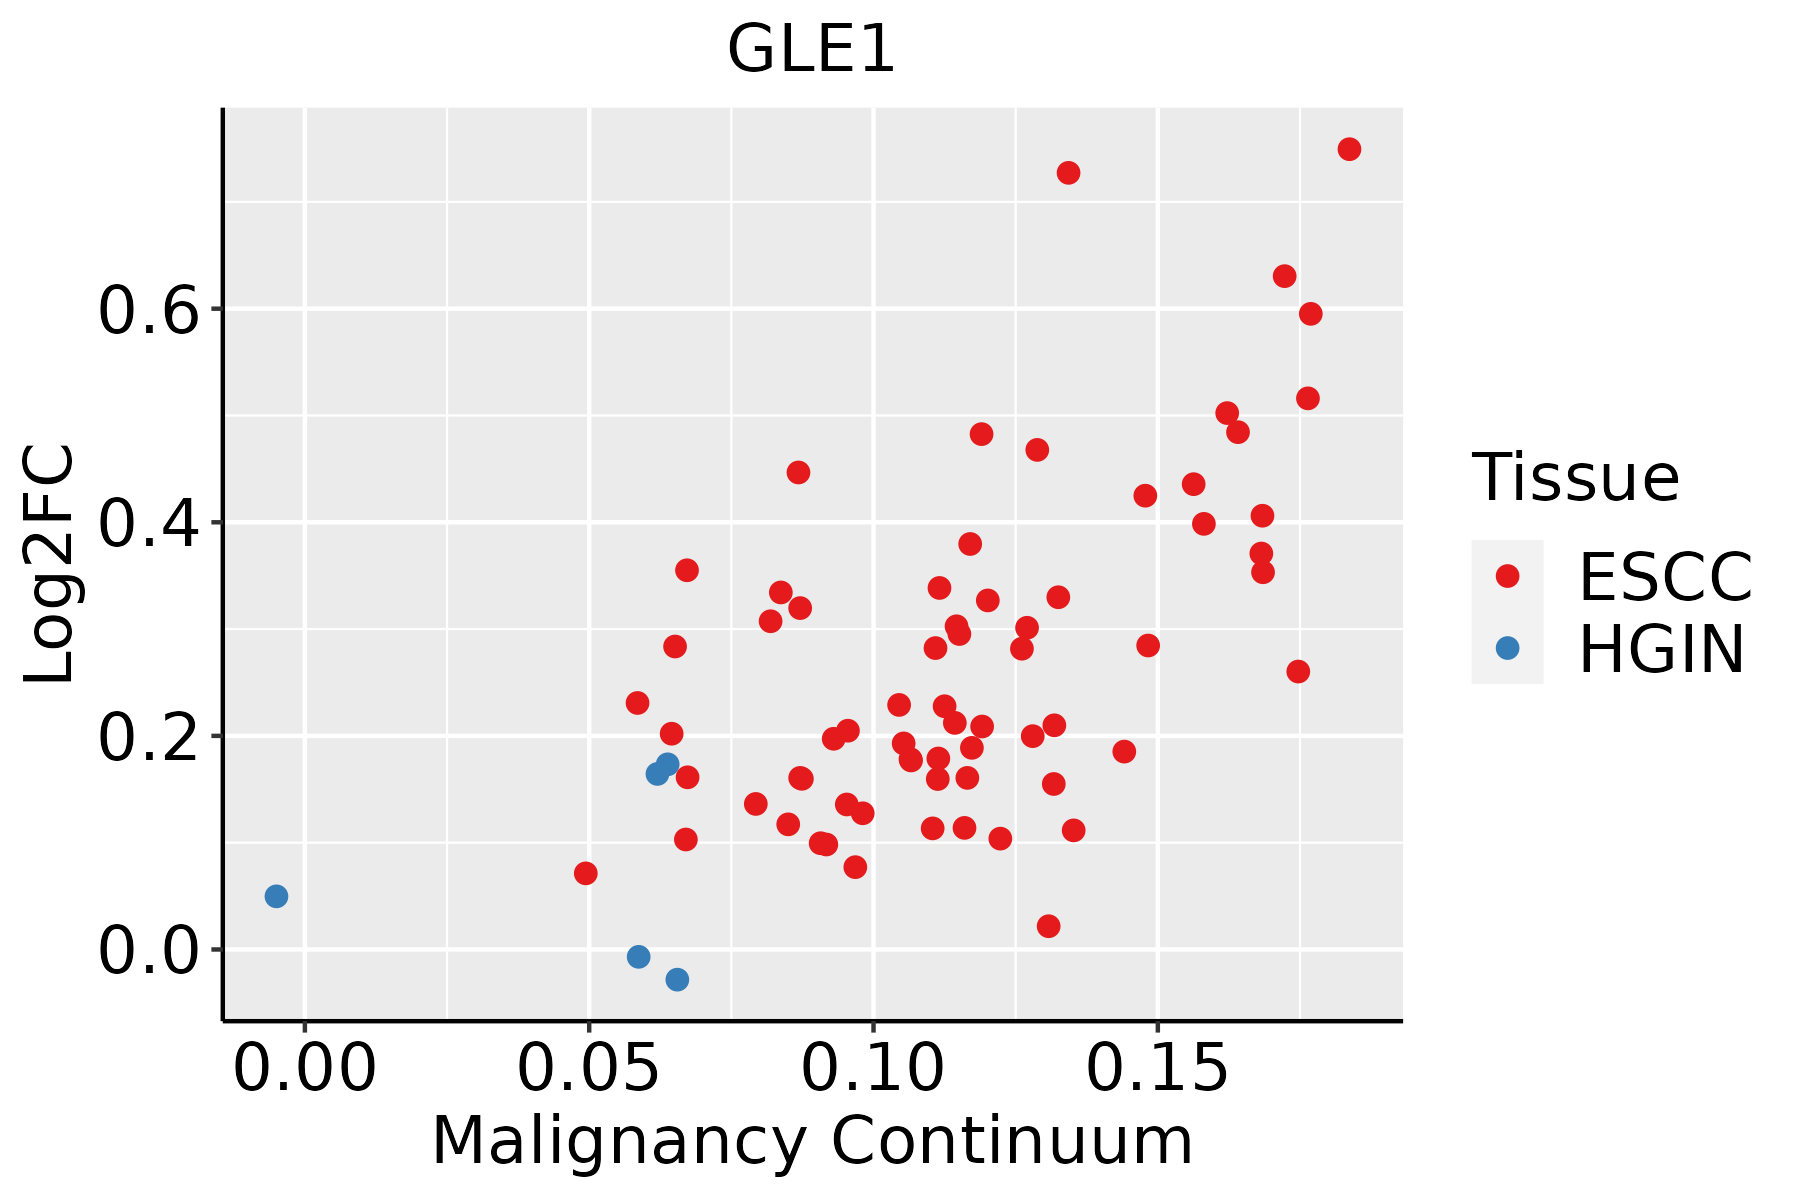 | ESCC: Esophageal squamous cell carcinoma |
| HGIN: High-grade intraepithelial neoplasias | ||
| LGIN: Low-grade intraepithelial neoplasias | ||
| Oral Cavity | 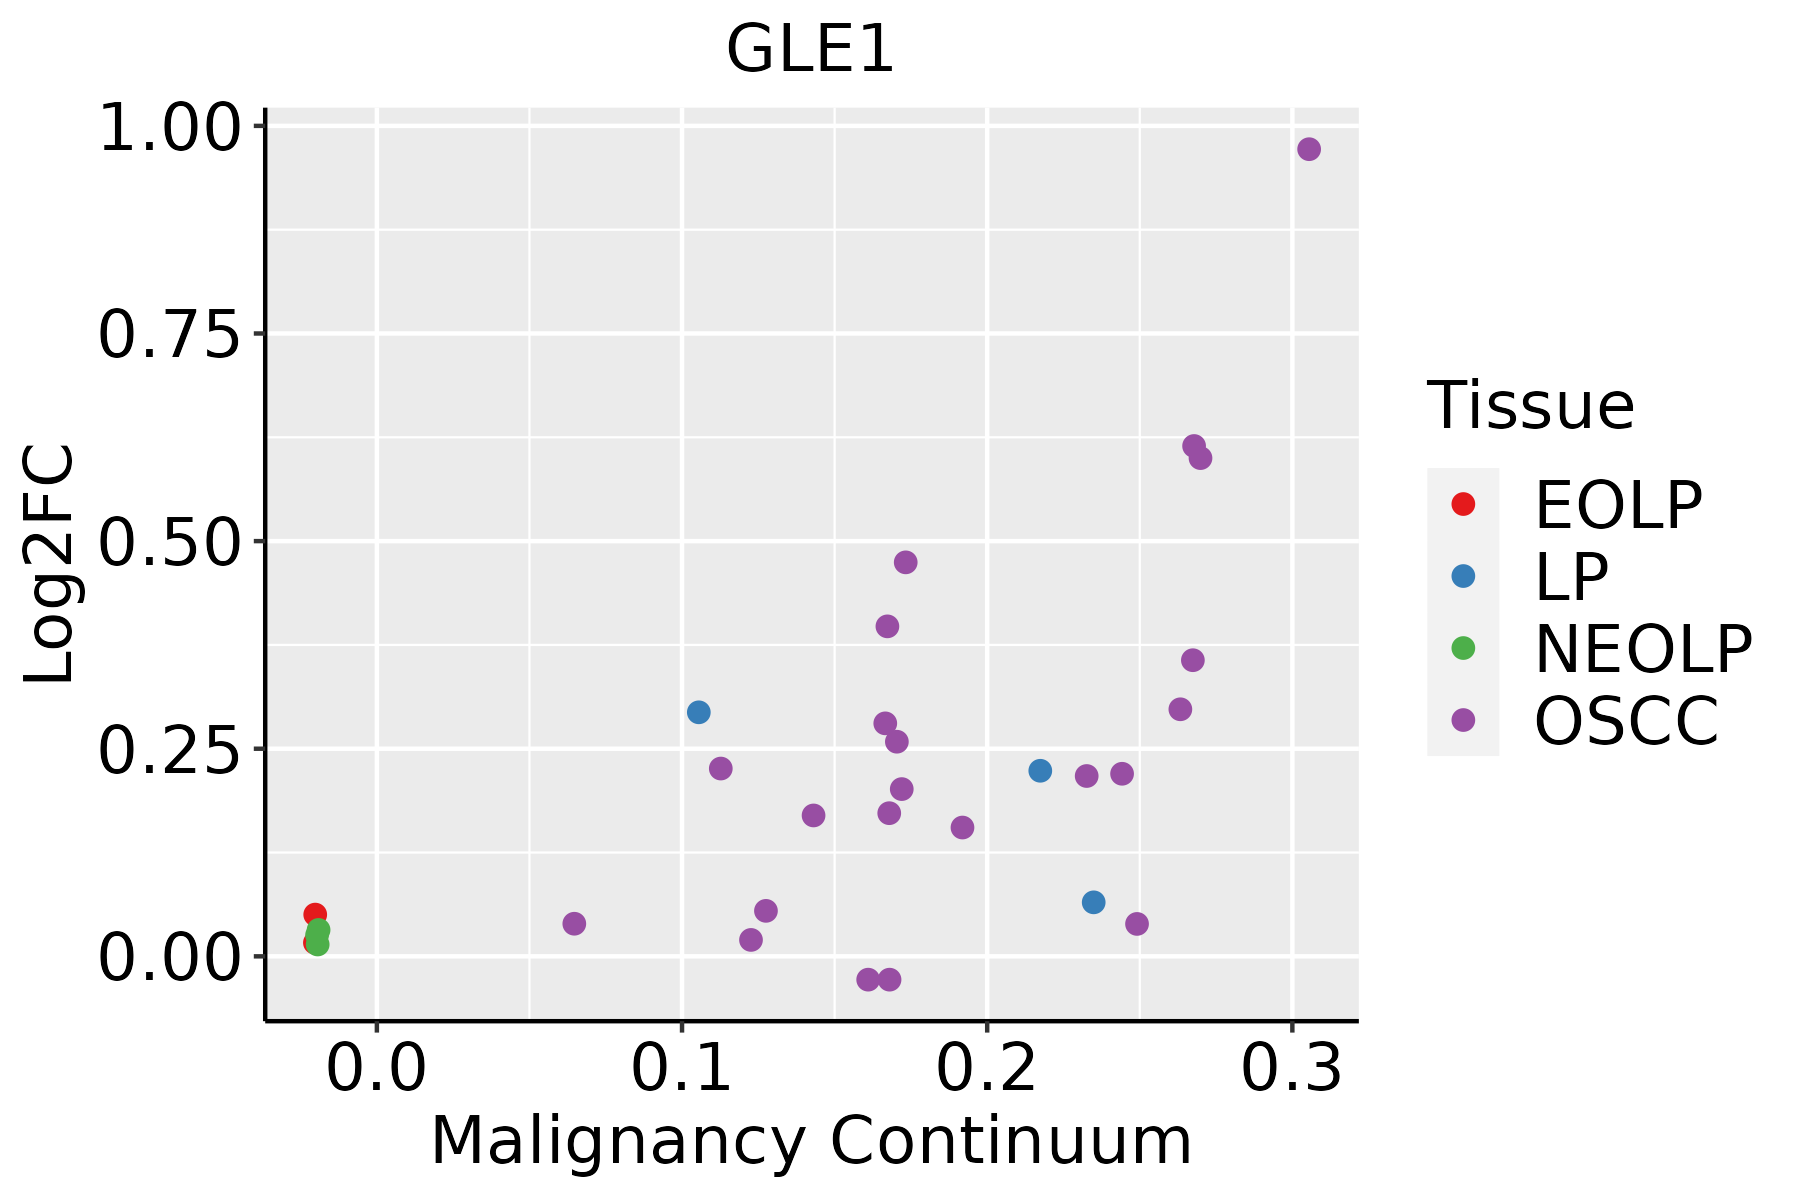 | EOLP: Erosive Oral lichen planus |
| LP: leukoplakia | ||
| NEOLP: Non-erosive oral lichen planus | ||
| OSCC: Oral squamous cell carcinoma | ||
| Skin |  | AK: Actinic keratosis |
| cSCC: Cutaneous squamous cell carcinoma | ||
| SCCIS:squamous cell carcinoma in situ |
| ∗log2FC in expression of this searched gene in stem-like cells from each diseased tissue sample relative to stem-like cells in normal samples in each tissue plotted against the malignancy continuum. Samples are colored based on if they are from different disease stage. |
Top |
Malignant transformation related pathway analysis |
| Find out the enriched GO biological processes and KEGG pathways involved in transition from healthy to precancer to cancer |
| Tissue | Disease Stage | Enriched GO biological Processes |
| Colorectum | AD |  |
| Colorectum | SER |  |
| Colorectum | MSS |  |
| Colorectum | MSI-H |  |
| Colorectum | FAP |  |
| ∗Top 15 enriched GO BP terms are showed in the bar plot of each disease state in each tissue. Each row represents a significant GO biological process which is colored according to the -log10(p.adjust). |
| Page: 1 2 3 4 5 6 7 8 9 |
| GO ID | Tissue | Disease Stage | Description | Gene Ratio | Bg Ratio | pvalue | p.adjust | Count |
| GO:007142613 | Skin | cSCC | ribonucleoprotein complex export from nucleus | 48/4864 | 76/18723 | 9.76e-12 | 4.97e-10 | 48 |
| GO:003298418 | Skin | cSCC | protein-containing complex disassembly | 98/4864 | 224/18723 | 5.31e-09 | 1.77e-07 | 98 |
| GO:000640513 | Skin | cSCC | RNA export from nucleus | 46/4864 | 84/18723 | 1.89e-08 | 5.56e-07 | 46 |
| GO:003150315 | Skin | cSCC | protein-containing complex localization | 95/4864 | 220/18723 | 2.00e-08 | 5.82e-07 | 95 |
| GO:000640612 | Skin | cSCC | mRNA export from nucleus | 34/4864 | 59/18723 | 2.59e-07 | 5.33e-06 | 34 |
| GO:007142712 | Skin | cSCC | mRNA-containing ribonucleoprotein complex export from nucleus | 34/4864 | 59/18723 | 2.59e-07 | 5.33e-06 | 34 |
| GO:004362411 | Skin | cSCC | cellular protein complex disassembly | 49/4864 | 136/18723 | 6.00e-03 | 2.95e-02 | 49 |
| Page: 1 2 3 4 |
| Pathway ID | Tissue | Disease Stage | Description | Gene Ratio | Bg Ratio | pvalue | p.adjust | qvalue | Count |
| hsa05014210 | Esophagus | ESCC | Amyotrophic lateral sclerosis | 266/4205 | 364/8465 | 1.31e-20 | 2.20e-18 | 1.13e-18 | 266 |
| hsa0301321 | Esophagus | ESCC | Nucleocytoplasmic transport | 89/4205 | 108/8465 | 1.20e-12 | 2.37e-11 | 1.21e-11 | 89 |
| hsa0301524 | Esophagus | ESCC | mRNA surveillance pathway | 72/4205 | 97/8465 | 6.12e-07 | 4.10e-06 | 2.10e-06 | 72 |
| hsa0501438 | Esophagus | ESCC | Amyotrophic lateral sclerosis | 266/4205 | 364/8465 | 1.31e-20 | 2.20e-18 | 1.13e-18 | 266 |
| hsa0301331 | Esophagus | ESCC | Nucleocytoplasmic transport | 89/4205 | 108/8465 | 1.20e-12 | 2.37e-11 | 1.21e-11 | 89 |
| hsa0301534 | Esophagus | ESCC | mRNA surveillance pathway | 72/4205 | 97/8465 | 6.12e-07 | 4.10e-06 | 2.10e-06 | 72 |
| hsa0501428 | Oral cavity | OSCC | Amyotrophic lateral sclerosis | 246/3704 | 364/8465 | 6.65e-21 | 1.11e-18 | 5.67e-19 | 246 |
| hsa030136 | Oral cavity | OSCC | Nucleocytoplasmic transport | 82/3704 | 108/8465 | 7.93e-12 | 1.33e-10 | 6.77e-11 | 82 |
| hsa030158 | Oral cavity | OSCC | mRNA surveillance pathway | 75/3704 | 97/8465 | 1.30e-11 | 2.01e-10 | 1.02e-10 | 75 |
| hsa05014112 | Oral cavity | OSCC | Amyotrophic lateral sclerosis | 246/3704 | 364/8465 | 6.65e-21 | 1.11e-18 | 5.67e-19 | 246 |
| hsa0301311 | Oral cavity | OSCC | Nucleocytoplasmic transport | 82/3704 | 108/8465 | 7.93e-12 | 1.33e-10 | 6.77e-11 | 82 |
| hsa0301513 | Oral cavity | OSCC | mRNA surveillance pathway | 75/3704 | 97/8465 | 1.30e-11 | 2.01e-10 | 1.02e-10 | 75 |
| Page: 1 |
Top |
Cell-cell communication analysis |
| Identification of potential cell-cell interactions between two cell types and their ligand-receptor pairs for different disease states |
| Ligand | Receptor | LRpair | Pathway | Tissue | Disease Stage |
| Page: 1 |
Top |
Single-cell gene regulatory network inference analysis |
| Find out the significant the regulons (TFs) and the target genes of each regulon across cell types for different disease states |
| TF | Cell Type | Tissue | Disease Stage | Target Gene | RSS | Regulon Activity |
| ∗The dot plots of a searched regulon are shown for all cell subpopulations in each disease state of each tissue based on the regulon specific score inferred using pySCENIC and by calculating the average expression. |
| Page: 1 |
Top |
Somatic mutation of malignant transformation related genes |
| Annotation of somatic variants for genes involved in malignant transformation |
| Hugo Symbol | Variant Class | Variant Classification | dbSNP RS | HGVSc | HGVSp | HGVSp Short | SWISSPROT | BIOTYPE | SIFT | PolyPhen | Tumor Sample Barcode | Tissue | Histology | Sex | Age | Stage | Therapy Types | Drugs | Outcome |
| GLE1 | SNV | Missense_Mutation | rs373915964 | c.406N>A | p.Glu136Lys | p.E136K | Q53GS7 | protein_coding | deleterious(0.01) | benign(0.07) | TCGA-AN-A046-01 | Breast | breast invasive carcinoma | Female | >=65 | I/II | Unknown | Unknown | SD |
| GLE1 | SNV | Missense_Mutation | novel | c.184N>A | p.Glu62Lys | p.E62K | Q53GS7 | protein_coding | tolerated(0.4) | benign(0) | TCGA-AR-A250-01 | Breast | breast invasive carcinoma | Female | <65 | I/II | Chemotherapy | doxorubicin | SD |
| GLE1 | SNV | Missense_Mutation | novel | c.137N>T | p.Ser46Phe | p.S46F | Q53GS7 | protein_coding | deleterious(0.01) | benign(0.028) | TCGA-BH-A2L8-01 | Breast | breast invasive carcinoma | Female | <65 | I/II | Chemotherapy | cytoxan | CR |
| GLE1 | deletion | Frame_Shift_Del | c.371delN | p.Ile126SerfsTer16 | p.I126Sfs*16 | Q53GS7 | protein_coding | TCGA-2W-A8YY-01 | Cervix | cervical & endocervical cancer | Female | <65 | I/II | Chemotherapy | cisplatin | CR | |||
| GLE1 | SNV | Missense_Mutation | rs778694188 | c.1930N>C | p.Met644Leu | p.M644L | Q53GS7 | protein_coding | tolerated(1) | benign(0.003) | TCGA-AA-3821-01 | Colorectum | colon adenocarcinoma | Female | >=65 | I/II | Unknown | Unknown | SD |
| GLE1 | SNV | Missense_Mutation | novel | c.209N>T | p.Ser70Leu | p.S70L | Q53GS7 | protein_coding | deleterious(0.05) | benign(0.019) | TCGA-AA-3861-01 | Colorectum | colon adenocarcinoma | Male | >=65 | I/II | Unknown | Unknown | SD |
| GLE1 | SNV | Missense_Mutation | novel | c.886N>T | p.Ala296Ser | p.A296S | Q53GS7 | protein_coding | tolerated(0.25) | benign(0.003) | TCGA-AA-3947-01 | Colorectum | colon adenocarcinoma | Female | <65 | I/II | Unknown | Unknown | SD |
| GLE1 | SNV | Missense_Mutation | novel | c.500A>C | p.Glu167Ala | p.E167A | Q53GS7 | protein_coding | deleterious(0) | possibly_damaging(0.906) | TCGA-AA-A00N-01 | Colorectum | colon adenocarcinoma | Male | >=65 | I/II | Unknown | Unknown | PD |
| GLE1 | SNV | Missense_Mutation | novel | c.800A>G | p.Gln267Arg | p.Q267R | Q53GS7 | protein_coding | tolerated(0.74) | benign(0.003) | TCGA-CA-6717-01 | Colorectum | colon adenocarcinoma | Male | <65 | I/II | Chemotherapy | oxaliplatin | CR |
| GLE1 | SNV | Missense_Mutation | c.173N>T | p.Pro58Leu | p.P58L | Q53GS7 | protein_coding | deleterious(0.01) | benign(0.054) | TCGA-CK-5913-01 | Colorectum | colon adenocarcinoma | Female | <65 | I/II | Unknown | Unknown | SD |
| Page: 1 2 3 4 5 6 |
Top |
Related drugs of malignant transformation related genes |
| Identification of chemicals and drugs interact with genes involved in malignant transfromation |
| (DGIdb 4.0) |
| Entrez ID | Symbol | Category | Interaction Types | Drug Claim Name | Drug Name | PMIDs |
| Page: 1 |

Copyright 2023-Present -The University of Texas Health Science Center at Houston |