
|
|||||
|
 | |
| |
| |
| |
| |
| |
|
Gene: GAK |
Gene summary for GAK |
| Gene information | Species | Human | Gene symbol | GAK | Gene ID | 2580 |
| Gene name | cyclin G associated kinase | |
| Gene Alias | DNAJ26 | |
| Cytomap | 4p16.3 | |
| Gene Type | protein-coding | GO ID | GO:0006457 | UniProtAcc | B4DS37 |
Top |
Malignant transformation analysis |
| Identification of the aberrant gene expression in precancerous and cancerous lesions by comparing the gene expression of stem-like cells in diseased tissues with normal stem cells |
| Entrez ID | Symbol | Replicates | Species | Organ | Tissue | Adj P-value | Log2FC | Malignancy |
| 2580 | GAK | HTA11_347_2000001011 | Human | Colorectum | AD | 4.18e-06 | 4.77e-01 | -0.1954 |
| 2580 | GAK | HTA11_696_2000001011 | Human | Colorectum | AD | 7.09e-10 | 5.31e-01 | -0.1464 |
| 2580 | GAK | HTA11_8622_2000001021 | Human | Colorectum | SER | 8.14e-03 | 1.13e-01 | 0.0528 |
| 2580 | GAK | A015-C-203 | Human | Colorectum | FAP | 1.07e-15 | 1.46e-01 | -0.1294 |
| 2580 | GAK | A015-C-204 | Human | Colorectum | FAP | 2.01e-03 | 5.05e-02 | -0.0228 |
| 2580 | GAK | A002-C-201 | Human | Colorectum | FAP | 8.21e-09 | 1.77e-01 | 0.0324 |
| 2580 | GAK | A001-C-119 | Human | Colorectum | FAP | 1.90e-05 | 2.65e-01 | -0.1557 |
| 2580 | GAK | A001-C-108 | Human | Colorectum | FAP | 3.36e-10 | 2.26e-01 | -0.0272 |
| 2580 | GAK | A002-C-205 | Human | Colorectum | FAP | 6.40e-16 | 1.68e-01 | -0.1236 |
| 2580 | GAK | A001-C-104 | Human | Colorectum | FAP | 3.80e-02 | 2.41e-01 | 0.0184 |
| 2580 | GAK | A015-C-006 | Human | Colorectum | FAP | 2.84e-14 | 3.51e-01 | -0.0994 |
| 2580 | GAK | A015-C-106 | Human | Colorectum | FAP | 9.57e-12 | 2.35e-01 | -0.0511 |
| 2580 | GAK | A002-C-114 | Human | Colorectum | FAP | 6.64e-15 | 2.53e-01 | -0.1561 |
| 2580 | GAK | A015-C-104 | Human | Colorectum | FAP | 3.46e-24 | 2.90e-01 | -0.1899 |
| 2580 | GAK | A001-C-014 | Human | Colorectum | FAP | 1.74e-07 | 9.13e-02 | 0.0135 |
| 2580 | GAK | A002-C-016 | Human | Colorectum | FAP | 5.86e-14 | 1.79e-02 | 0.0521 |
| 2580 | GAK | A015-C-002 | Human | Colorectum | FAP | 7.65e-09 | 2.05e-01 | -0.0763 |
| 2580 | GAK | A001-C-203 | Human | Colorectum | FAP | 2.29e-08 | 1.70e-01 | -0.0481 |
| 2580 | GAK | A002-C-116 | Human | Colorectum | FAP | 1.86e-19 | -2.06e-01 | -0.0452 |
| 2580 | GAK | A014-C-008 | Human | Colorectum | FAP | 6.04e-12 | 2.65e-01 | -0.191 |
| Page: 1 2 3 4 5 6 7 |
| Tissue | Expression Dynamics | Abbreviation |
| Colorectum (GSE201348) |  | FAP: Familial adenomatous polyposis |
| CRC: Colorectal cancer | ||
| Colorectum (HTA11) |  | AD: Adenomas |
| SER: Sessile serrated lesions | ||
| MSI-H: Microsatellite-high colorectal cancer | ||
| MSS: Microsatellite stable colorectal cancer | ||
| Esophagus | 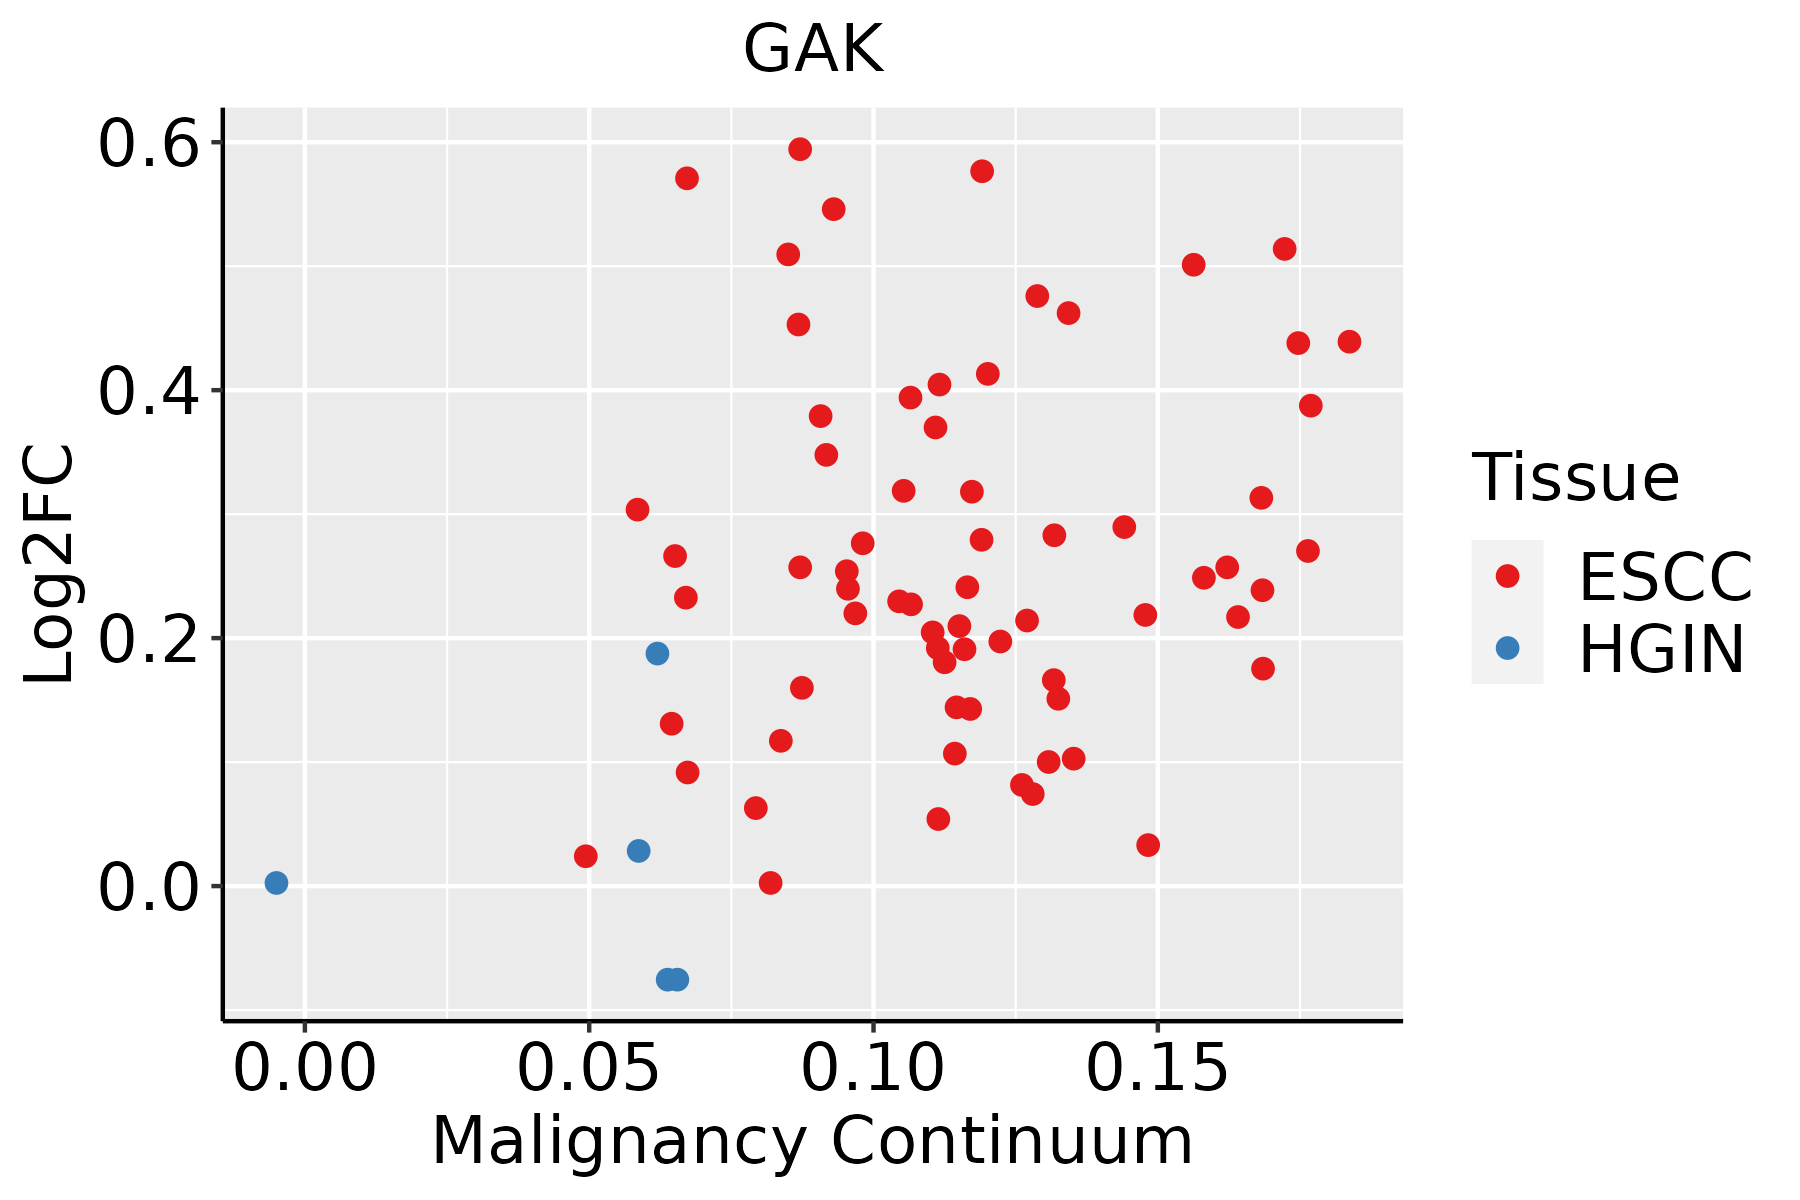 | ESCC: Esophageal squamous cell carcinoma |
| HGIN: High-grade intraepithelial neoplasias | ||
| LGIN: Low-grade intraepithelial neoplasias | ||
| Liver |  | HCC: Hepatocellular carcinoma |
| NAFLD: Non-alcoholic fatty liver disease | ||
| Oral Cavity |  | EOLP: Erosive Oral lichen planus |
| LP: leukoplakia | ||
| NEOLP: Non-erosive oral lichen planus | ||
| OSCC: Oral squamous cell carcinoma | ||
| Thyroid | 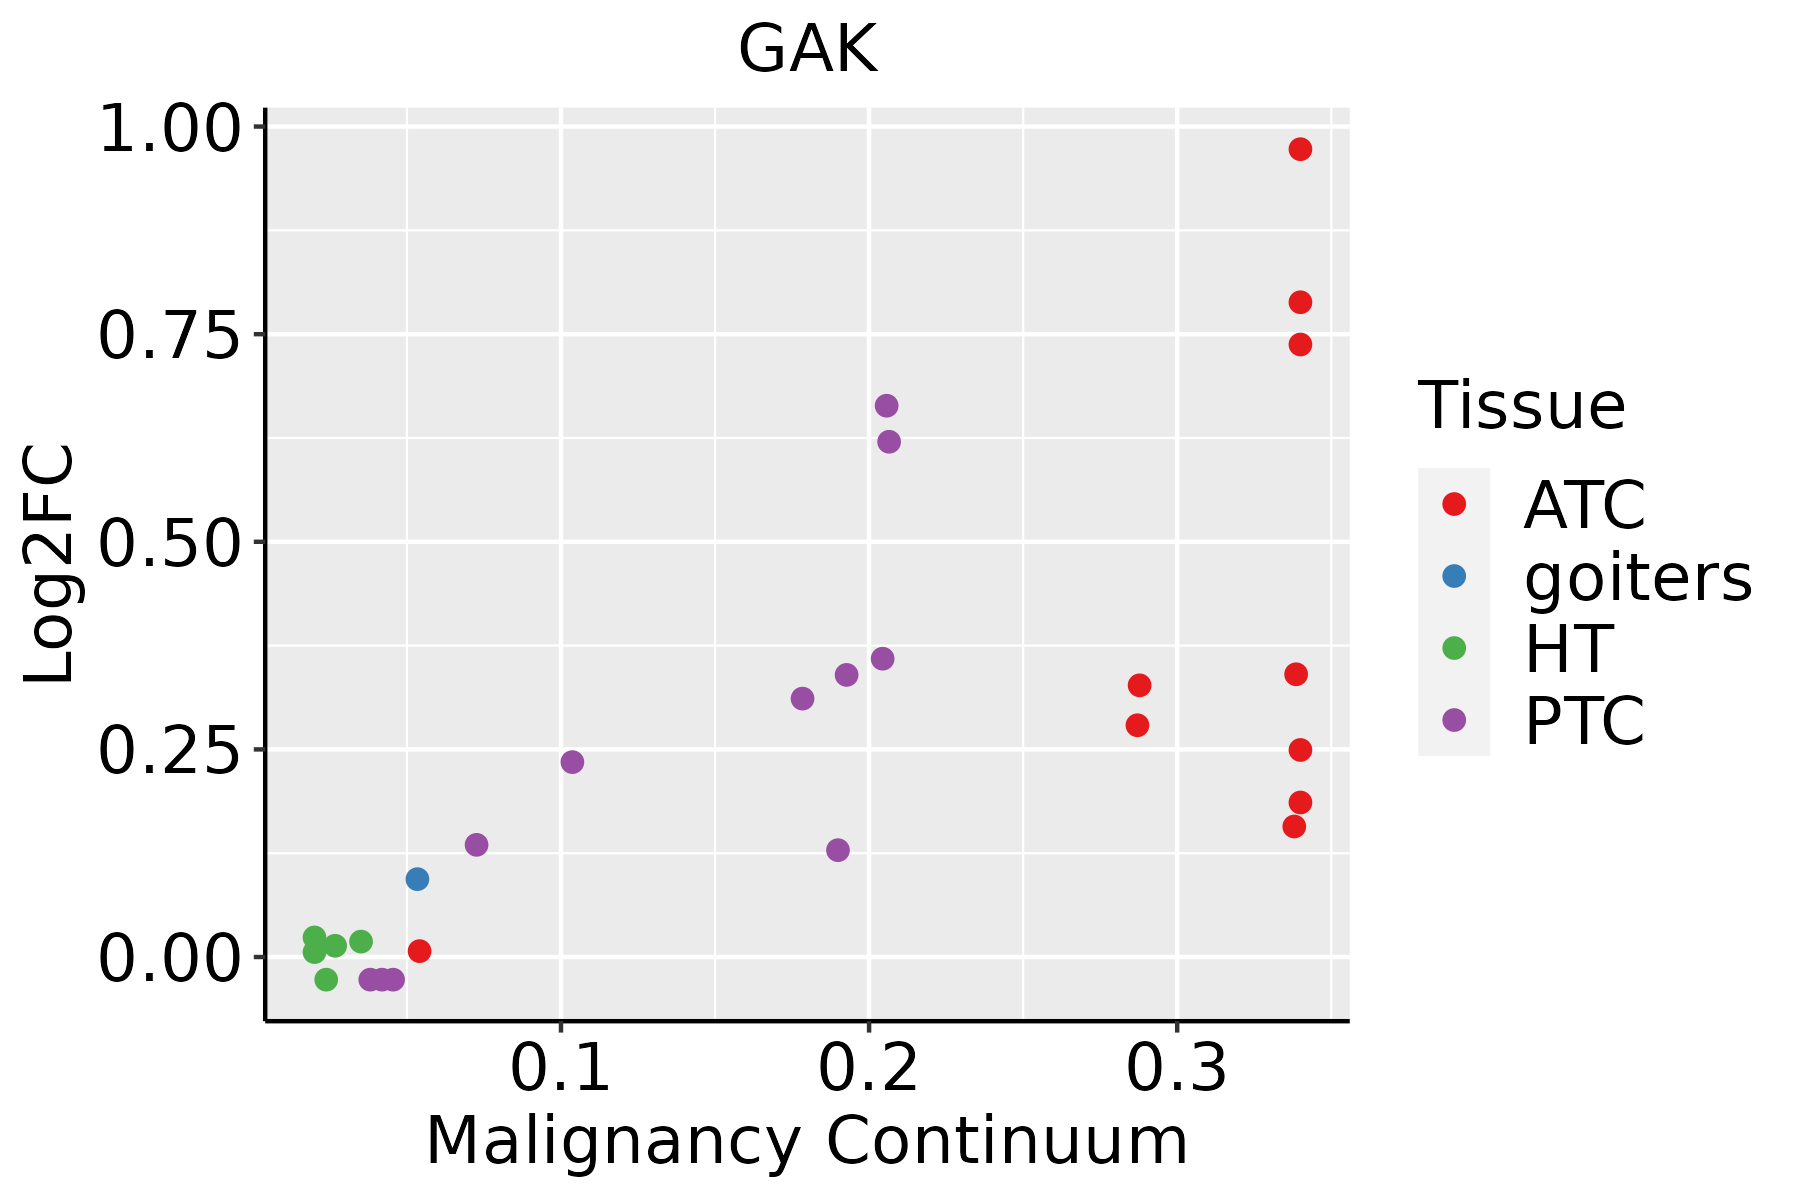 | ATC: Anaplastic thyroid cancer |
| HT: Hashimoto's thyroiditis | ||
| PTC: Papillary thyroid cancer |
| ∗log2FC in expression of this searched gene in stem-like cells from each diseased tissue sample relative to stem-like cells in normal samples in each tissue plotted against the malignancy continuum. Samples are colored based on if they are from different disease stage. |
Top |
Malignant transformation related pathway analysis |
| Find out the enriched GO biological processes and KEGG pathways involved in transition from healthy to precancer to cancer |
| Tissue | Disease Stage | Enriched GO biological Processes |
| Colorectum | AD |  |
| Colorectum | SER |  |
| Colorectum | MSS |  |
| Colorectum | MSI-H |  |
| Colorectum | FAP |  |
| ∗Top 15 enriched GO BP terms are showed in the bar plot of each disease state in each tissue. Each row represents a significant GO biological process which is colored according to the -log10(p.adjust). |
| Page: 1 2 3 4 5 6 7 8 9 |
| GO ID | Tissue | Disease Stage | Description | Gene Ratio | Bg Ratio | pvalue | p.adjust | Count |
| GO:00717093 | Colorectum | FAP | membrane assembly | 17/2622 | 50/18723 | 2.86e-04 | 3.77e-03 | 17 |
| GO:00070412 | Colorectum | FAP | lysosomal transport | 30/2622 | 114/18723 | 3.71e-04 | 4.63e-03 | 30 |
| GO:00440913 | Colorectum | FAP | membrane biogenesis | 17/2622 | 55/18723 | 9.95e-04 | 9.80e-03 | 17 |
| GO:00109772 | Colorectum | FAP | negative regulation of neuron projection development | 33/2622 | 137/18723 | 1.07e-03 | 1.04e-02 | 33 |
| GO:00340671 | Colorectum | FAP | protein localization to Golgi apparatus | 11/2622 | 29/18723 | 1.20e-03 | 1.14e-02 | 11 |
| GO:00064574 | Colorectum | FAP | protein folding | 44/2622 | 212/18723 | 4.36e-03 | 2.98e-02 | 44 |
| GO:00364651 | Colorectum | FAP | synaptic vesicle recycling | 19/2622 | 75/18723 | 6.44e-03 | 4.01e-02 | 19 |
| GO:00512612 | Colorectum | FAP | protein depolymerization | 26/2622 | 114/18723 | 7.36e-03 | 4.40e-02 | 26 |
| GO:00726595 | Colorectum | CRC | protein localization to plasma membrane | 80/2078 | 284/18723 | 1.36e-15 | 4.07e-12 | 80 |
| GO:19907785 | Colorectum | CRC | protein localization to cell periphery | 85/2078 | 333/18723 | 8.75e-14 | 1.05e-10 | 85 |
| GO:00164824 | Colorectum | CRC | cytosolic transport | 45/2078 | 168/18723 | 1.22e-08 | 2.52e-06 | 45 |
| GO:00068924 | Colorectum | CRC | post-Golgi vesicle-mediated transport | 33/2078 | 104/18723 | 1.22e-08 | 2.52e-06 | 33 |
| GO:00725833 | Colorectum | CRC | clathrin-dependent endocytosis | 18/2078 | 47/18723 | 1.16e-06 | 6.75e-05 | 18 |
| GO:00109754 | Colorectum | CRC | regulation of neuron projection development | 82/2078 | 445/18723 | 2.51e-06 | 1.19e-04 | 82 |
| GO:00990033 | Colorectum | CRC | vesicle-mediated transport in synapse | 45/2078 | 200/18723 | 2.67e-06 | 1.25e-04 | 45 |
| GO:00481935 | Colorectum | CRC | Golgi vesicle transport | 59/2078 | 296/18723 | 5.47e-06 | 2.17e-04 | 59 |
| GO:00068983 | Colorectum | CRC | receptor-mediated endocytosis | 50/2078 | 244/18723 | 1.27e-05 | 4.08e-04 | 50 |
| GO:00329845 | Colorectum | CRC | protein-containing complex disassembly | 46/2078 | 224/18723 | 2.61e-05 | 7.18e-04 | 46 |
| GO:00313454 | Colorectum | CRC | negative regulation of cell projection organization | 40/2078 | 186/18723 | 2.87e-05 | 7.61e-04 | 40 |
| GO:00995042 | Colorectum | CRC | synaptic vesicle cycle | 39/2078 | 181/18723 | 3.43e-05 | 8.71e-04 | 39 |
| Page: 1 2 3 4 5 6 7 8 9 10 11 12 13 14 15 |
| Pathway ID | Tissue | Disease Stage | Description | Gene Ratio | Bg Ratio | pvalue | p.adjust | qvalue | Count |
| Page: 1 |
Top |
Cell-cell communication analysis |
| Identification of potential cell-cell interactions between two cell types and their ligand-receptor pairs for different disease states |
| Ligand | Receptor | LRpair | Pathway | Tissue | Disease Stage |
| Page: 1 |
Top |
Single-cell gene regulatory network inference analysis |
| Find out the significant the regulons (TFs) and the target genes of each regulon across cell types for different disease states |
| TF | Cell Type | Tissue | Disease Stage | Target Gene | RSS | Regulon Activity |
| ∗The dot plots of a searched regulon are shown for all cell subpopulations in each disease state of each tissue based on the regulon specific score inferred using pySCENIC and by calculating the average expression. |
| Page: 1 |
Top |
Somatic mutation of malignant transformation related genes |
| Annotation of somatic variants for genes involved in malignant transformation |
| Hugo Symbol | Variant Class | Variant Classification | dbSNP RS | HGVSc | HGVSp | HGVSp Short | SWISSPROT | BIOTYPE | SIFT | PolyPhen | Tumor Sample Barcode | Tissue | Histology | Sex | Age | Stage | Therapy Types | Drugs | Outcome |
| GAK | SNV | Missense_Mutation | c.264N>A | p.Phe88Leu | p.F88L | O14976 | protein_coding | tolerated(0.12) | benign(0.046) | TCGA-E2-A1BD-01 | Breast | breast invasive carcinoma | Female | <65 | I/II | Hormone Therapy | arimidex | SD | |
| GAK | deletion | Frame_Shift_Del | novel | c.1400delN | p.Asn467ThrfsTer75 | p.N467Tfs*75 | O14976 | protein_coding | TCGA-D8-A27V-01 | Breast | breast invasive carcinoma | Female | <65 | I/II | Hormone Therapy | tamoxiphen | SD | ||
| GAK | deletion | Frame_Shift_Del | novel | c.3405delN | p.Lys1136SerfsTer20 | p.K1136Sfs*20 | O14976 | protein_coding | TCGA-EW-A2FV-01 | Breast | breast invasive carcinoma | Female | <65 | III/IV | Chemotherapy | docetaxel | SD | ||
| GAK | SNV | Missense_Mutation | c.175N>C | p.Asp59His | p.D59H | O14976 | protein_coding | deleterious(0) | probably_damaging(0.993) | TCGA-IR-A3LA-01 | Cervix | cervical & endocervical cancer | Female | <65 | I/II | Chemotherapy | cisplatin | CR | |
| GAK | SNV | Missense_Mutation | c.1273N>A | p.Glu425Lys | p.E425K | O14976 | protein_coding | deleterious(0) | probably_damaging(0.987) | TCGA-JW-A5VL-01 | Cervix | cervical & endocervical cancer | Female | <65 | I/II | Unknown | Unknown | SD | |
| GAK | SNV | Missense_Mutation | c.790G>A | p.Glu264Lys | p.E264K | O14976 | protein_coding | deleterious(0) | probably_damaging(1) | TCGA-Q1-A5R2-01 | Cervix | cervical & endocervical cancer | Female | <65 | I/II | Chemotherapy | cisplatin | PR | |
| GAK | SNV | Missense_Mutation | novel | c.3386N>A | p.Ala1129Asp | p.A1129D | O14976 | protein_coding | tolerated(0.46) | benign(0.028) | TCGA-AA-3947-01 | Colorectum | colon adenocarcinoma | Female | <65 | I/II | Unknown | Unknown | SD |
| GAK | SNV | Missense_Mutation | novel | c.3242N>G | p.Asp1081Gly | p.D1081G | O14976 | protein_coding | deleterious(0) | probably_damaging(0.945) | TCGA-AA-3947-01 | Colorectum | colon adenocarcinoma | Female | <65 | I/II | Unknown | Unknown | SD |
| GAK | SNV | Missense_Mutation | novel | c.524A>G | p.Lys175Arg | p.K175R | O14976 | protein_coding | deleterious(0) | possibly_damaging(0.737) | TCGA-AA-A02E-01 | Colorectum | colon adenocarcinoma | Female | >=65 | III/IV | Unknown | Unknown | PD |
| GAK | SNV | Missense_Mutation | c.2249G>A | p.Gly750Glu | p.G750E | O14976 | protein_coding | deleterious(0) | possibly_damaging(0.852) | TCGA-AY-A69D-01 | Colorectum | colon adenocarcinoma | Female | <65 | I/II | Unknown | Unknown | SD |
| Page: 1 2 3 4 5 6 7 8 9 10 11 |
Top |
Related drugs of malignant transformation related genes |
| Identification of chemicals and drugs interact with genes involved in malignant transfromation |
| (DGIdb 4.0) |
| Entrez ID | Symbol | Category | Interaction Types | Drug Claim Name | Drug Name | PMIDs |
| 2580 | GAK | SERINE THREONINE KINASE, DRUGGABLE GENOME, KINASE, ENZYME | SB-202190 | SB-202190 | 22951114 | |
| 2580 | GAK | SERINE THREONINE KINASE, DRUGGABLE GENOME, KINASE, ENZYME | inhibitor | HTS-466284 | CHEMBL261454 | 19035792 |
| 2580 | GAK | SERINE THREONINE KINASE, DRUGGABLE GENOME, KINASE, ENZYME | inhibitor | 223366123 | BARICITINIB | |
| 2580 | GAK | SERINE THREONINE KINASE, DRUGGABLE GENOME, KINASE, ENZYME | inhibitor | 178101952 |
| Page: 1 |

Copyright 2023-Present -The University of Texas Health Science Center at Houston |