
|
|||||
|
 | |
| |
| |
| |
| |
| |
|
Gene: FOXM1 |
Gene summary for FOXM1 |
| Gene information | Species | Human | Gene symbol | FOXM1 | Gene ID | 2305 |
| Gene name | forkhead box M1 | |
| Gene Alias | FKHL16 | |
| Cytomap | 12p13.33 | |
| Gene Type | protein-coding | GO ID | GO:0000086 | UniProtAcc | A0A0D9SFF0 |
Top |
Malignant transformation analysis |
| Identification of the aberrant gene expression in precancerous and cancerous lesions by comparing the gene expression of stem-like cells in diseased tissues with normal stem cells |
| Entrez ID | Symbol | Replicates | Species | Organ | Tissue | Adj P-value | Log2FC | Malignancy |
| 2305 | FOXM1 | LZE2T | Human | Esophagus | ESCC | 2.95e-05 | 8.13e-01 | 0.082 |
| 2305 | FOXM1 | LZE6T | Human | Esophagus | ESCC | 1.92e-03 | 1.84e-01 | 0.0845 |
| 2305 | FOXM1 | P2T-E | Human | Esophagus | ESCC | 7.01e-13 | 5.21e-01 | 0.1177 |
| 2305 | FOXM1 | P4T-E | Human | Esophagus | ESCC | 7.32e-21 | 6.05e-01 | 0.1323 |
| 2305 | FOXM1 | P5T-E | Human | Esophagus | ESCC | 9.53e-09 | 2.33e-01 | 0.1327 |
| 2305 | FOXM1 | P9T-E | Human | Esophagus | ESCC | 3.78e-05 | 1.65e-01 | 0.1131 |
| 2305 | FOXM1 | P10T-E | Human | Esophagus | ESCC | 7.34e-12 | 3.97e-01 | 0.116 |
| 2305 | FOXM1 | P15T-E | Human | Esophagus | ESCC | 1.87e-07 | 3.52e-01 | 0.1149 |
| 2305 | FOXM1 | P16T-E | Human | Esophagus | ESCC | 1.88e-04 | 1.36e-01 | 0.1153 |
| 2305 | FOXM1 | P17T-E | Human | Esophagus | ESCC | 7.41e-03 | 2.34e-01 | 0.1278 |
| 2305 | FOXM1 | P20T-E | Human | Esophagus | ESCC | 2.80e-02 | 2.10e-01 | 0.1124 |
| 2305 | FOXM1 | P21T-E | Human | Esophagus | ESCC | 1.62e-13 | 2.81e-01 | 0.1617 |
| 2305 | FOXM1 | P22T-E | Human | Esophagus | ESCC | 4.24e-18 | 6.51e-01 | 0.1236 |
| 2305 | FOXM1 | P24T-E | Human | Esophagus | ESCC | 2.93e-15 | 3.39e-01 | 0.1287 |
| 2305 | FOXM1 | P26T-E | Human | Esophagus | ESCC | 1.76e-12 | 3.38e-01 | 0.1276 |
| 2305 | FOXM1 | P27T-E | Human | Esophagus | ESCC | 9.20e-06 | 2.14e-01 | 0.1055 |
| 2305 | FOXM1 | P28T-E | Human | Esophagus | ESCC | 2.56e-16 | 3.57e-01 | 0.1149 |
| 2305 | FOXM1 | P31T-E | Human | Esophagus | ESCC | 1.30e-15 | 3.42e-01 | 0.1251 |
| 2305 | FOXM1 | P32T-E | Human | Esophagus | ESCC | 2.41e-29 | 5.96e-01 | 0.1666 |
| 2305 | FOXM1 | P36T-E | Human | Esophagus | ESCC | 8.30e-07 | 4.84e-01 | 0.1187 |
| Page: 1 2 3 4 |
| Tissue | Expression Dynamics | Abbreviation |
| Esophagus | 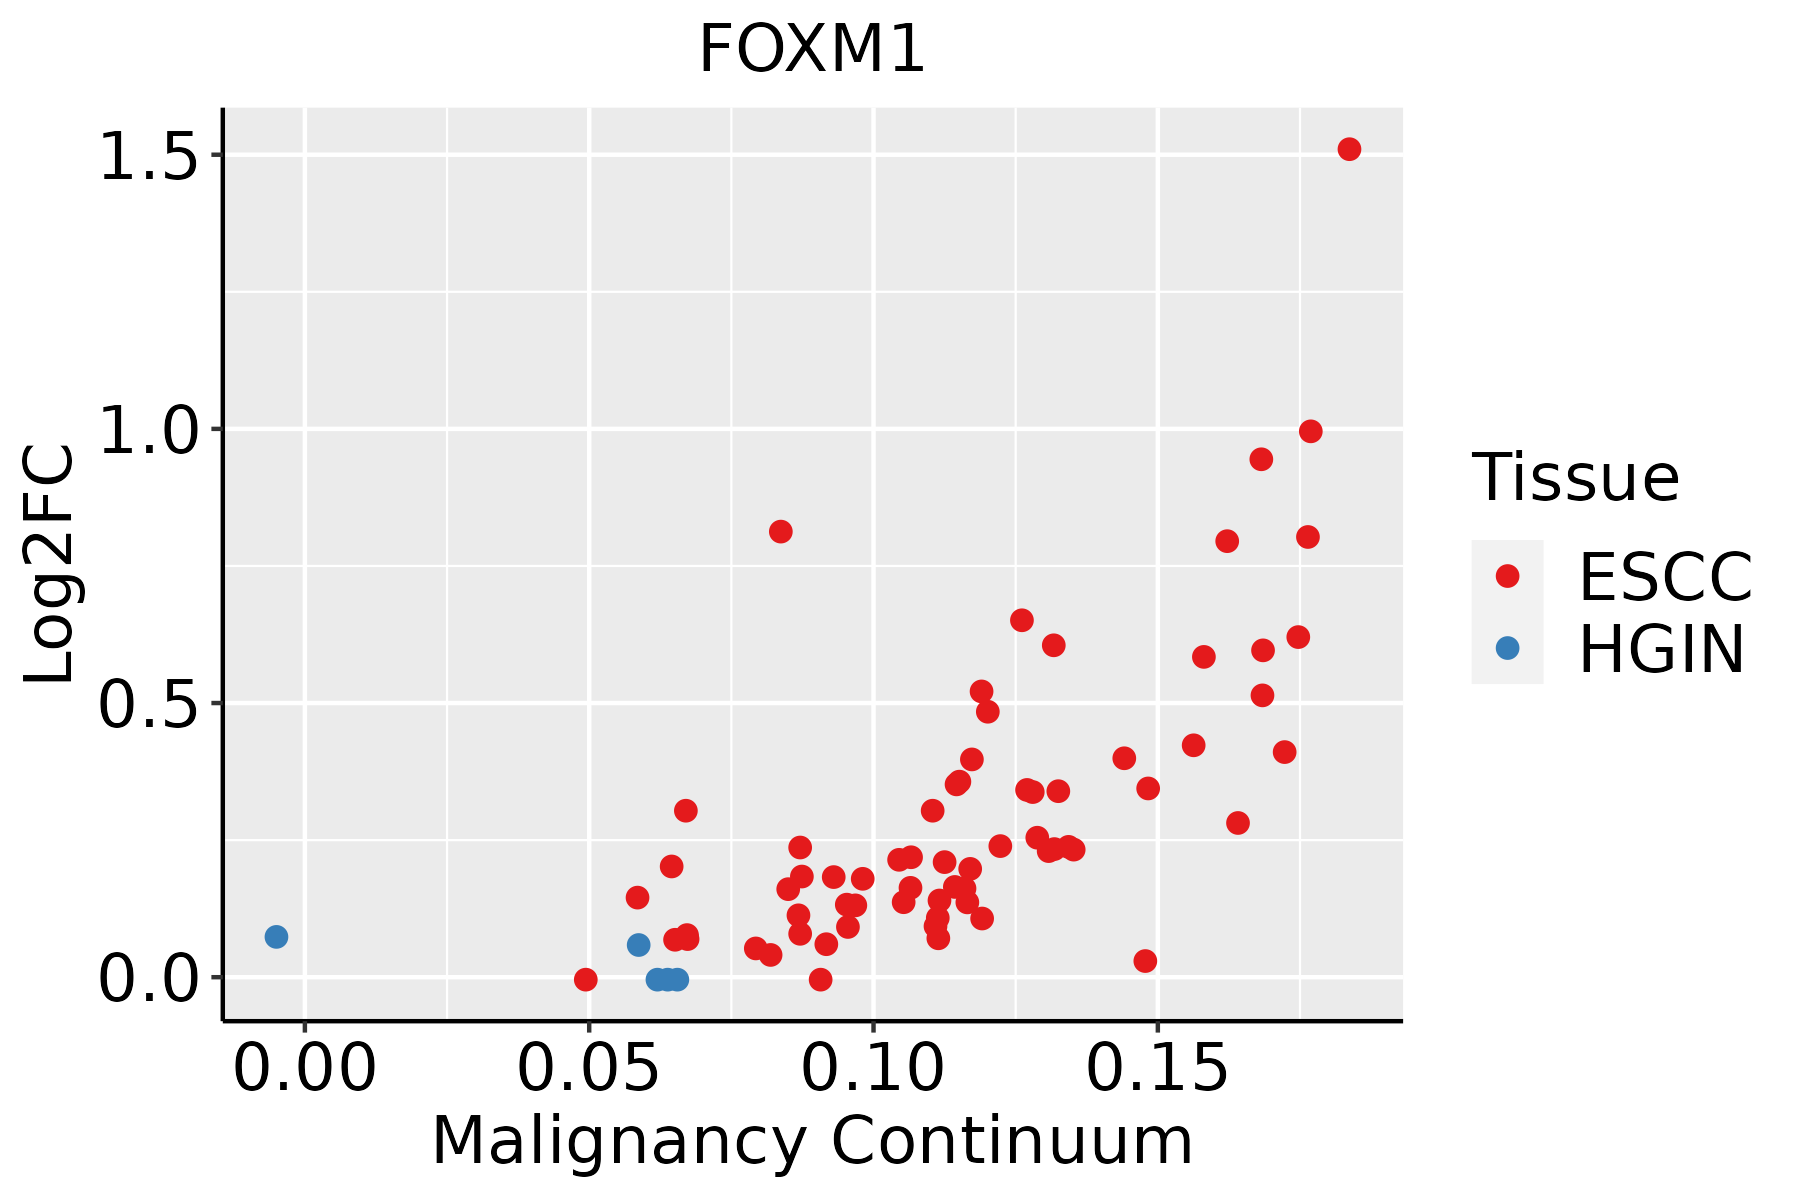 | ESCC: Esophageal squamous cell carcinoma |
| HGIN: High-grade intraepithelial neoplasias | ||
| LGIN: Low-grade intraepithelial neoplasias | ||
| Liver |  | HCC: Hepatocellular carcinoma |
| NAFLD: Non-alcoholic fatty liver disease | ||
| Oral Cavity |  | EOLP: Erosive Oral lichen planus |
| LP: leukoplakia | ||
| NEOLP: Non-erosive oral lichen planus | ||
| OSCC: Oral squamous cell carcinoma | ||
| Skin |  | AK: Actinic keratosis |
| cSCC: Cutaneous squamous cell carcinoma | ||
| SCCIS:squamous cell carcinoma in situ | ||
| Thyroid |  | ATC: Anaplastic thyroid cancer |
| HT: Hashimoto's thyroiditis | ||
| PTC: Papillary thyroid cancer |
| ∗log2FC in expression of this searched gene in stem-like cells from each diseased tissue sample relative to stem-like cells in normal samples in each tissue plotted against the malignancy continuum. Samples are colored based on if they are from different disease stage. |
Top |
Malignant transformation related pathway analysis |
| Find out the enriched GO biological processes and KEGG pathways involved in transition from healthy to precancer to cancer |
| Tissue | Disease Stage | Enriched GO biological Processes |
| Colorectum | AD |  |
| Colorectum | SER |  |
| Colorectum | MSS |  |
| Colorectum | MSI-H |  |
| Colorectum | FAP |  |
| ∗Top 15 enriched GO BP terms are showed in the bar plot of each disease state in each tissue. Each row represents a significant GO biological process which is colored according to the -log10(p.adjust). |
| Page: 1 2 3 4 5 6 7 8 9 |
| GO ID | Tissue | Disease Stage | Description | Gene Ratio | Bg Ratio | pvalue | p.adjust | Count |
| GO:007233120 | Oral cavity | OSCC | signal transduction by p53 class mediator | 107/7305 | 163/18723 | 4.75e-12 | 1.83e-10 | 107 |
| GO:000756818 | Oral cavity | OSCC | aging | 194/7305 | 339/18723 | 6.18e-12 | 2.33e-10 | 194 |
| GO:005105414 | Oral cavity | OSCC | positive regulation of DNA metabolic process | 126/7305 | 201/18723 | 8.12e-12 | 3.01e-10 | 126 |
| GO:200102017 | Oral cavity | OSCC | regulation of response to DNA damage stimulus | 131/7305 | 219/18723 | 3.21e-10 | 8.72e-09 | 131 |
| GO:00072659 | Oral cavity | OSCC | Ras protein signal transduction | 185/7305 | 337/18723 | 1.95e-09 | 4.60e-08 | 185 |
| GO:003109816 | Oral cavity | OSCC | stress-activated protein kinase signaling cascade | 141/7305 | 247/18723 | 5.74e-09 | 1.25e-07 | 141 |
| GO:00427707 | Oral cavity | OSCC | signal transduction in response to DNA damage | 102/7305 | 172/18723 | 5.27e-08 | 9.68e-07 | 102 |
| GO:005140316 | Oral cavity | OSCC | stress-activated MAPK cascade | 134/7305 | 239/18723 | 6.02e-08 | 1.09e-06 | 134 |
| GO:00000863 | Oral cavity | OSCC | G2/M transition of mitotic cell cycle | 84/7305 | 137/18723 | 9.99e-08 | 1.70e-06 | 84 |
| GO:004340917 | Oral cavity | OSCC | negative regulation of MAPK cascade | 105/7305 | 180/18723 | 1.10e-07 | 1.87e-06 | 105 |
| GO:00448393 | Oral cavity | OSCC | cell cycle G2/M phase transition | 89/7305 | 148/18723 | 1.51e-07 | 2.51e-06 | 89 |
| GO:007030210 | Oral cavity | OSCC | regulation of stress-activated protein kinase signaling cascade | 111/7305 | 195/18723 | 2.82e-07 | 4.34e-06 | 111 |
| GO:200037716 | Oral cavity | OSCC | regulation of reactive oxygen species metabolic process | 92/7305 | 157/18723 | 4.96e-07 | 7.27e-06 | 92 |
| GO:003287210 | Oral cavity | OSCC | regulation of stress-activated MAPK cascade | 108/7305 | 192/18723 | 8.97e-07 | 1.22e-05 | 108 |
| GO:00063023 | Oral cavity | OSCC | double-strand break repair | 132/7305 | 251/18723 | 7.93e-06 | 8.52e-05 | 132 |
| GO:20010227 | Oral cavity | OSCC | positive regulation of response to DNA damage stimulus | 63/7305 | 105/18723 | 1.05e-05 | 1.11e-04 | 63 |
| GO:00062825 | Oral cavity | OSCC | regulation of DNA repair | 75/7305 | 130/18723 | 1.19e-05 | 1.21e-04 | 75 |
| GO:003033018 | Oral cavity | OSCC | DNA damage response, signal transduction by p53 class mediator | 46/7305 | 72/18723 | 1.66e-05 | 1.64e-04 | 46 |
| GO:003287310 | Oral cavity | OSCC | negative regulation of stress-activated MAPK cascade | 34/7305 | 51/18723 | 5.83e-05 | 4.80e-04 | 34 |
| GO:007030310 | Oral cavity | OSCC | negative regulation of stress-activated protein kinase signaling cascade | 34/7305 | 51/18723 | 5.83e-05 | 4.80e-04 | 34 |
| Page: 1 2 3 4 5 6 7 8 9 |
| Pathway ID | Tissue | Disease Stage | Description | Gene Ratio | Bg Ratio | pvalue | p.adjust | qvalue | Count |
| hsa0421829 | Esophagus | ESCC | Cellular senescence | 119/4205 | 156/8465 | 5.89e-12 | 9.40e-11 | 4.81e-11 | 119 |
| hsa0421838 | Esophagus | ESCC | Cellular senescence | 119/4205 | 156/8465 | 5.89e-12 | 9.40e-11 | 4.81e-11 | 119 |
| hsa0421822 | Liver | HCC | Cellular senescence | 102/4020 | 156/8465 | 4.18e-06 | 3.59e-05 | 2.00e-05 | 102 |
| hsa0421832 | Liver | HCC | Cellular senescence | 102/4020 | 156/8465 | 4.18e-06 | 3.59e-05 | 2.00e-05 | 102 |
| hsa0421820 | Oral cavity | OSCC | Cellular senescence | 112/3704 | 156/8465 | 8.04e-13 | 1.42e-11 | 7.21e-12 | 112 |
| hsa04218110 | Oral cavity | OSCC | Cellular senescence | 112/3704 | 156/8465 | 8.04e-13 | 1.42e-11 | 7.21e-12 | 112 |
| hsa0421827 | Oral cavity | LP | Cellular senescence | 71/2418 | 156/8465 | 4.17e-06 | 3.75e-05 | 2.42e-05 | 71 |
| hsa0421837 | Oral cavity | LP | Cellular senescence | 71/2418 | 156/8465 | 4.17e-06 | 3.75e-05 | 2.42e-05 | 71 |
| Page: 1 |
Top |
Cell-cell communication analysis |
| Identification of potential cell-cell interactions between two cell types and their ligand-receptor pairs for different disease states |
| Ligand | Receptor | LRpair | Pathway | Tissue | Disease Stage |
| Page: 1 |
Top |
Single-cell gene regulatory network inference analysis |
| Find out the significant the regulons (TFs) and the target genes of each regulon across cell types for different disease states |
| TF | Cell Type | Tissue | Disease Stage | Target Gene | RSS | Regulon Activity |
| FOXM1 | CD8TEX | Breast | DCIS | MKI67,ASPM,TOP2A, etc. | 5.31e-02 |  |
| FOXM1 | GC | Breast | DCIS | MKI67,ASPM,TOP2A, etc. | 2.73e-01 | |
| FOXM1 | CD8TEX | Breast | Healthy | MKI67,ASPM,TOP2A, etc. | 2.07e-02 |  |
| FOXM1 | GC | Breast | IDC | MKI67,ASPM,TOP2A, etc. | 2.09e-01 |  |
| FOXM1 | CD8TEX | Breast | IDC | MKI67,ASPM,TOP2A, etc. | 1.34e-01 | |
| FOXM1 | MSC.ADIPO | Cervix | CC | POLQ,KIF4A,TOP2A, etc. | 2.25e-01 |  |
| FOXM1 | BSM | Cervix | CC | POLQ,KIF4A,TOP2A, etc. | 7.25e-02 | |
| FOXM1 | TAC | Colorectum | FAP | MKI67,ASPM,IQGAP3, etc. | 3.35e-01 |  |
| FOXM1 | PRO | Esophagus | ESCC | PTMS,HMGB2,CEP55, etc. | 1.11e-01 |  |
| FOXM1 | CD8TEX | Oral cavity | ADJ | ARL6IP1,TOP2A,CDCA3, etc. | 2.87e-02 |  |
| ∗The dot plots of a searched regulon are shown for all cell subpopulations in each disease state of each tissue based on the regulon specific score inferred using pySCENIC and by calculating the average expression. |
| Page: 1 2 |
Top |
Somatic mutation of malignant transformation related genes |
| Annotation of somatic variants for genes involved in malignant transformation |
| Hugo Symbol | Variant Class | Variant Classification | dbSNP RS | HGVSc | HGVSp | HGVSp Short | SWISSPROT | BIOTYPE | SIFT | PolyPhen | Tumor Sample Barcode | Tissue | Histology | Sex | Age | Stage | Therapy Types | Drugs | Outcome |
| FOXM1 | SNV | Missense_Mutation | novel | c.1415N>T | p.Ser472Phe | p.S472F | Q08050 | protein_coding | deleterious(0.03) | possibly_damaging(0.739) | TCGA-AN-A03X-01 | Breast | breast invasive carcinoma | Female | >=65 | I/II | Unknown | Unknown | SD |
| FOXM1 | SNV | Missense_Mutation | novel | c.609N>T | p.Glu203Asp | p.E203D | Q08050 | protein_coding | tolerated(0.44) | benign(0.07) | TCGA-AN-A046-01 | Breast | breast invasive carcinoma | Female | >=65 | I/II | Unknown | Unknown | SD |
| FOXM1 | SNV | Missense_Mutation | c.1667G>T | p.Ser556Ile | p.S556I | Q08050 | protein_coding | deleterious(0.02) | benign(0.168) | TCGA-BH-A0HA-01 | Breast | breast invasive carcinoma | Female | <65 | I/II | Unknown | Unknown | SD | |
| FOXM1 | SNV | Missense_Mutation | c.1976N>T | p.Pro659Leu | p.P659L | Q08050 | protein_coding | tolerated(0.3) | probably_damaging(0.999) | TCGA-BH-A0HF-01 | Breast | breast invasive carcinoma | Female | >=65 | I/II | Hormone Therapy | arimidex | SD | |
| FOXM1 | SNV | Missense_Mutation | c.361N>A | p.Leu121Ile | p.L121I | Q08050 | protein_coding | tolerated(0.43) | benign(0.117) | TCGA-D8-A1XK-01 | Breast | breast invasive carcinoma | Female | <65 | I/II | Chemotherapy | doxorubicine+cyclophosphamide | SD | |
| FOXM1 | SNV | Missense_Mutation | novel | c.799N>C | p.Glu267Gln | p.E267Q | Q08050 | protein_coding | deleterious(0) | probably_damaging(0.996) | TCGA-E9-A5FL-01 | Breast | breast invasive carcinoma | Female | >=65 | I/II | Unknown | Unknown | SD |
| FOXM1 | insertion | Frame_Shift_Ins | novel | c.1030_1031insTTACAGGCATTTTTGTTTGTATCTATATTTTTTATTTATTGATG | p.Arg344LeufsTer25 | p.R344Lfs*25 | Q08050 | protein_coding | TCGA-A7-A0CE-01 | Breast | breast invasive carcinoma | Female | <65 | I/II | Chemotherapy | adriamycin | SD | ||
| FOXM1 | insertion | Nonsense_Mutation | novel | c.1413_1414insGGACCTGCTGGTTAACTTAGGCCTTTTGAGGG | p.Ser472GlyfsTer5 | p.S472Gfs*5 | Q08050 | protein_coding | TCGA-AN-A03X-01 | Breast | breast invasive carcinoma | Female | >=65 | I/II | Unknown | Unknown | SD | ||
| FOXM1 | insertion | Frame_Shift_Ins | novel | c.2129_2130insCTTGCTTTTAGTTTTGATAGAAG | p.Pro711LeufsTer18 | p.P711Lfs*18 | Q08050 | protein_coding | TCGA-B6-A0IM-01 | Breast | breast invasive carcinoma | Female | >=65 | I/II | Unknown | Unknown | SD | ||
| FOXM1 | SNV | Missense_Mutation | rs148974985 | c.1742N>A | p.Arg581Gln | p.R581Q | Q08050 | protein_coding | deleterious(0.03) | probably_damaging(0.975) | TCGA-2W-A8YY-01 | Cervix | cervical & endocervical cancer | Female | <65 | I/II | Chemotherapy | cisplatin | CR |
| Page: 1 2 3 4 5 6 7 8 |
Top |
Related drugs of malignant transformation related genes |
| Identification of chemicals and drugs interact with genes involved in malignant transfromation |
| (DGIdb 4.0) |
| Entrez ID | Symbol | Category | Interaction Types | Drug Claim Name | Drug Name | PMIDs |
| Page: 1 |

Copyright 2023-Present -The University of Texas Health Science Center at Houston |