
|
|||||
|
 | |
| |
| |
| |
| |
| |
|
Gene: FBXO5 |
Gene summary for FBXO5 |
| Gene information | Species | Human | Gene symbol | FBXO5 | Gene ID | 26271 |
| Gene name | F-box protein 5 | |
| Gene Alias | EMI1 | |
| Cytomap | 6q25.2 | |
| Gene Type | protein-coding | GO ID | GO:0000003 | UniProtAcc | Q9UKT4 |
Top |
Malignant transformation analysis |
| Identification of the aberrant gene expression in precancerous and cancerous lesions by comparing the gene expression of stem-like cells in diseased tissues with normal stem cells |
| Entrez ID | Symbol | Replicates | Species | Organ | Tissue | Adj P-value | Log2FC | Malignancy |
| 26271 | FBXO5 | PTC07 | Human | Thyroid | PTC | 4.82e-02 | 5.30e-02 | 0.2044 |
| 26271 | FBXO5 | ATC13 | Human | Thyroid | ATC | 5.45e-11 | 1.91e-01 | 0.34 |
| 26271 | FBXO5 | ATC2 | Human | Thyroid | ATC | 5.78e-04 | 8.24e-01 | 0.34 |
| 26271 | FBXO5 | ATC4 | Human | Thyroid | ATC | 1.86e-03 | 2.43e-01 | 0.34 |
| 26271 | FBXO5 | ATC5 | Human | Thyroid | ATC | 2.04e-12 | 3.20e-01 | 0.34 |
| Page: 1 |
| Tissue | Expression Dynamics | Abbreviation |
| Thyroid | 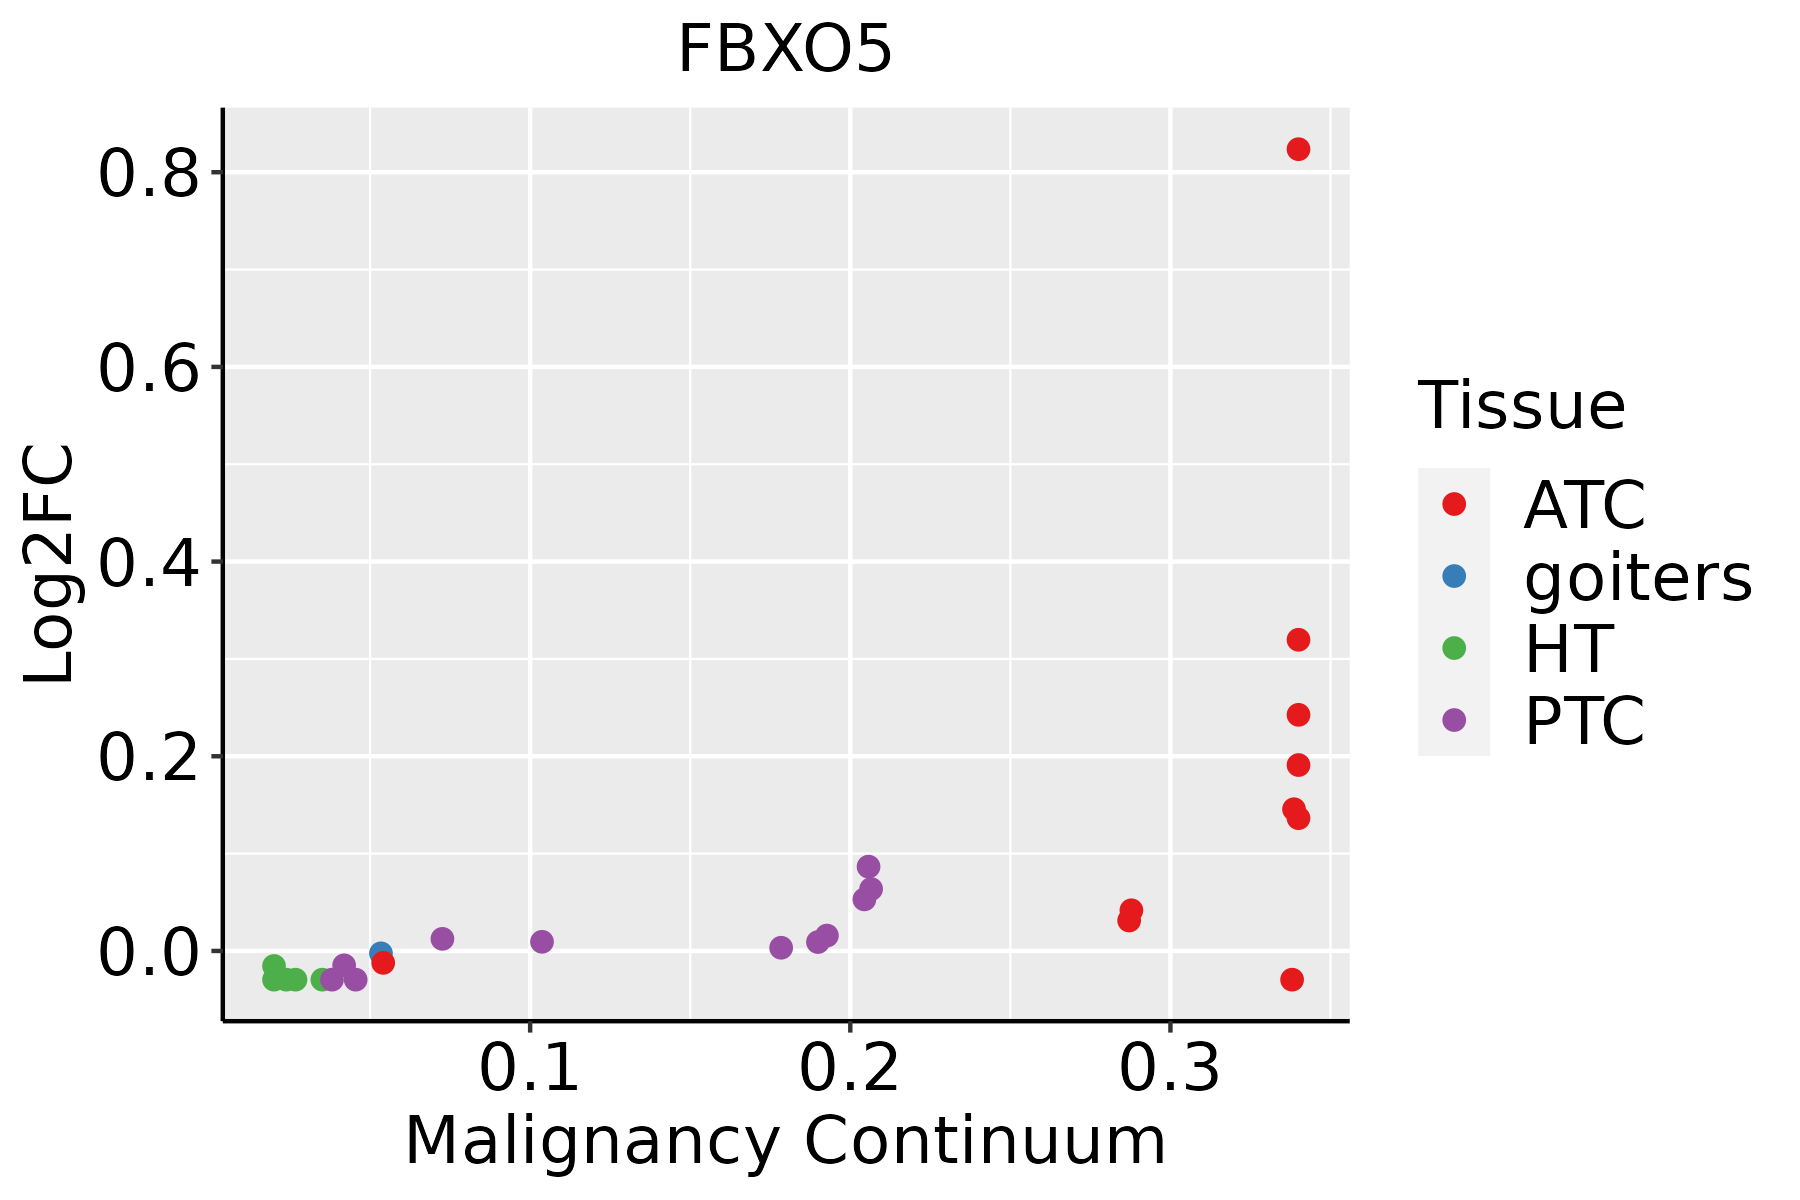 | ATC: Anaplastic thyroid cancer |
| HT: Hashimoto's thyroiditis | ||
| PTC: Papillary thyroid cancer |
| ∗log2FC in expression of this searched gene in stem-like cells from each diseased tissue sample relative to stem-like cells in normal samples in each tissue plotted against the malignancy continuum. Samples are colored based on if they are from different disease stage. |
Top |
Malignant transformation related pathway analysis |
| Find out the enriched GO biological processes and KEGG pathways involved in transition from healthy to precancer to cancer |
| Tissue | Disease Stage | Enriched GO biological Processes |
| Colorectum | AD |  |
| Colorectum | SER |  |
| Colorectum | MSS |  |
| Colorectum | MSI-H |  |
| Colorectum | FAP |  |
| ∗Top 15 enriched GO BP terms are showed in the bar plot of each disease state in each tissue. Each row represents a significant GO biological process which is colored according to the -log10(p.adjust). |
| Page: 1 2 3 4 5 6 7 8 9 |
| GO ID | Tissue | Disease Stage | Description | Gene Ratio | Bg Ratio | pvalue | p.adjust | Count |
| GO:00458395 | Thyroid | PTC | negative regulation of mitotic nuclear division | 24/5968 | 48/18723 | 6.73e-03 | 2.90e-02 | 24 |
| GO:00903424 | Thyroid | PTC | regulation of cell aging | 29/5968 | 61/18723 | 7.57e-03 | 3.23e-02 | 29 |
| GO:00517845 | Thyroid | PTC | negative regulation of nuclear division | 27/5968 | 56/18723 | 7.77e-03 | 3.29e-02 | 27 |
| GO:00456697 | Thyroid | PTC | positive regulation of osteoblast differentiation | 32/5968 | 69/18723 | 8.16e-03 | 3.44e-02 | 32 |
| GO:00330454 | Thyroid | PTC | regulation of sister chromatid segregation | 33/5968 | 72/18723 | 9.04e-03 | 3.75e-02 | 33 |
| GO:00447844 | Thyroid | PTC | metaphase/anaphase transition of cell cycle | 30/5968 | 65/18723 | 1.11e-02 | 4.42e-02 | 30 |
| GO:190332034 | Thyroid | ATC | regulation of protein modification by small protein conjugation or removal | 152/6293 | 242/18723 | 9.76e-21 | 1.71e-18 | 152 |
| GO:014001416 | Thyroid | ATC | mitotic nuclear division | 171/6293 | 287/18723 | 1.13e-19 | 1.66e-17 | 171 |
| GO:003139634 | Thyroid | ATC | regulation of protein ubiquitination | 132/6293 | 210/18723 | 3.13e-18 | 3.98e-16 | 132 |
| GO:003304423 | Thyroid | ATC | regulation of chromosome organization | 119/6293 | 187/18723 | 3.55e-17 | 3.40e-15 | 119 |
| GO:004477219 | Thyroid | ATC | mitotic cell cycle phase transition | 223/6293 | 424/18723 | 3.46e-16 | 2.88e-14 | 223 |
| GO:000007013 | Thyroid | ATC | mitotic sister chromatid segregation | 108/6293 | 168/18723 | 3.53e-16 | 2.90e-14 | 108 |
| GO:000734622 | Thyroid | ATC | regulation of mitotic cell cycle | 236/6293 | 457/18723 | 7.58e-16 | 5.92e-14 | 236 |
| GO:000081913 | Thyroid | ATC | sister chromatid segregation | 122/6293 | 202/18723 | 4.71e-15 | 3.17e-13 | 122 |
| GO:001605023 | Thyroid | ATC | vesicle organization | 166/6293 | 300/18723 | 6.14e-15 | 3.92e-13 | 166 |
| GO:000705913 | Thyroid | ATC | chromosome segregation | 183/6293 | 346/18723 | 8.03e-14 | 4.23e-12 | 183 |
| GO:000705122 | Thyroid | ATC | spindle organization | 109/6293 | 184/18723 | 7.99e-13 | 3.46e-11 | 109 |
| GO:000150332 | Thyroid | ATC | ossification | 206/6293 | 408/18723 | 9.23e-13 | 3.95e-11 | 206 |
| GO:005125829 | Thyroid | ATC | protein polymerization | 159/6293 | 297/18723 | 9.33e-13 | 3.96e-11 | 159 |
| GO:001063926 | Thyroid | ATC | negative regulation of organelle organization | 179/6293 | 348/18723 | 3.74e-12 | 1.50e-10 | 179 |
| Page: 1 2 3 4 5 6 7 8 |
| Pathway ID | Tissue | Disease Stage | Description | Gene Ratio | Bg Ratio | pvalue | p.adjust | qvalue | Count |
| Page: 1 |
Top |
Cell-cell communication analysis |
| Identification of potential cell-cell interactions between two cell types and their ligand-receptor pairs for different disease states |
| Ligand | Receptor | LRpair | Pathway | Tissue | Disease Stage |
| Page: 1 |
Top |
Single-cell gene regulatory network inference analysis |
| Find out the significant the regulons (TFs) and the target genes of each regulon across cell types for different disease states |
| TF | Cell Type | Tissue | Disease Stage | Target Gene | RSS | Regulon Activity |
| ∗The dot plots of a searched regulon are shown for all cell subpopulations in each disease state of each tissue based on the regulon specific score inferred using pySCENIC and by calculating the average expression. |
| Page: 1 |
Top |
Somatic mutation of malignant transformation related genes |
| Annotation of somatic variants for genes involved in malignant transformation |
| Hugo Symbol | Variant Class | Variant Classification | dbSNP RS | HGVSc | HGVSp | HGVSp Short | SWISSPROT | BIOTYPE | SIFT | PolyPhen | Tumor Sample Barcode | Tissue | Histology | Sex | Age | Stage | Therapy Types | Drugs | Outcome |
| FBXO5 | SNV | Missense_Mutation | c.1063A>C | p.Thr355Pro | p.T355P | Q9UKT4 | protein_coding | tolerated(0.14) | benign(0.003) | TCGA-BH-A0C0-01 | Breast | breast invasive carcinoma | Female | <65 | I/II | Chemotherapy | carboplatin | SD | |
| FBXO5 | deletion | In_Frame_Del | c.1204_1218delGGATTTGATTATTGT | p.Gly402_Cys406del | p.G402_C406del | Q9UKT4 | protein_coding | TCGA-D8-A1JK-01 | Breast | breast invasive carcinoma | Female | >=65 | I/II | Unknown | Unknown | SD | |||
| FBXO5 | SNV | Missense_Mutation | novel | c.1220C>T | p.Thr407Met | p.T407M | Q9UKT4 | protein_coding | deleterious(0) | probably_damaging(0.998) | TCGA-2W-A8YY-01 | Cervix | cervical & endocervical cancer | Female | <65 | I/II | Chemotherapy | cisplatin | CR |
| FBXO5 | SNV | Missense_Mutation | c.1086N>A | p.Phe362Leu | p.F362L | Q9UKT4 | protein_coding | deleterious(0.01) | probably_damaging(0.994) | TCGA-FU-A3HZ-01 | Cervix | cervical & endocervical cancer | Female | <65 | I/II | Chemotherapy | cisplatin | CR | |
| FBXO5 | SNV | Missense_Mutation | c.668N>G | p.Ile223Ser | p.I223S | Q9UKT4 | protein_coding | deleterious(0.01) | benign(0.039) | TCGA-FU-A3HZ-01 | Cervix | cervical & endocervical cancer | Female | <65 | I/II | Chemotherapy | cisplatin | CR | |
| FBXO5 | SNV | Missense_Mutation | rs199732439 | c.649N>T | p.Arg217Trp | p.R217W | Q9UKT4 | protein_coding | tolerated(0.17) | benign(0) | TCGA-VS-A953-01 | Cervix | cervical & endocervical cancer | Female | <65 | I/II | Unknown | Unknown | PD |
| FBXO5 | SNV | Missense_Mutation | rs766507735 | c.659N>G | p.Leu220Arg | p.L220R | Q9UKT4 | protein_coding | deleterious(0) | possibly_damaging(0.853) | TCGA-A6-6780-01 | Colorectum | colon adenocarcinoma | Male | >=65 | I/II | Unknown | Unknown | SD |
| FBXO5 | SNV | Missense_Mutation | c.927T>G | p.Phe309Leu | p.F309L | Q9UKT4 | protein_coding | tolerated(0.43) | benign(0) | TCGA-AA-3977-01 | Colorectum | colon adenocarcinoma | Male | >=65 | I/II | Unknown | Unknown | SD | |
| FBXO5 | SNV | Missense_Mutation | c.329C>G | p.Thr110Ser | p.T110S | Q9UKT4 | protein_coding | tolerated(0.54) | benign(0.007) | TCGA-AY-A71X-01 | Colorectum | colon adenocarcinoma | Female | <65 | I/II | Unknown | Unknown | SD | |
| FBXO5 | SNV | Missense_Mutation | c.1073G>A | p.Arg358Gln | p.R358Q | Q9UKT4 | protein_coding | deleterious(0) | possibly_damaging(0.895) | TCGA-AZ-6601-01 | Colorectum | colon adenocarcinoma | Male | >=65 | I/II | Unknown | Unknown | PD |
| Page: 1 2 3 4 5 |
Top |
Related drugs of malignant transformation related genes |
| Identification of chemicals and drugs interact with genes involved in malignant transfromation |
| (DGIdb 4.0) |
| Entrez ID | Symbol | Category | Interaction Types | Drug Claim Name | Drug Name | PMIDs |
| Page: 1 |

Copyright 2023-Present -The University of Texas Health Science Center at Houston |