
|
|||||
|
 | |
| |
| |
| |
| |
| |
|
Gene: ERBB4 |
Gene summary for ERBB4 |
| Gene information | Species | Human | Gene symbol | ERBB4 | Gene ID | 2066 |
| Gene name | erb-b2 receptor tyrosine kinase 4 | |
| Gene Alias | ALS19 | |
| Cytomap | 2q34 | |
| Gene Type | protein-coding | GO ID | GO:0000165 | UniProtAcc | Q15303 |
Top |
Malignant transformation analysis |
| Identification of the aberrant gene expression in precancerous and cancerous lesions by comparing the gene expression of stem-like cells in diseased tissues with normal stem cells |
| Entrez ID | Symbol | Replicates | Species | Organ | Tissue | Adj P-value | Log2FC | Malignancy |
| 2066 | ERBB4 | HTA11_2487_2000001011 | Human | Colorectum | SER | 1.00e-02 | 1.65e-01 | -0.1808 |
| 2066 | ERBB4 | HTA11_1938_2000001011 | Human | Colorectum | AD | 2.62e-04 | 2.28e-01 | -0.0811 |
| 2066 | ERBB4 | HTA11_78_2000001011 | Human | Colorectum | AD | 3.71e-03 | 1.98e-01 | -0.1088 |
| 2066 | ERBB4 | HTA11_347_2000001011 | Human | Colorectum | AD | 7.28e-03 | 1.45e-01 | -0.1954 |
| 2066 | ERBB4 | HTA11_3361_2000001011 | Human | Colorectum | AD | 2.13e-02 | 1.76e-01 | -0.1207 |
| 2066 | ERBB4 | HTA11_83_2000001011 | Human | Colorectum | SER | 1.84e-03 | 2.30e-01 | -0.1526 |
| 2066 | ERBB4 | HTA11_696_2000001011 | Human | Colorectum | AD | 3.36e-05 | 1.36e-01 | -0.1464 |
| 2066 | ERBB4 | HTA11_1391_2000001011 | Human | Colorectum | AD | 1.92e-07 | 2.65e-01 | -0.059 |
| 2066 | ERBB4 | HTA11_6818_2000001021 | Human | Colorectum | AD | 2.94e-02 | 2.04e-01 | 0.0588 |
| 2066 | ERBB4 | HTA11_99999965104_69814 | Human | Colorectum | MSS | 5.64e-03 | 1.76e-01 | 0.281 |
| 2066 | ERBB4 | AEH-subject1 | Human | Endometrium | AEH | 5.92e-81 | 1.36e+00 | -0.3059 |
| 2066 | ERBB4 | AEH-subject2 | Human | Endometrium | AEH | 2.76e-45 | 1.10e+00 | -0.2525 |
| 2066 | ERBB4 | AEH-subject3 | Human | Endometrium | AEH | 5.60e-37 | 8.95e-01 | -0.2576 |
| 2066 | ERBB4 | AEH-subject4 | Human | Endometrium | AEH | 3.08e-37 | 1.05e+00 | -0.2657 |
| 2066 | ERBB4 | AEH-subject5 | Human | Endometrium | AEH | 9.67e-121 | 1.95e+00 | -0.2953 |
| 2066 | ERBB4 | EEC-subject1 | Human | Endometrium | EEC | 1.60e-58 | 1.21e+00 | -0.2682 |
| 2066 | ERBB4 | EEC-subject2 | Human | Endometrium | EEC | 2.26e-121 | 1.72e+00 | -0.2607 |
| 2066 | ERBB4 | EEC-subject4 | Human | Endometrium | EEC | 2.61e-44 | 1.04e+00 | -0.2571 |
| 2066 | ERBB4 | EEC-subject5 | Human | Endometrium | EEC | 6.13e-26 | 8.41e-01 | -0.249 |
| 2066 | ERBB4 | GSM6177622_NYU_UCEC3_lib1_lib1 | Human | Endometrium | EEC | 9.65e-05 | 2.58e-01 | -0.1917 |
| Page: 1 2 3 |
| Tissue | Expression Dynamics | Abbreviation |
| Colorectum (GSE201348) | 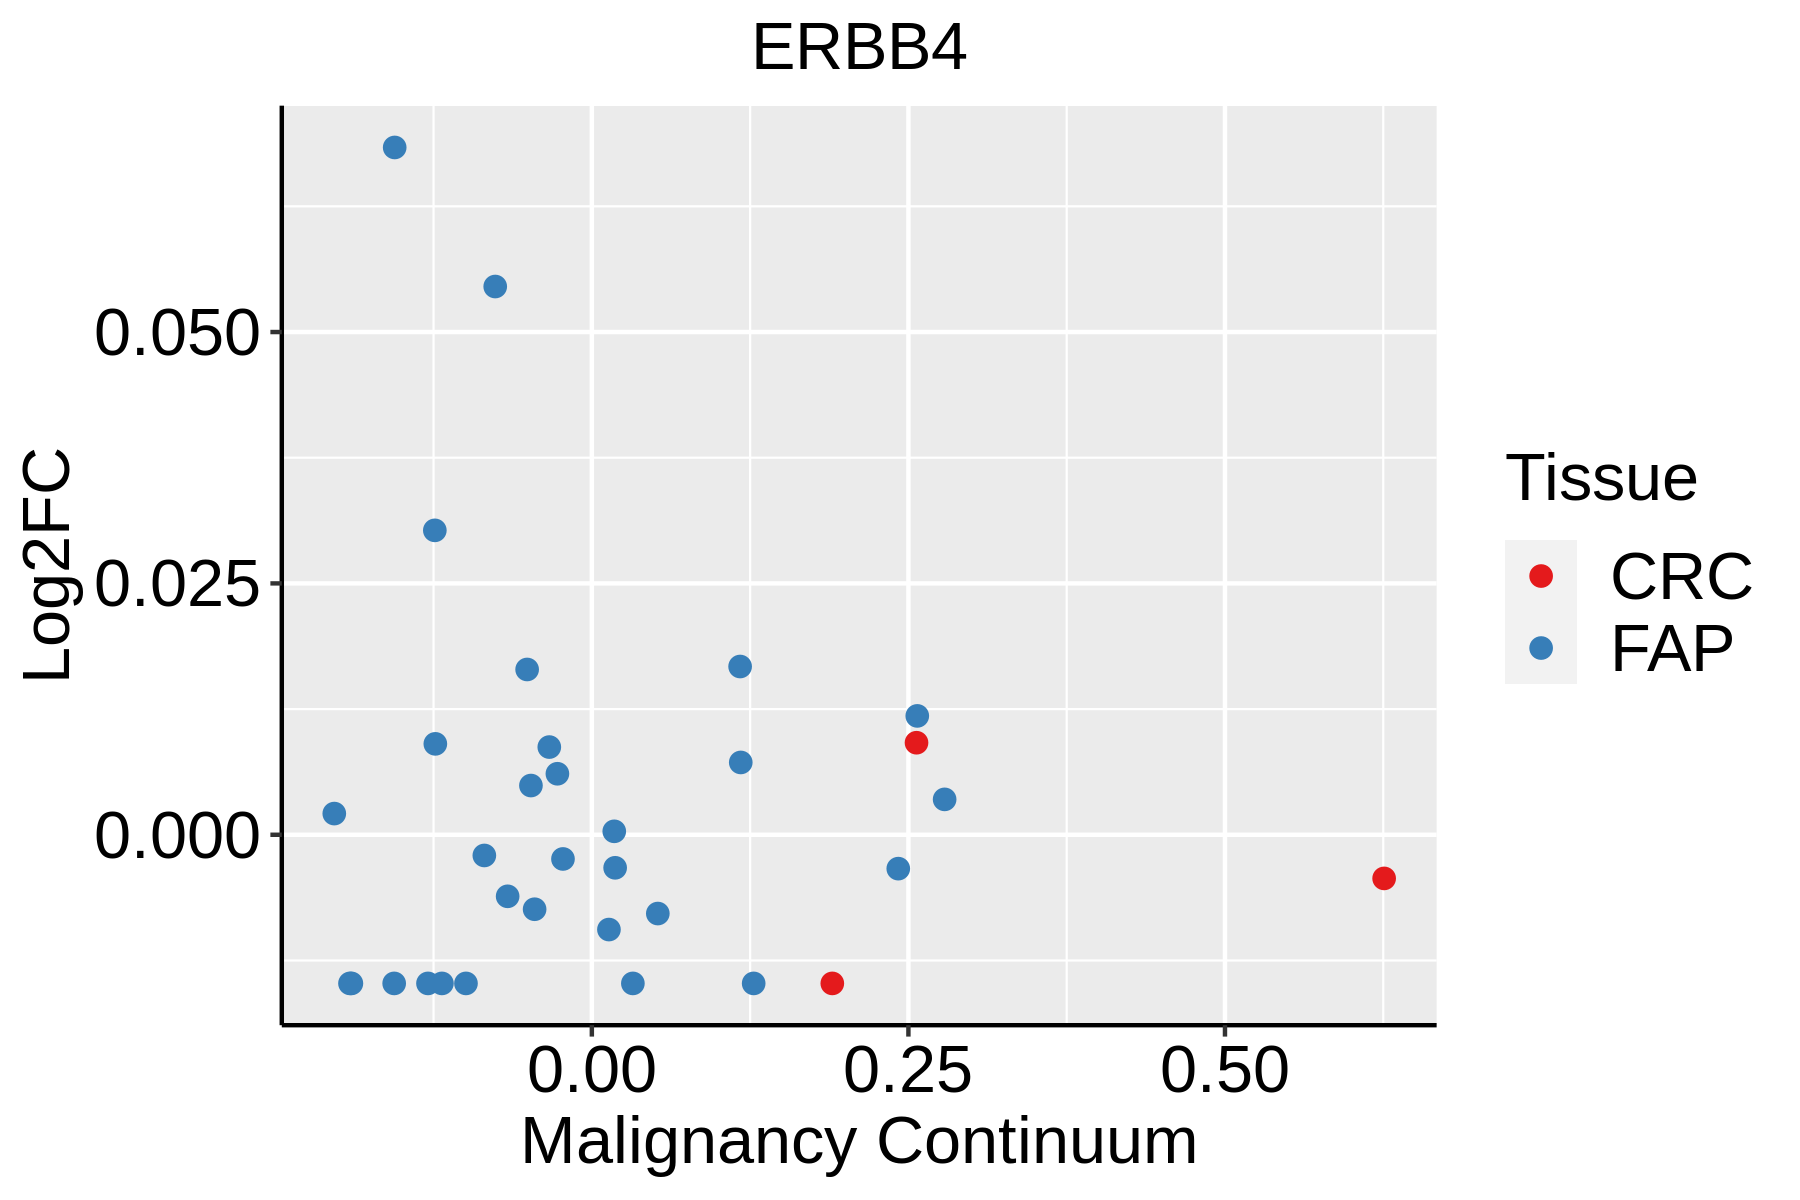 | FAP: Familial adenomatous polyposis |
| CRC: Colorectal cancer | ||
| Colorectum (HTA11) |  | AD: Adenomas |
| SER: Sessile serrated lesions | ||
| MSI-H: Microsatellite-high colorectal cancer | ||
| MSS: Microsatellite stable colorectal cancer | ||
| Endometrium |  | AEH: Atypical endometrial hyperplasia |
| EEC: Endometrioid Cancer | ||
| Lung | 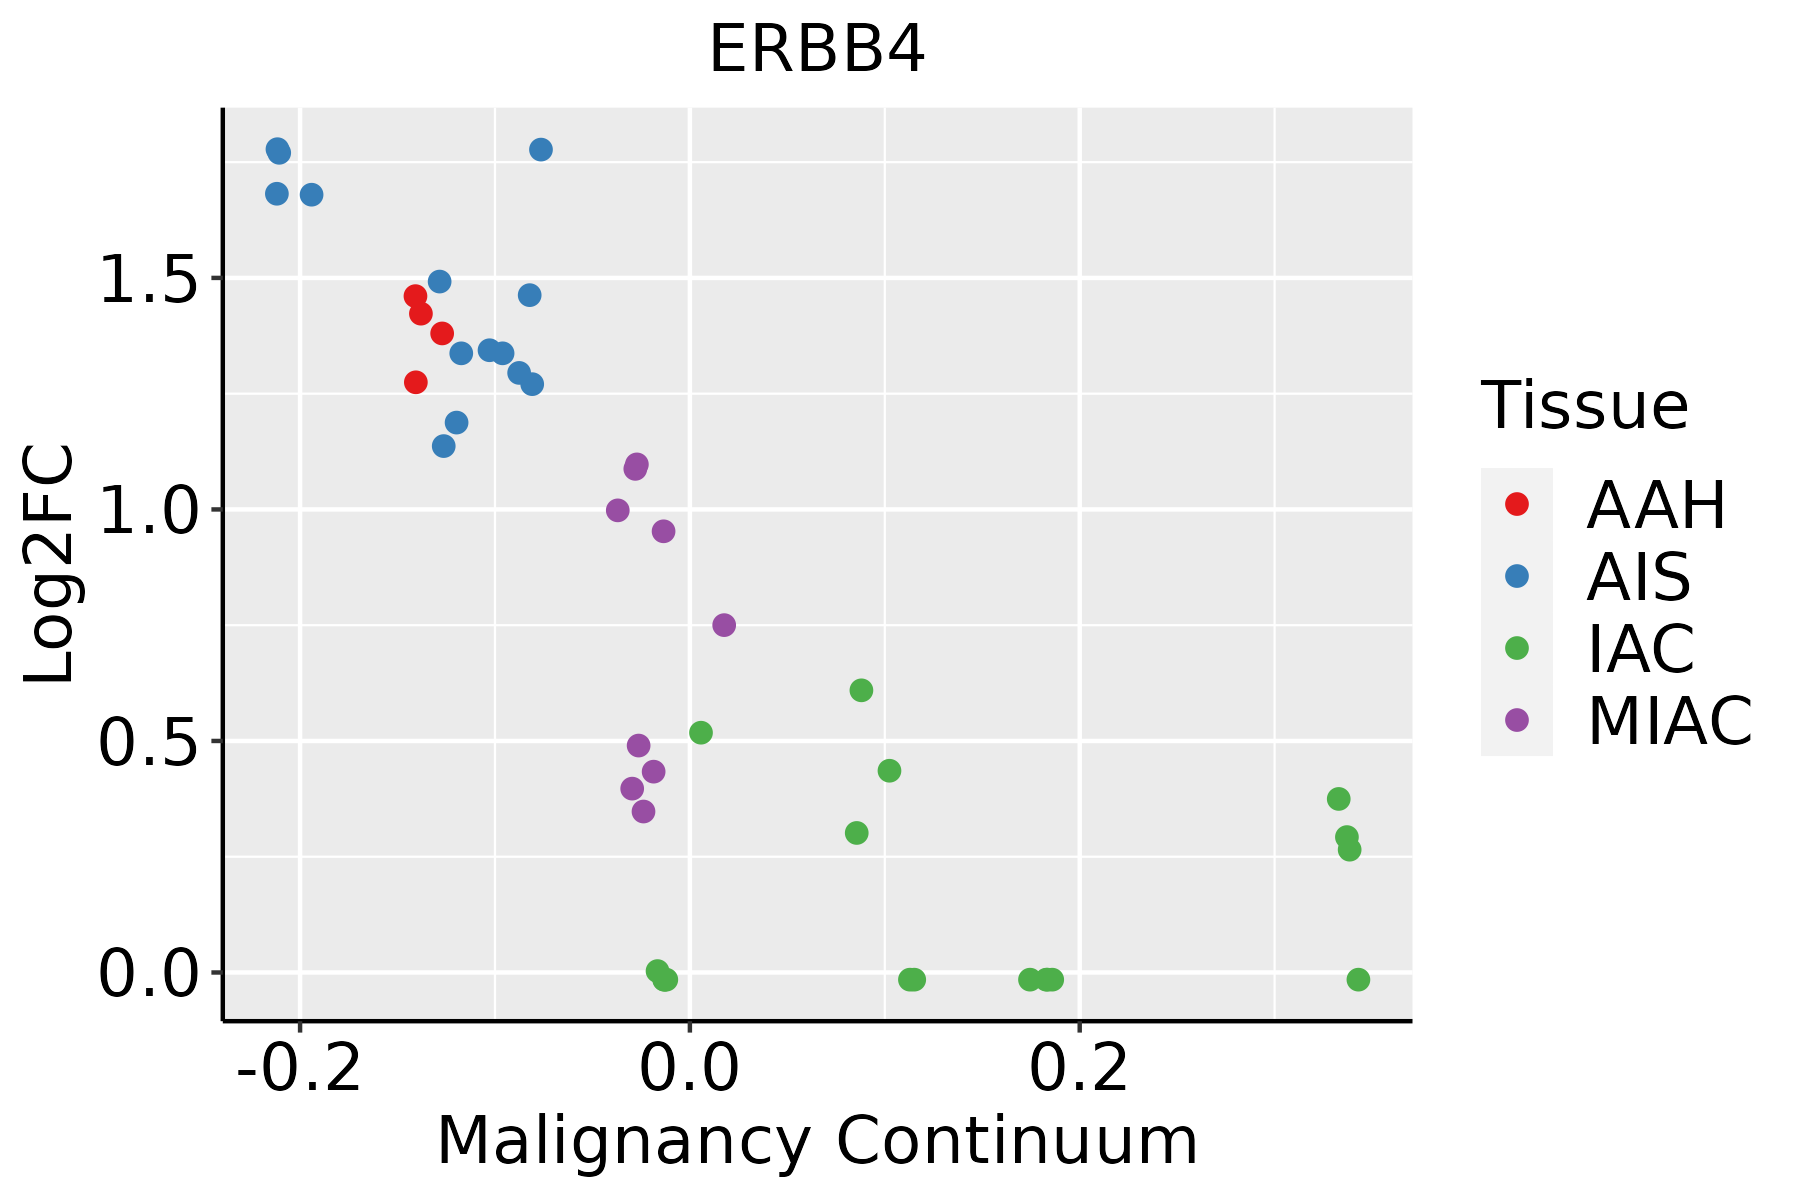 | AAH: Atypical adenomatous hyperplasia |
| AIS: Adenocarcinoma in situ | ||
| IAC: Invasive lung adenocarcinoma | ||
| MIA: Minimally invasive adenocarcinoma |
| ∗log2FC in expression of this searched gene in stem-like cells from each diseased tissue sample relative to stem-like cells in normal samples in each tissue plotted against the malignancy continuum. Samples are colored based on if they are from different disease stage. |
Top |
Malignant transformation related pathway analysis |
| Find out the enriched GO biological processes and KEGG pathways involved in transition from healthy to precancer to cancer |
| Tissue | Disease Stage | Enriched GO biological Processes |
| Colorectum | AD |  |
| Colorectum | SER |  |
| Colorectum | MSS |  |
| Colorectum | MSI-H |  |
| Colorectum | FAP |  |
| ∗Top 15 enriched GO BP terms are showed in the bar plot of each disease state in each tissue. Each row represents a significant GO biological process which is colored according to the -log10(p.adjust). |
| Page: 1 2 3 4 5 6 7 8 9 |
| GO ID | Tissue | Disease Stage | Description | Gene Ratio | Bg Ratio | pvalue | p.adjust | Count |
| GO:0001655 | Colorectum | MSS | urogenital system development | 81/3467 | 338/18723 | 6.88e-03 | 4.43e-02 | 81 |
| GO:0031099 | Colorectum | MSS | regeneration | 51/3467 | 198/18723 | 6.99e-03 | 4.49e-02 | 51 |
| GO:0048762 | Colorectum | MSS | mesenchymal cell differentiation | 59/3467 | 236/18723 | 7.79e-03 | 4.84e-02 | 59 |
| GO:190382916 | Endometrium | AEH | positive regulation of cellular protein localization | 66/2100 | 276/18723 | 1.57e-09 | 1.36e-07 | 66 |
| GO:00605376 | Endometrium | AEH | muscle tissue development | 83/2100 | 403/18723 | 2.57e-08 | 1.50e-06 | 83 |
| GO:000166710 | Endometrium | AEH | ameboidal-type cell migration | 90/2100 | 475/18723 | 3.73e-07 | 1.57e-05 | 90 |
| GO:004873216 | Endometrium | AEH | gland development | 83/2100 | 436/18723 | 8.62e-07 | 3.11e-05 | 83 |
| GO:00147065 | Endometrium | AEH | striated muscle tissue development | 75/2100 | 384/18723 | 1.06e-06 | 3.62e-05 | 75 |
| GO:00016556 | Endometrium | AEH | urogenital system development | 67/2100 | 338/18723 | 2.30e-06 | 6.76e-05 | 67 |
| GO:00720015 | Endometrium | AEH | renal system development | 61/2100 | 302/18723 | 3.43e-06 | 9.24e-05 | 61 |
| GO:00343299 | Endometrium | AEH | cell junction assembly | 78/2100 | 420/18723 | 4.80e-06 | 1.24e-04 | 78 |
| GO:00330022 | Endometrium | AEH | muscle cell proliferation | 51/2100 | 248/18723 | 1.26e-05 | 2.77e-04 | 51 |
| GO:00434105 | Endometrium | AEH | positive regulation of MAPK cascade | 84/2100 | 480/18723 | 2.19e-05 | 4.25e-04 | 84 |
| GO:00018224 | Endometrium | AEH | kidney development | 57/2100 | 293/18723 | 2.25e-05 | 4.35e-04 | 57 |
| GO:00609932 | Endometrium | AEH | kidney morphogenesis | 24/2100 | 93/18723 | 6.73e-05 | 1.04e-03 | 24 |
| GO:00310997 | Endometrium | AEH | regeneration | 41/2100 | 198/18723 | 7.29e-05 | 1.11e-03 | 41 |
| GO:00487625 | Endometrium | AEH | mesenchymal cell differentiation | 46/2100 | 236/18723 | 1.27e-04 | 1.74e-03 | 46 |
| GO:00604853 | Endometrium | AEH | mesenchyme development | 54/2100 | 291/18723 | 1.34e-04 | 1.83e-03 | 54 |
| GO:003367414 | Endometrium | AEH | positive regulation of kinase activity | 78/2100 | 467/18723 | 2.03e-04 | 2.54e-03 | 78 |
| GO:000863710 | Endometrium | AEH | apoptotic mitochondrial changes | 25/2100 | 107/18723 | 2.65e-04 | 3.09e-03 | 25 |
| Page: 1 2 3 4 5 6 7 8 9 10 |
| Pathway ID | Tissue | Disease Stage | Description | Gene Ratio | Bg Ratio | pvalue | p.adjust | qvalue | Count |
| hsa05014 | Colorectum | AD | Amyotrophic lateral sclerosis | 164/2092 | 364/8465 | 4.28e-18 | 1.27e-16 | 8.09e-17 | 164 |
| hsa05205 | Colorectum | AD | Proteoglycans in cancer | 70/2092 | 205/8465 | 1.37e-03 | 8.46e-03 | 5.39e-03 | 70 |
| hsa04012 | Colorectum | AD | ErbB signaling pathway | 31/2092 | 85/8465 | 1.02e-02 | 3.91e-02 | 2.50e-02 | 31 |
| hsa050141 | Colorectum | AD | Amyotrophic lateral sclerosis | 164/2092 | 364/8465 | 4.28e-18 | 1.27e-16 | 8.09e-17 | 164 |
| hsa052051 | Colorectum | AD | Proteoglycans in cancer | 70/2092 | 205/8465 | 1.37e-03 | 8.46e-03 | 5.39e-03 | 70 |
| hsa040121 | Colorectum | AD | ErbB signaling pathway | 31/2092 | 85/8465 | 1.02e-02 | 3.91e-02 | 2.50e-02 | 31 |
| hsa050142 | Colorectum | SER | Amyotrophic lateral sclerosis | 138/1580 | 364/8465 | 9.89e-19 | 2.99e-17 | 2.17e-17 | 138 |
| hsa052052 | Colorectum | SER | Proteoglycans in cancer | 58/1580 | 205/8465 | 4.37e-04 | 3.82e-03 | 2.77e-03 | 58 |
| hsa050143 | Colorectum | SER | Amyotrophic lateral sclerosis | 138/1580 | 364/8465 | 9.89e-19 | 2.99e-17 | 2.17e-17 | 138 |
| hsa052053 | Colorectum | SER | Proteoglycans in cancer | 58/1580 | 205/8465 | 4.37e-04 | 3.82e-03 | 2.77e-03 | 58 |
| hsa050144 | Colorectum | MSS | Amyotrophic lateral sclerosis | 156/1875 | 364/8465 | 1.43e-19 | 4.62e-18 | 2.83e-18 | 156 |
| hsa052054 | Colorectum | MSS | Proteoglycans in cancer | 65/1875 | 205/8465 | 8.66e-04 | 5.38e-03 | 3.29e-03 | 65 |
| hsa040122 | Colorectum | MSS | ErbB signaling pathway | 30/1875 | 85/8465 | 3.73e-03 | 1.67e-02 | 1.02e-02 | 30 |
| hsa050145 | Colorectum | MSS | Amyotrophic lateral sclerosis | 156/1875 | 364/8465 | 1.43e-19 | 4.62e-18 | 2.83e-18 | 156 |
| hsa052055 | Colorectum | MSS | Proteoglycans in cancer | 65/1875 | 205/8465 | 8.66e-04 | 5.38e-03 | 3.29e-03 | 65 |
| hsa040123 | Colorectum | MSS | ErbB signaling pathway | 30/1875 | 85/8465 | 3.73e-03 | 1.67e-02 | 1.02e-02 | 30 |
| hsa0501420 | Endometrium | AEH | Amyotrophic lateral sclerosis | 123/1197 | 364/8465 | 2.17e-22 | 7.82e-21 | 5.72e-21 | 123 |
| hsa0520518 | Endometrium | AEH | Proteoglycans in cancer | 53/1197 | 205/8465 | 5.43e-06 | 6.53e-05 | 4.78e-05 | 53 |
| hsa05014110 | Endometrium | AEH | Amyotrophic lateral sclerosis | 123/1197 | 364/8465 | 2.17e-22 | 7.82e-21 | 5.72e-21 | 123 |
| hsa0520519 | Endometrium | AEH | Proteoglycans in cancer | 53/1197 | 205/8465 | 5.43e-06 | 6.53e-05 | 4.78e-05 | 53 |
| Page: 1 2 |
Top |
Cell-cell communication analysis |
| Identification of potential cell-cell interactions between two cell types and their ligand-receptor pairs for different disease states |
| Ligand | Receptor | LRpair | Pathway | Tissue | Disease Stage |
| HBEGF | ERBB4 | HBEGF_ERBB4 | EGF | Cervix | CC |
| HBEGF | ERBB2_ERBB4 | HBEGF_ERBB2_ERBB4 | EGF | Cervix | CC |
| NRG1 | ERBB4 | NRG1_ERBB4 | NRG | Cervix | CC |
| NRG1 | ERBB2_ERBB4 | NRG1_ERBB2_ERBB4 | NRG | Cervix | CC |
| NRG4 | ERBB4 | NRG4_ERBB4 | NRG | Cervix | CC |
| NRG4 | ERBB2_ERBB4 | NRG4_ERBB2_ERBB4 | NRG | Cervix | CC |
| NRG1 | ERBB4 | NRG1_ERBB4 | NRG | CRC | ADJ |
| NRG3 | ERBB4 | NRG3_ERBB4 | NRG | CRC | ADJ |
| HBEGF | ERBB4 | HBEGF_ERBB4 | EGF | Endometrium | ADJ |
| EREG | ERBB4 | EREG_ERBB4 | EGF | Endometrium | ADJ |
| NRG2 | ERBB4 | NRG2_ERBB4 | NRG | Endometrium | ADJ |
| HBEGF | ERBB4 | HBEGF_ERBB4 | EGF | Endometrium | AEH |
| EREG | ERBB4 | EREG_ERBB4 | EGF | Endometrium | AEH |
| HBEGF | ERBB4 | HBEGF_ERBB4 | EGF | Endometrium | EEC |
| EREG | ERBB4 | EREG_ERBB4 | EGF | Endometrium | EEC |
| HBEGF | ERBB4 | HBEGF_ERBB4 | EGF | Liver | Healthy |
| EREG | ERBB4 | EREG_ERBB4 | EGF | Liver | Healthy |
| NRG1 | ERBB4 | NRG1_ERBB4 | NRG | Liver | Healthy |
| NRG3 | ERBB4 | NRG3_ERBB4 | NRG | Liver | Healthy |
| HBEGF | ERBB4 | HBEGF_ERBB4 | EGF | Liver | Precancer |
| Page: 1 |
Top |
Single-cell gene regulatory network inference analysis |
| Find out the significant the regulons (TFs) and the target genes of each regulon across cell types for different disease states |
| TF | Cell Type | Tissue | Disease Stage | Target Gene | RSS | Regulon Activity |
| ∗The dot plots of a searched regulon are shown for all cell subpopulations in each disease state of each tissue based on the regulon specific score inferred using pySCENIC and by calculating the average expression. |
| Page: 1 |
Top |
Somatic mutation of malignant transformation related genes |
| Annotation of somatic variants for genes involved in malignant transformation |
| Hugo Symbol | Variant Class | Variant Classification | dbSNP RS | HGVSc | HGVSp | HGVSp Short | SWISSPROT | BIOTYPE | SIFT | PolyPhen | Tumor Sample Barcode | Tissue | Histology | Sex | Age | Stage | Therapy Types | Drugs | Outcome |
| ERBB4 | SNV | Missense_Mutation | c.2759N>G | p.Pro920Arg | p.P920R | Q15303 | protein_coding | deleterious(0) | probably_damaging(0.996) | TCGA-A2-A3XT-01 | Breast | breast invasive carcinoma | Female | <65 | I/II | Chemotherapy | cyclophosphamide | PR | |
| ERBB4 | SNV | Missense_Mutation | c.3430N>C | p.Glu1144Gln | p.E1144Q | Q15303 | protein_coding | tolerated(0.32) | benign(0.107) | TCGA-AC-A23H-01 | Breast | breast invasive carcinoma | Female | >=65 | I/II | Unknown | Unknown | PD | |
| ERBB4 | SNV | Missense_Mutation | rs760630823 | c.551N>T | p.Ser184Leu | p.S184L | Q15303 | protein_coding | tolerated(0.31) | benign(0) | TCGA-AC-A23H-01 | Breast | breast invasive carcinoma | Female | >=65 | I/II | Unknown | Unknown | PD |
| ERBB4 | SNV | Missense_Mutation | novel | c.1201N>C | p.Phe401Leu | p.F401L | Q15303 | protein_coding | deleterious(0.02) | possibly_damaging(0.478) | TCGA-AN-A046-01 | Breast | breast invasive carcinoma | Female | >=65 | I/II | Unknown | Unknown | SD |
| ERBB4 | SNV | Missense_Mutation | c.3613G>A | p.Glu1205Lys | p.E1205K | Q15303 | protein_coding | tolerated(0.14) | probably_damaging(0.985) | TCGA-AN-A0AT-01 | Breast | breast invasive carcinoma | Female | <65 | I/II | Unknown | Unknown | SD | |
| ERBB4 | SNV | Missense_Mutation | novel | c.833N>G | p.Asn278Ser | p.N278S | Q15303 | protein_coding | deleterious(0.02) | probably_damaging(0.996) | TCGA-AQ-A54O-01 | Breast | breast invasive carcinoma | Male | <65 | I/II | Chemotherapy | adriamycin | CR |
| ERBB4 | SNV | Missense_Mutation | rs568046921 | c.2108N>A | p.Thr703Lys | p.T703K | Q15303 | protein_coding | tolerated(0.48) | benign(0.086) | TCGA-B6-A0RG-01 | Breast | breast invasive carcinoma | Female | <65 | I/II | Unknown | Unknown | SD |
| ERBB4 | SNV | Missense_Mutation | c.515N>G | p.Pro172Arg | p.P172R | Q15303 | protein_coding | tolerated(0.54) | benign(0.063) | TCGA-BH-A0EE-01 | Breast | breast invasive carcinoma | Female | >=65 | I/II | Chemotherapy | docetaxel | SD | |
| ERBB4 | SNV | Missense_Mutation | c.3011N>C | p.Phe1004Ser | p.F1004S | Q15303 | protein_coding | deleterious(0.01) | possibly_damaging(0.543) | TCGA-BH-A18J-01 | Breast | breast invasive carcinoma | Female | <65 | III/IV | Unknown | Unknown | PD | |
| ERBB4 | SNV | Missense_Mutation | novel | c.1444A>G | p.Asn482Asp | p.N482D | Q15303 | protein_coding | tolerated(0.41) | benign(0.028) | TCGA-BH-A1EN-01 | Breast | breast invasive carcinoma | Female | >=65 | I/II | Unknown | Unknown | SD |
| Page: 1 2 3 4 5 6 7 8 9 10 11 12 13 14 15 16 17 18 19 20 21 22 23 24 25 26 27 28 29 30 31 |
Top |
Related drugs of malignant transformation related genes |
| Identification of chemicals and drugs interact with genes involved in malignant transfromation |
| (DGIdb 4.0) |
| Entrez ID | Symbol | Category | Interaction Types | Drug Claim Name | Drug Name | PMIDs |
| 2066 | ERBB4 | KINASE, DRUGGABLE GENOME, CLINICALLY ACTIONABLE, DRUG RESISTANCE, TYROSINE KINASE | paliperidone | PALIPERIDONE | 25714000 | |
| 2066 | ERBB4 | KINASE, DRUGGABLE GENOME, CLINICALLY ACTIONABLE, DRUG RESISTANCE, TYROSINE KINASE | inhibitor | PELITINIB | PELITINIB | |
| 2066 | ERBB4 | KINASE, DRUGGABLE GENOME, CLINICALLY ACTIONABLE, DRUG RESISTANCE, TYROSINE KINASE | LAPATINIB | LAPATINIB | 25590338,19718025 | |
| 2066 | ERBB4 | KINASE, DRUGGABLE GENOME, CLINICALLY ACTIONABLE, DRUG RESISTANCE, TYROSINE KINASE | inhibitor | 178102588 | ||
| 2066 | ERBB4 | KINASE, DRUGGABLE GENOME, CLINICALLY ACTIONABLE, DRUG RESISTANCE, TYROSINE KINASE | ERLOTINIB | ERLOTINIB | ||
| 2066 | ERBB4 | KINASE, DRUGGABLE GENOME, CLINICALLY ACTIONABLE, DRUG RESISTANCE, TYROSINE KINASE | AC480 | AC-480 | ||
| 2066 | ERBB4 | KINASE, DRUGGABLE GENOME, CLINICALLY ACTIONABLE, DRUG RESISTANCE, TYROSINE KINASE | ILORASERTIB | ILORASERTIB | ||
| 2066 | ERBB4 | KINASE, DRUGGABLE GENOME, CLINICALLY ACTIONABLE, DRUG RESISTANCE, TYROSINE KINASE | LAPATINIB | LAPATINIB | 19718025 | |
| 2066 | ERBB4 | KINASE, DRUGGABLE GENOME, CLINICALLY ACTIONABLE, DRUG RESISTANCE, TYROSINE KINASE | Cetuximab | CETUXIMAB | 27207775 | |
| 2066 | ERBB4 | KINASE, DRUGGABLE GENOME, CLINICALLY ACTIONABLE, DRUG RESISTANCE, TYROSINE KINASE | AZD-1152-HQPA | AZD-1152-HQPA |
| Page: 1 2 3 4 5 6 7 8 |

Copyright 2023-Present -The University of Texas Health Science Center at Houston |