
|
|||||
|
 | |
| |
| |
| |
| |
| |
|
Gene: ENG |
Gene summary for ENG |
| Gene information | Species | Human | Gene symbol | ENG | Gene ID | 2022 |
| Gene name | endoglin | |
| Gene Alias | END | |
| Cytomap | 9q34.11 | |
| Gene Type | protein-coding | GO ID | GO:0001501 | UniProtAcc | P17813 |
Top |
Malignant transformation analysis |
| Identification of the aberrant gene expression in precancerous and cancerous lesions by comparing the gene expression of stem-like cells in diseased tissues with normal stem cells |
| Entrez ID | Symbol | Replicates | Species | Organ | Tissue | Adj P-value | Log2FC | Malignancy |
| 2022 | ENG | P2T-E | Human | Esophagus | ESCC | 3.59e-14 | 2.65e-01 | 0.1177 |
| 2022 | ENG | P4T-E | Human | Esophagus | ESCC | 3.79e-03 | 2.74e-01 | 0.1323 |
| 2022 | ENG | P8T-E | Human | Esophagus | ESCC | 1.95e-04 | 2.27e-01 | 0.0889 |
| 2022 | ENG | P9T-E | Human | Esophagus | ESCC | 1.61e-03 | 5.56e-01 | 0.1131 |
| 2022 | ENG | P11T-E | Human | Esophagus | ESCC | 4.66e-09 | 5.38e-01 | 0.1426 |
| 2022 | ENG | P16T-E | Human | Esophagus | ESCC | 1.34e-04 | 1.20e-01 | 0.1153 |
| 2022 | ENG | P19T-E | Human | Esophagus | ESCC | 1.02e-07 | 1.32e+00 | 0.1662 |
| 2022 | ENG | P23T-E | Human | Esophagus | ESCC | 1.07e-02 | 6.68e-01 | 0.108 |
| 2022 | ENG | P24T-E | Human | Esophagus | ESCC | 1.54e-11 | 6.48e-01 | 0.1287 |
| 2022 | ENG | P32T-E | Human | Esophagus | ESCC | 1.11e-05 | 6.31e-01 | 0.1666 |
| 2022 | ENG | P36T-E | Human | Esophagus | ESCC | 4.07e-02 | 6.81e-01 | 0.1187 |
| 2022 | ENG | P42T-E | Human | Esophagus | ESCC | 2.99e-04 | 5.52e-01 | 0.1175 |
| 2022 | ENG | P44T-E | Human | Esophagus | ESCC | 7.94e-06 | 4.45e-01 | 0.1096 |
| 2022 | ENG | P75T-E | Human | Esophagus | ESCC | 4.72e-11 | 2.31e-01 | 0.1125 |
| 2022 | ENG | P76T-E | Human | Esophagus | ESCC | 5.05e-10 | 1.57e-01 | 0.1207 |
| 2022 | ENG | P79T-E | Human | Esophagus | ESCC | 8.55e-04 | 2.62e-01 | 0.1154 |
| 2022 | ENG | P80T-E | Human | Esophagus | ESCC | 1.93e-07 | 4.01e-01 | 0.155 |
| 2022 | ENG | P130T-E | Human | Esophagus | ESCC | 1.46e-03 | 1.23e-01 | 0.1676 |
| 2022 | ENG | C07 | Human | Oral cavity | OSCC | 1.05e-02 | 7.07e-01 | 0.2491 |
| 2022 | ENG | EOLP-1 | Human | Oral cavity | EOLP | 3.43e-03 | 1.13e-01 | -0.0202 |
| Page: 1 2 |
| Tissue | Expression Dynamics | Abbreviation |
| Esophagus | 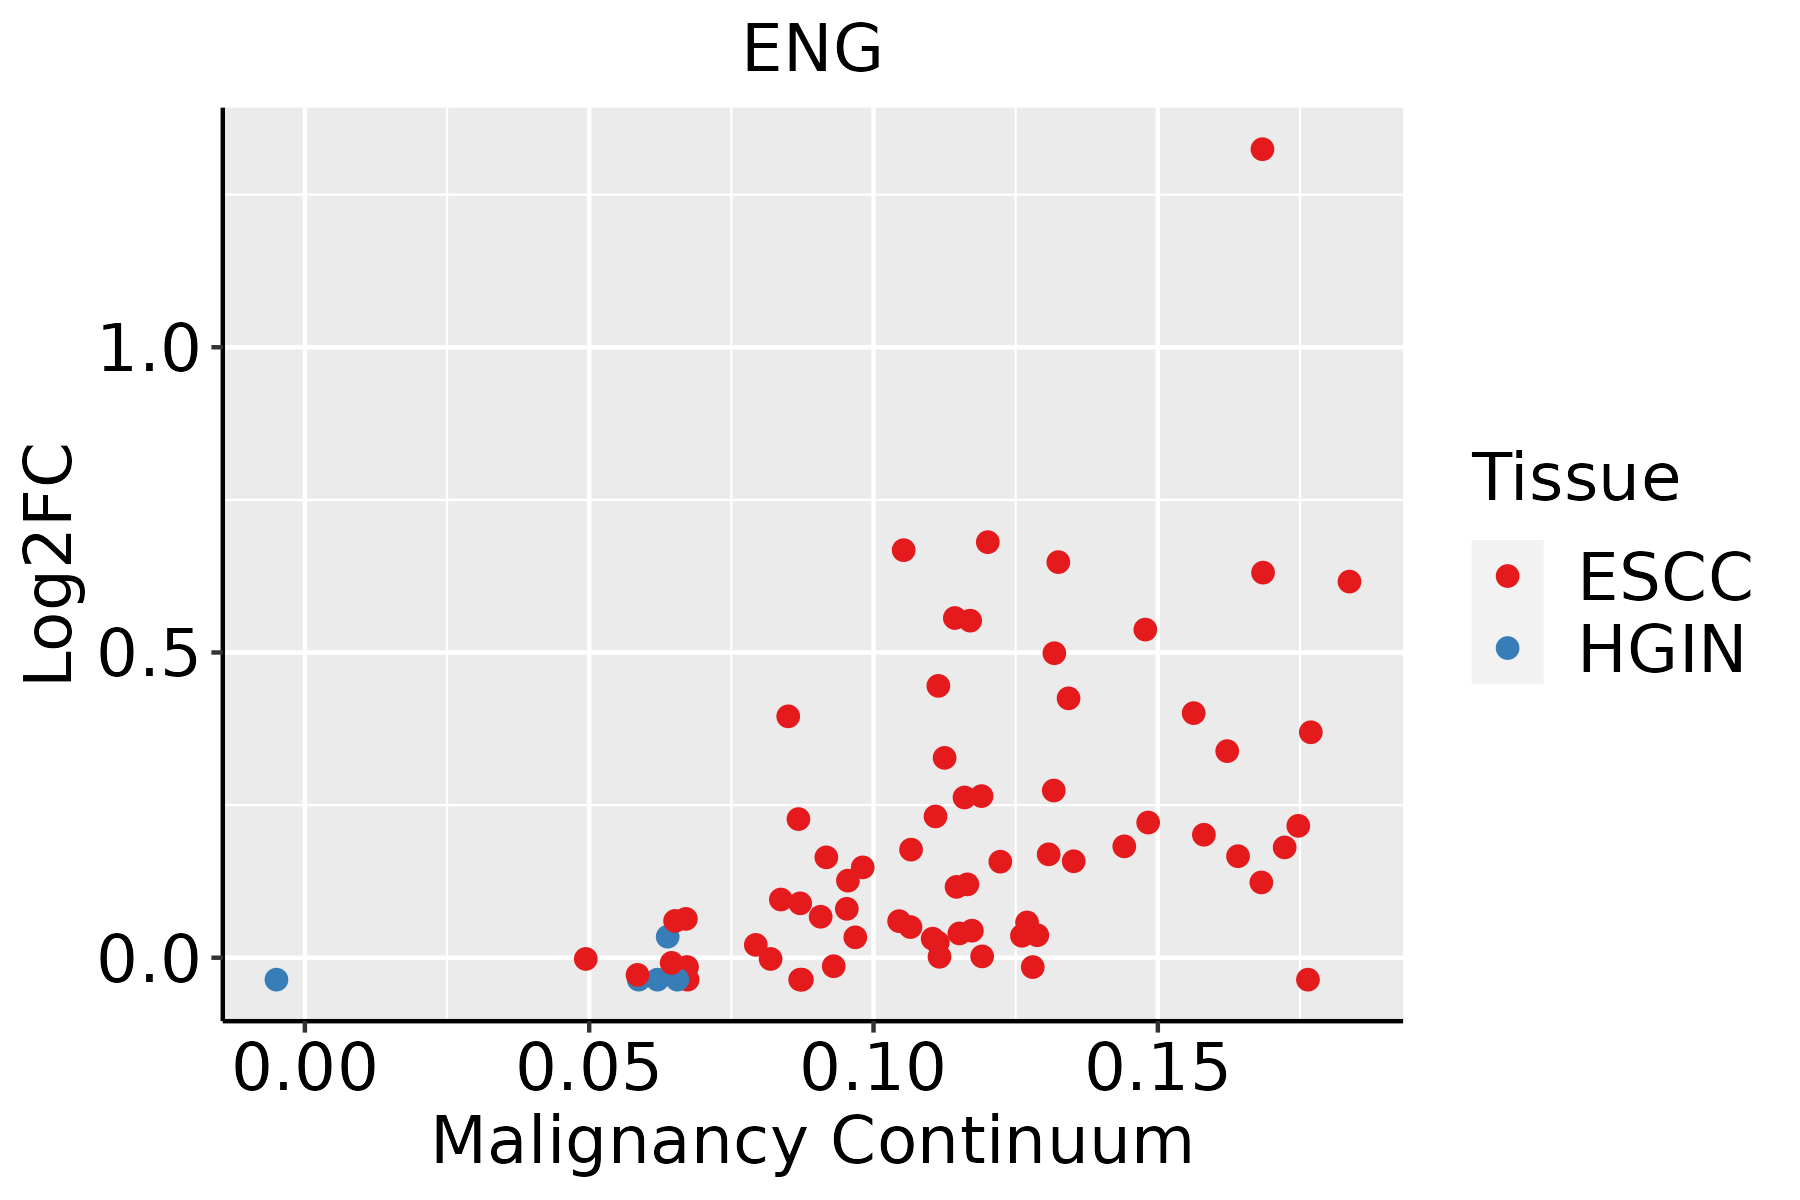 | ESCC: Esophageal squamous cell carcinoma |
| HGIN: High-grade intraepithelial neoplasias | ||
| LGIN: Low-grade intraepithelial neoplasias | ||
| Oral Cavity | 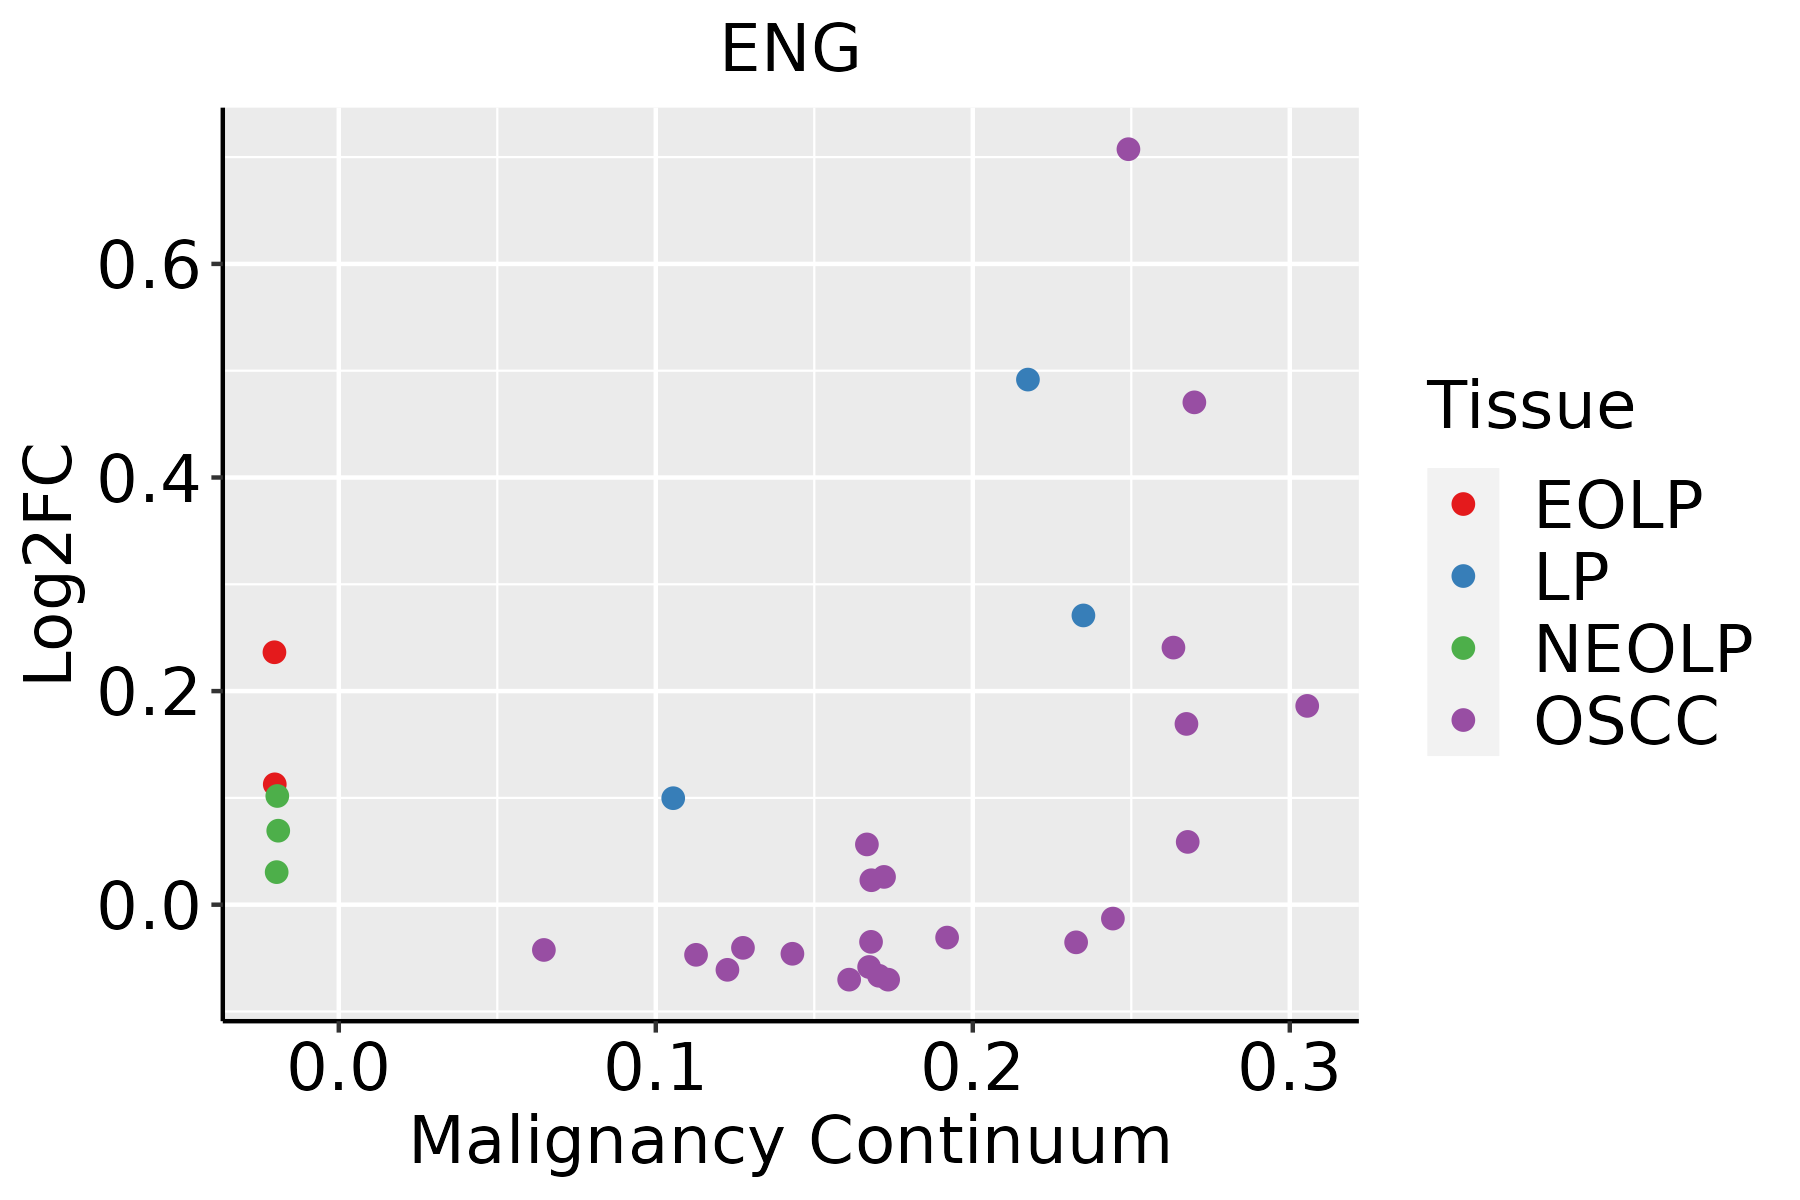 | EOLP: Erosive Oral lichen planus |
| LP: leukoplakia | ||
| NEOLP: Non-erosive oral lichen planus | ||
| OSCC: Oral squamous cell carcinoma | ||
| Thyroid |  | ATC: Anaplastic thyroid cancer |
| HT: Hashimoto's thyroiditis | ||
| PTC: Papillary thyroid cancer |
| ∗log2FC in expression of this searched gene in stem-like cells from each diseased tissue sample relative to stem-like cells in normal samples in each tissue plotted against the malignancy continuum. Samples are colored based on if they are from different disease stage. |
Top |
Malignant transformation related pathway analysis |
| Find out the enriched GO biological processes and KEGG pathways involved in transition from healthy to precancer to cancer |
| Tissue | Disease Stage | Enriched GO biological Processes |
| Colorectum | AD |  |
| Colorectum | SER |  |
| Colorectum | MSS |  |
| Colorectum | MSI-H |  |
| Colorectum | FAP |  |
| ∗Top 15 enriched GO BP terms are showed in the bar plot of each disease state in each tissue. Each row represents a significant GO biological process which is colored according to the -log10(p.adjust). |
| Page: 1 2 3 4 5 6 7 8 9 |
| GO ID | Tissue | Disease Stage | Description | Gene Ratio | Bg Ratio | pvalue | p.adjust | Count |
| GO:00301983 | Oral cavity | OSCC | extracellular matrix organization | 146/7305 | 301/18723 | 4.67e-04 | 2.77e-03 | 146 |
| GO:00018377 | Oral cavity | OSCC | epithelial to mesenchymal transition | 82/7305 | 157/18723 | 5.09e-04 | 2.98e-03 | 82 |
| GO:00452293 | Oral cavity | OSCC | external encapsulating structure organization | 147/7305 | 304/18723 | 5.30e-04 | 3.08e-03 | 147 |
| GO:00430623 | Oral cavity | OSCC | extracellular structure organization | 146/7305 | 302/18723 | 5.59e-04 | 3.23e-03 | 146 |
| GO:003196018 | Oral cavity | OSCC | response to corticosteroid | 86/7305 | 167/18723 | 6.79e-04 | 3.79e-03 | 86 |
| GO:00107173 | Oral cavity | OSCC | regulation of epithelial to mesenchymal transition | 54/7305 | 99/18723 | 1.21e-03 | 6.10e-03 | 54 |
| GO:0031952 | Oral cavity | OSCC | regulation of protein autophosphorylation | 27/7305 | 43/18723 | 1.35e-03 | 6.62e-03 | 27 |
| GO:00434916 | Oral cavity | OSCC | protein kinase B signaling | 103/7305 | 211/18723 | 2.29e-03 | 1.02e-02 | 103 |
| GO:00071789 | Oral cavity | OSCC | transmembrane receptor protein serine/threonine kinase signaling pathway | 165/7305 | 355/18723 | 2.31e-03 | 1.02e-02 | 165 |
| GO:00605378 | Oral cavity | OSCC | muscle tissue development | 185/7305 | 403/18723 | 2.60e-03 | 1.14e-02 | 185 |
| GO:00603484 | Oral cavity | OSCC | bone development | 99/7305 | 205/18723 | 4.13e-03 | 1.68e-02 | 99 |
| GO:00426927 | Oral cavity | OSCC | muscle cell differentiation | 175/7305 | 384/18723 | 4.79e-03 | 1.92e-02 | 175 |
| GO:0032963 | Oral cavity | OSCC | collagen metabolic process | 54/7305 | 104/18723 | 5.00e-03 | 1.96e-02 | 54 |
| GO:00518976 | Oral cavity | OSCC | positive regulation of protein kinase B signaling | 61/7305 | 120/18723 | 5.52e-03 | 2.14e-02 | 61 |
| GO:00147067 | Oral cavity | OSCC | striated muscle tissue development | 174/7305 | 384/18723 | 6.45e-03 | 2.40e-02 | 174 |
| GO:00605629 | Oral cavity | OSCC | epithelial tube morphogenesis | 149/7305 | 325/18723 | 6.73e-03 | 2.50e-02 | 149 |
| GO:0097084 | Oral cavity | OSCC | vascular associated smooth muscle cell development | 8/7305 | 10/18723 | 1.03e-02 | 3.53e-02 | 8 |
| GO:00518967 | Oral cavity | OSCC | regulation of protein kinase B signaling | 88/7305 | 185/18723 | 1.07e-02 | 3.64e-02 | 88 |
| GO:00487627 | Oral cavity | OSCC | mesenchymal cell differentiation | 109/7305 | 236/18723 | 1.43e-02 | 4.69e-02 | 109 |
| GO:004593625 | Oral cavity | EOLP | negative regulation of phosphate metabolic process | 105/2218 | 441/18723 | 1.05e-12 | 2.46e-10 | 105 |
| Page: 1 2 3 4 5 6 7 8 9 10 11 12 13 |
| Pathway ID | Tissue | Disease Stage | Description | Gene Ratio | Bg Ratio | pvalue | p.adjust | qvalue | Count |
| Page: 1 |
Top |
Cell-cell communication analysis |
| Identification of potential cell-cell interactions between two cell types and their ligand-receptor pairs for different disease states |
| Ligand | Receptor | LRpair | Pathway | Tissue | Disease Stage |
| Page: 1 |
Top |
Single-cell gene regulatory network inference analysis |
| Find out the significant the regulons (TFs) and the target genes of each regulon across cell types for different disease states |
| TF | Cell Type | Tissue | Disease Stage | Target Gene | RSS | Regulon Activity |
| ∗The dot plots of a searched regulon are shown for all cell subpopulations in each disease state of each tissue based on the regulon specific score inferred using pySCENIC and by calculating the average expression. |
| Page: 1 |
Top |
Somatic mutation of malignant transformation related genes |
| Annotation of somatic variants for genes involved in malignant transformation |
| Hugo Symbol | Variant Class | Variant Classification | dbSNP RS | HGVSc | HGVSp | HGVSp Short | SWISSPROT | BIOTYPE | SIFT | PolyPhen | Tumor Sample Barcode | Tissue | Histology | Sex | Age | Stage | Therapy Types | Drugs | Outcome |
| ENG | SNV | Missense_Mutation | c.1123N>A | p.Glu375Lys | p.E375K | P17813 | protein_coding | tolerated(0.25) | benign(0.001) | TCGA-3C-AALI-01 | Breast | breast invasive carcinoma | Female | <65 | I/II | Unspecific | Poly E | Complete Response | |
| ENG | SNV | Missense_Mutation | c.95N>C | p.Leu32Pro | p.L32P | P17813 | protein_coding | deleterious(0) | probably_damaging(0.998) | TCGA-BH-A8FZ-01 | Breast | breast invasive carcinoma | Female | <65 | I/II | Unknown | Unknown | SD | |
| ENG | SNV | Missense_Mutation | rs199675436 | c.121N>A | p.Glu41Lys | p.E41K | P17813 | protein_coding | tolerated(0.73) | benign(0.006) | TCGA-C8-A12M-01 | Breast | breast invasive carcinoma | Female | >=65 | I/II | Unknown | Unknown | SD |
| ENG | deletion | Frame_Shift_Del | novel | c.1166delN | p.Phe389SerfsTer32 | p.F389Sfs*32 | P17813 | protein_coding | TCGA-D8-A27V-01 | Breast | breast invasive carcinoma | Female | <65 | I/II | Hormone Therapy | tamoxiphen | SD | ||
| ENG | SNV | Missense_Mutation | c.1678N>G | p.Gln560Glu | p.Q560E | P17813 | protein_coding | tolerated(0.62) | benign(0.149) | TCGA-PN-A8MA-01 | Cervix | cervical & endocervical cancer | Female | <65 | I/II | Chemotherapy | cisplatin | SD | |
| ENG | SNV | Missense_Mutation | rs143054595 | c.1133N>T | p.Ala378Val | p.A378V | P17813 | protein_coding | tolerated(0.22) | benign(0.245) | TCGA-AA-3510-01 | Colorectum | colon adenocarcinoma | Male | >=65 | I/II | Unknown | Unknown | SD |
| ENG | SNV | Missense_Mutation | c.189N>C | p.Glu63Asp | p.E63D | P17813 | protein_coding | deleterious(0.02) | benign(0.011) | TCGA-AA-3815-01 | Colorectum | colon adenocarcinoma | Female | >=65 | I/II | Unknown | Unknown | SD | |
| ENG | SNV | Missense_Mutation | c.852G>T | p.Glu284Asp | p.E284D | P17813 | protein_coding | tolerated(0.37) | benign(0.003) | TCGA-AA-A010-01 | Colorectum | colon adenocarcinoma | Female | <65 | I/II | Chemotherapy | folinic | CR | |
| ENG | SNV | Missense_Mutation | rs761827492 | c.727G>A | p.Ala243Thr | p.A243T | P17813 | protein_coding | tolerated(0.73) | benign(0.001) | TCGA-CK-6746-01 | Colorectum | colon adenocarcinoma | Female | >=65 | I/II | Unknown | Unknown | SD |
| ENG | SNV | Missense_Mutation | c.176N>T | p.Asn59Ile | p.N59I | P17813 | protein_coding | deleterious(0.01) | possibly_damaging(0.641) | TCGA-CM-4744-01 | Colorectum | colon adenocarcinoma | Male | >=65 | I/II | Unknown | Unknown | SD |
| Page: 1 2 3 4 5 |
Top |
Related drugs of malignant transformation related genes |
| Identification of chemicals and drugs interact with genes involved in malignant transfromation |
| (DGIdb 4.0) |
| Entrez ID | Symbol | Category | Interaction Types | Drug Claim Name | Drug Name | PMIDs |
| 2022 | ENG | CLINICALLY ACTIONABLE, EXTERNAL SIDE OF PLASMA MEMBRANE, CELL SURFACE, DRUGGABLE GENOME, TRANSCRIPTION FACTOR | antibody | 315661183 | CAROTUXIMAB | |
| 2022 | ENG | CLINICALLY ACTIONABLE, EXTERNAL SIDE OF PLASMA MEMBRANE, CELL SURFACE, DRUGGABLE GENOME, TRANSCRIPTION FACTOR | inhibitor | CHEMBL2109321 | CAROTUXIMAB | |
| 2022 | ENG | CLINICALLY ACTIONABLE, EXTERNAL SIDE OF PLASMA MEMBRANE, CELL SURFACE, DRUGGABLE GENOME, TRANSCRIPTION FACTOR | TRC105 | |||
| 2022 | ENG | CLINICALLY ACTIONABLE, EXTERNAL SIDE OF PLASMA MEMBRANE, CELL SURFACE, DRUGGABLE GENOME, TRANSCRIPTION FACTOR | TRC105 |
| Page: 1 |

Copyright 2023-Present -The University of Texas Health Science Center at Houston |