
|
|||||
|
 | |
| |
| |
| |
| |
| |
|
Gene: ELOVL5 |
Gene summary for ELOVL5 |
| Gene information | Species | Human | Gene symbol | ELOVL5 | Gene ID | 60481 |
| Gene name | ELOVL fatty acid elongase 5 | |
| Gene Alias | HELO1 | |
| Cytomap | 6p12.1 | |
| Gene Type | protein-coding | GO ID | GO:0000038 | UniProtAcc | Q9NYP7 |
Top |
Malignant transformation analysis |
| Identification of the aberrant gene expression in precancerous and cancerous lesions by comparing the gene expression of stem-like cells in diseased tissues with normal stem cells |
| Entrez ID | Symbol | Replicates | Species | Organ | Tissue | Adj P-value | Log2FC | Malignancy |
| 60481 | ELOVL5 | GSM4909282 | Human | Breast | IDC | 1.97e-06 | -2.84e-01 | -0.0288 |
| 60481 | ELOVL5 | GSM4909285 | Human | Breast | IDC | 1.49e-12 | -3.44e-01 | 0.21 |
| 60481 | ELOVL5 | GSM4909286 | Human | Breast | IDC | 9.14e-05 | -2.94e-01 | 0.1081 |
| 60481 | ELOVL5 | GSM4909288 | Human | Breast | IDC | 1.40e-03 | -4.06e-01 | 0.0988 |
| 60481 | ELOVL5 | GSM4909293 | Human | Breast | IDC | 9.06e-17 | 4.30e-01 | 0.1581 |
| 60481 | ELOVL5 | GSM4909297 | Human | Breast | IDC | 4.32e-03 | 5.89e-02 | 0.1517 |
| 60481 | ELOVL5 | GSM4909298 | Human | Breast | IDC | 1.11e-02 | -8.04e-02 | 0.1551 |
| 60481 | ELOVL5 | GSM4909302 | Human | Breast | IDC | 1.31e-18 | 6.16e-01 | 0.1545 |
| 60481 | ELOVL5 | GSM4909303 | Human | Breast | IDC | 1.48e-17 | 8.20e-01 | 0.0438 |
| 60481 | ELOVL5 | GSM4909304 | Human | Breast | IDC | 1.53e-67 | 1.11e+00 | 0.1636 |
| 60481 | ELOVL5 | GSM4909307 | Human | Breast | IDC | 7.78e-04 | 3.70e-01 | 0.1569 |
| 60481 | ELOVL5 | GSM4909308 | Human | Breast | IDC | 5.94e-37 | 7.24e-01 | 0.158 |
| 60481 | ELOVL5 | GSM4909309 | Human | Breast | IDC | 3.50e-03 | -3.03e-01 | 0.0483 |
| 60481 | ELOVL5 | GSM4909311 | Human | Breast | IDC | 5.44e-15 | -2.06e-01 | 0.1534 |
| 60481 | ELOVL5 | GSM4909315 | Human | Breast | IDC | 6.13e-03 | -2.54e-01 | 0.21 |
| 60481 | ELOVL5 | GSM4909319 | Human | Breast | IDC | 2.79e-21 | -6.37e-02 | 0.1563 |
| 60481 | ELOVL5 | GSM4909320 | Human | Breast | IDC | 4.68e-02 | -3.52e-01 | 0.1575 |
| 60481 | ELOVL5 | GSM4909321 | Human | Breast | IDC | 8.14e-09 | -3.18e-01 | 0.1559 |
| 60481 | ELOVL5 | brca1 | Human | Breast | Precancer | 4.73e-03 | -2.12e-01 | -0.0338 |
| 60481 | ELOVL5 | brca2 | Human | Breast | Precancer | 1.66e-02 | -6.47e-03 | -0.024 |
| Page: 1 2 3 4 5 6 7 8 9 10 |
| Tissue | Expression Dynamics | Abbreviation |
| Breast |  | IDC: Invasive ductal carcinoma |
| DCIS: Ductal carcinoma in situ | ||
| Precancer(BRCA1-mut): Precancerous lesion from BRCA1 mutation carriers | ||
| Endometrium | 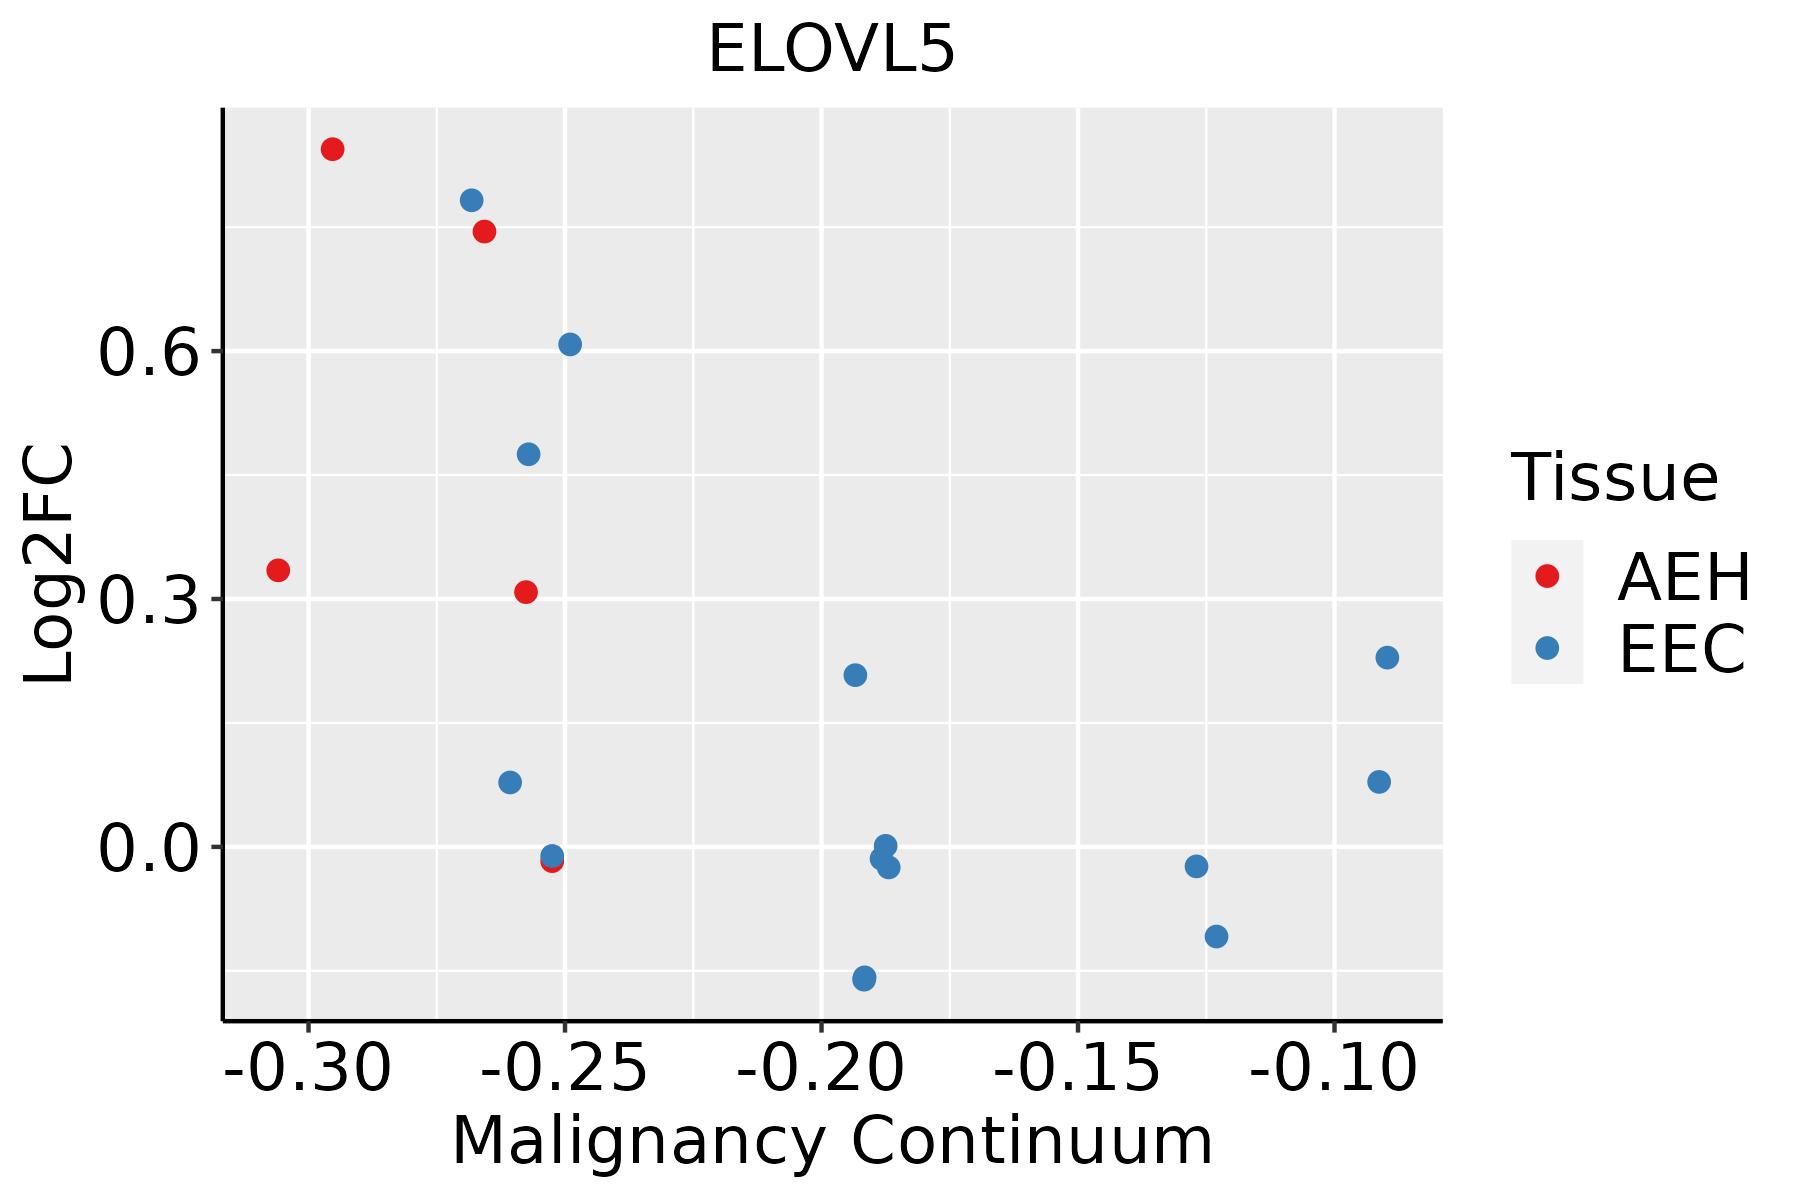 | AEH: Atypical endometrial hyperplasia |
| EEC: Endometrioid Cancer | ||
| Esophagus | 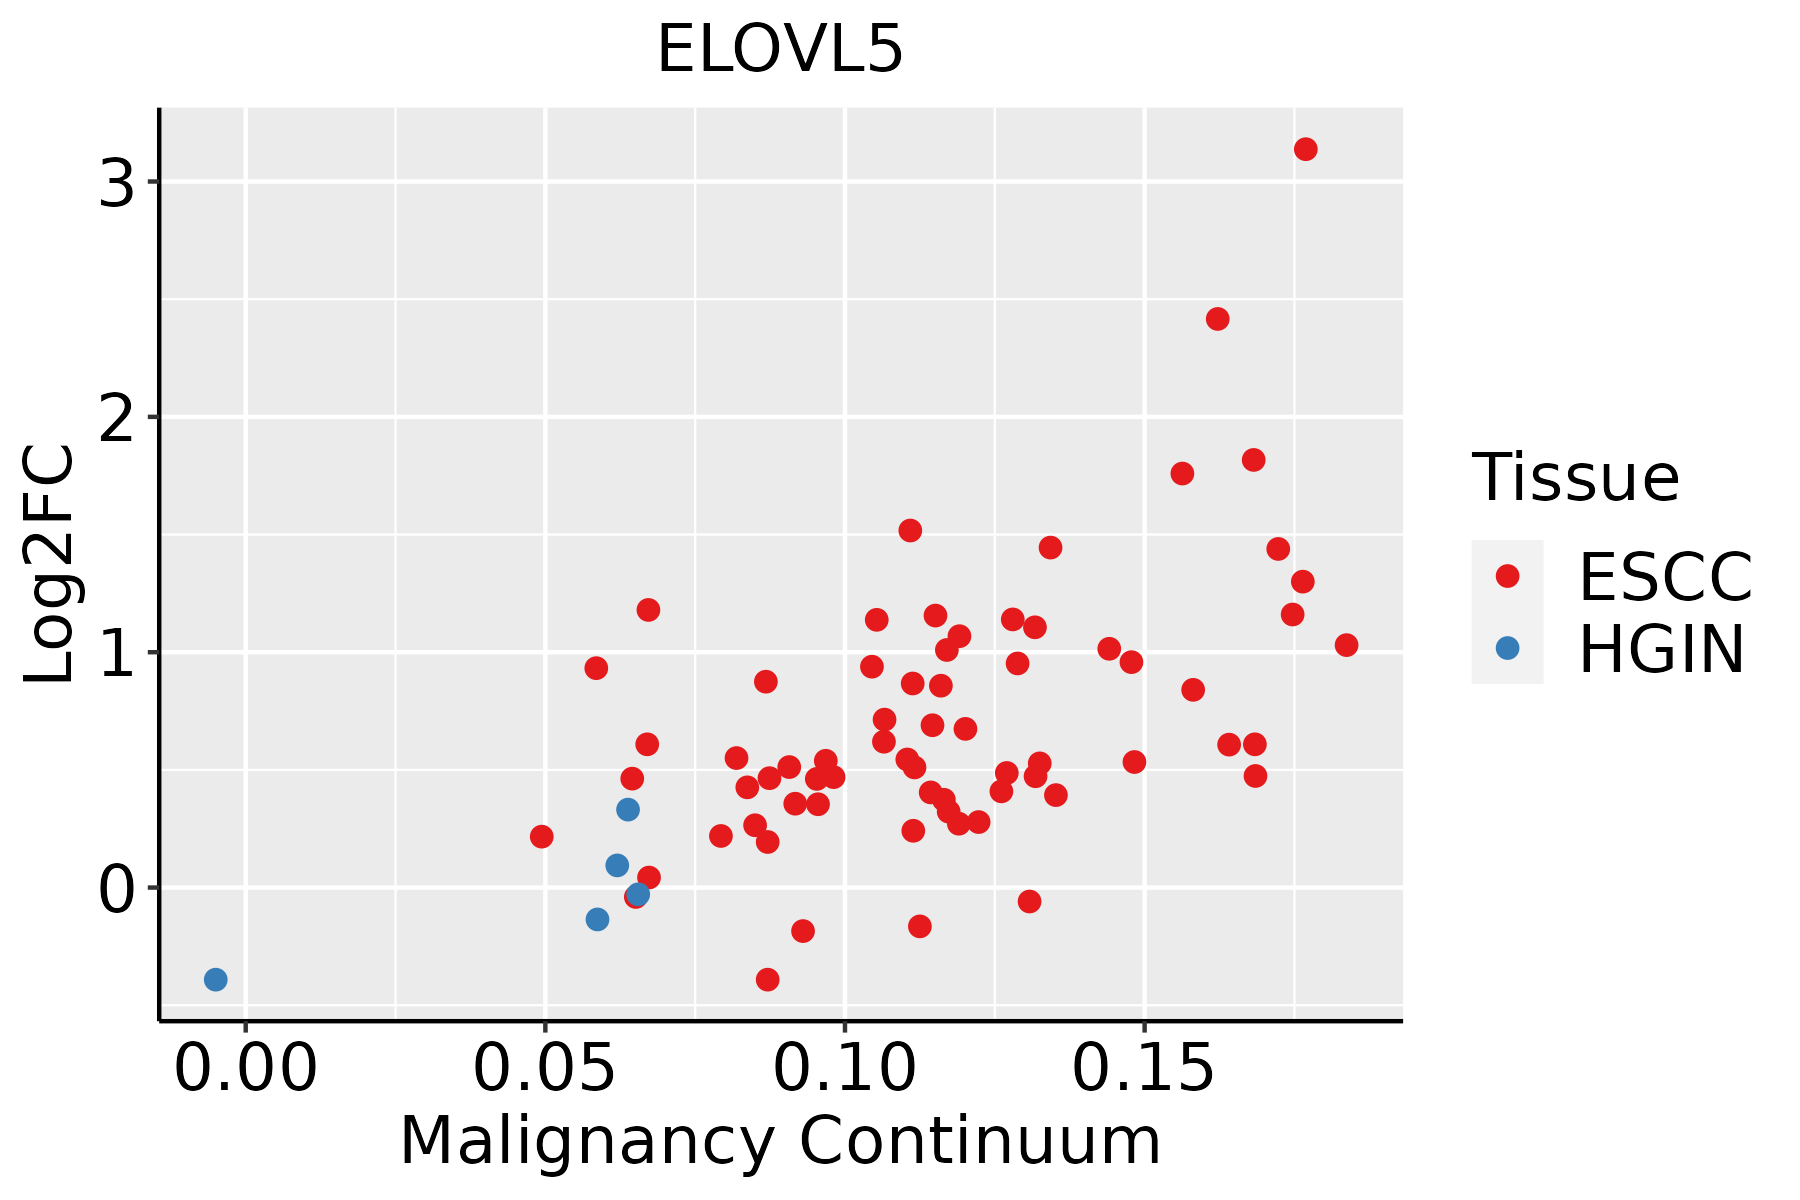 | ESCC: Esophageal squamous cell carcinoma |
| HGIN: High-grade intraepithelial neoplasias | ||
| LGIN: Low-grade intraepithelial neoplasias | ||
| Liver | 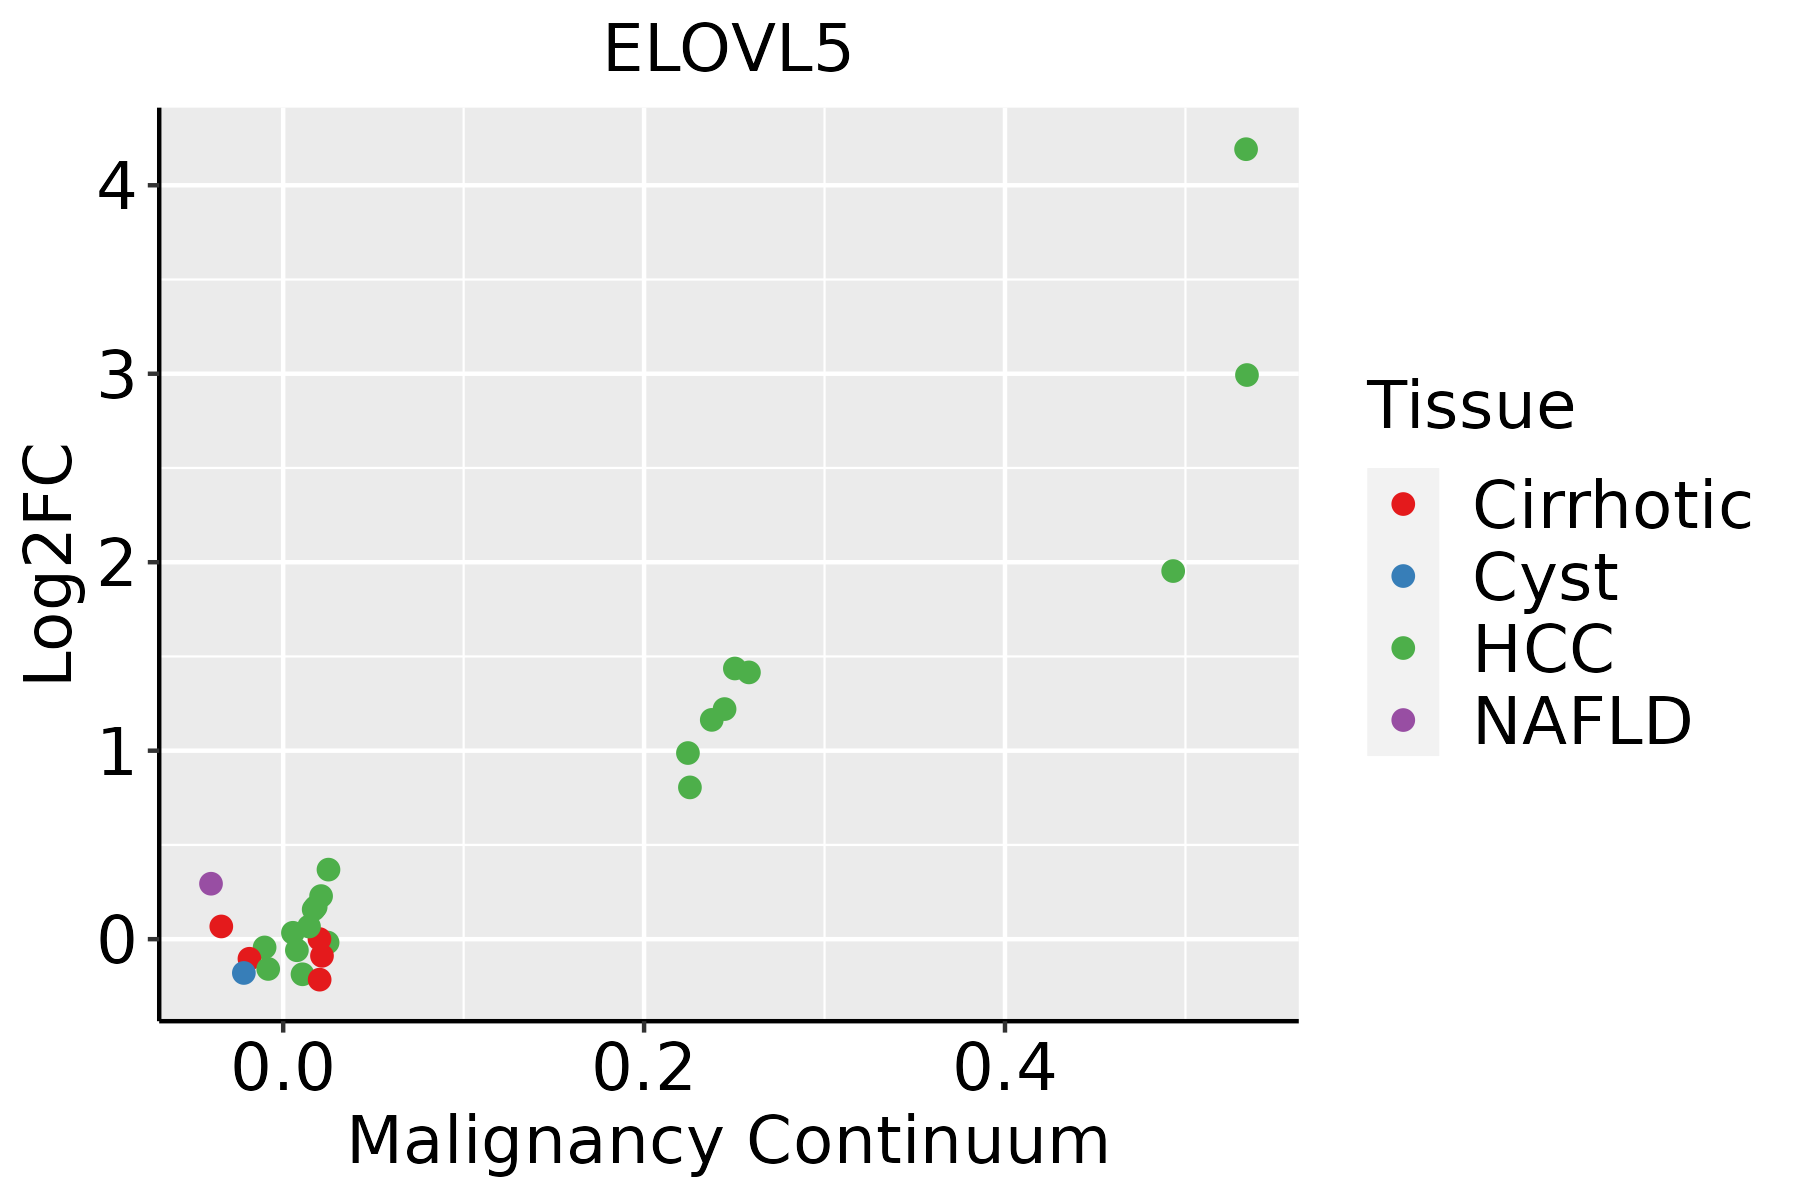 | HCC: Hepatocellular carcinoma |
| NAFLD: Non-alcoholic fatty liver disease | ||
| Lung |  | AAH: Atypical adenomatous hyperplasia |
| AIS: Adenocarcinoma in situ | ||
| IAC: Invasive lung adenocarcinoma | ||
| MIA: Minimally invasive adenocarcinoma | ||
| Oral Cavity | 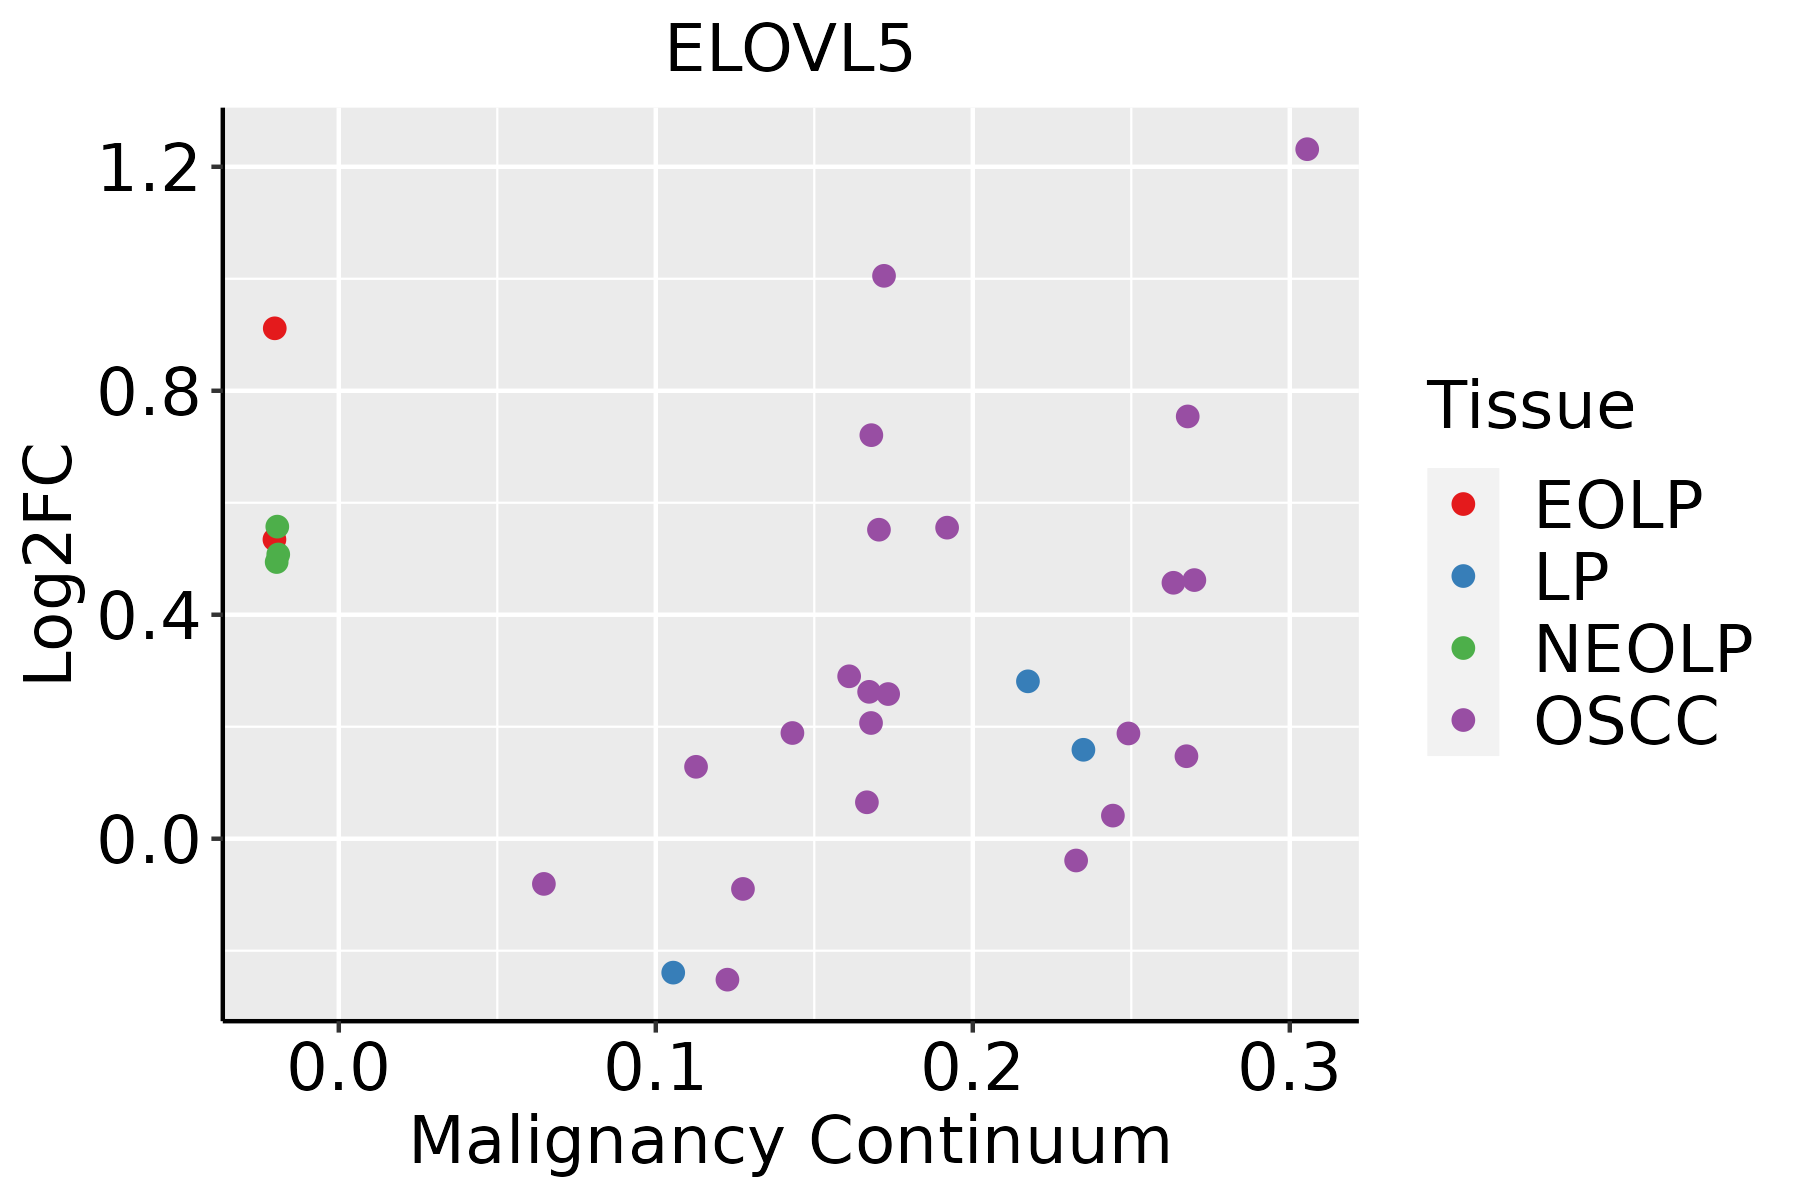 | EOLP: Erosive Oral lichen planus |
| LP: leukoplakia | ||
| NEOLP: Non-erosive oral lichen planus | ||
| OSCC: Oral squamous cell carcinoma | ||
| Prostate | 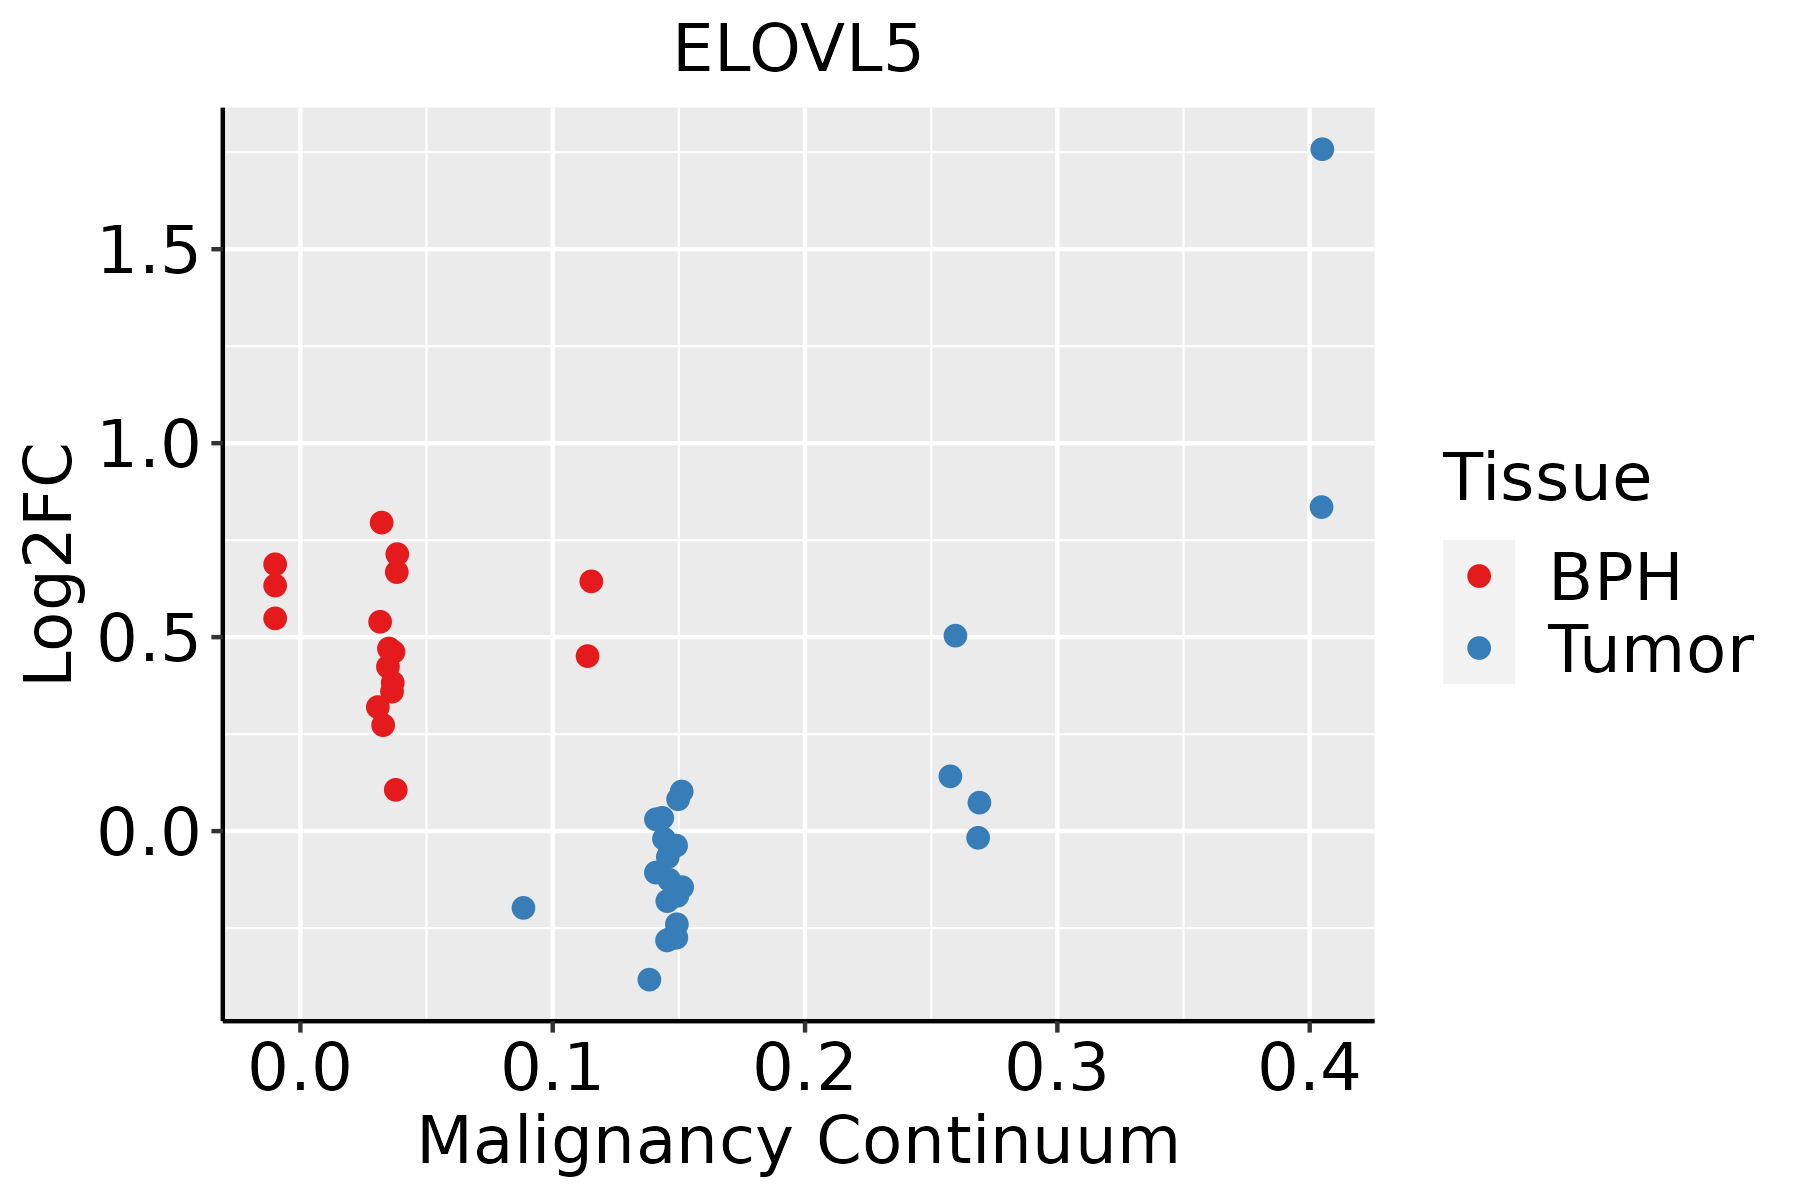 | BPH: Benign Prostatic Hyperplasia |
| Thyroid |  | ATC: Anaplastic thyroid cancer |
| HT: Hashimoto's thyroiditis | ||
| PTC: Papillary thyroid cancer |
| ∗log2FC in expression of this searched gene in stem-like cells from each diseased tissue sample relative to stem-like cells in normal samples in each tissue plotted against the malignancy continuum. Samples are colored based on if they are from different disease stage. |
Top |
Malignant transformation related pathway analysis |
| Find out the enriched GO biological processes and KEGG pathways involved in transition from healthy to precancer to cancer |
| Tissue | Disease Stage | Enriched GO biological Processes |
| Colorectum | AD |  |
| Colorectum | SER |  |
| Colorectum | MSS |  |
| Colorectum | MSI-H |  |
| Colorectum | FAP |  |
| ∗Top 15 enriched GO BP terms are showed in the bar plot of each disease state in each tissue. Each row represents a significant GO biological process which is colored according to the -log10(p.adjust). |
| Page: 1 2 3 4 5 6 7 8 9 |
| GO ID | Tissue | Disease Stage | Description | Gene Ratio | Bg Ratio | pvalue | p.adjust | Count |
| GO:004230421 | Breast | DCIS | regulation of fatty acid biosynthetic process | 10/1390 | 49/18723 | 2.80e-03 | 2.43e-02 | 10 |
| GO:004639422 | Breast | DCIS | carboxylic acid biosynthetic process | 37/1390 | 314/18723 | 3.56e-03 | 2.92e-02 | 37 |
| GO:000663322 | Breast | DCIS | fatty acid biosynthetic process | 22/1390 | 163/18723 | 4.62e-03 | 3.52e-02 | 22 |
| GO:006201213 | Breast | DCIS | regulation of small molecule metabolic process | 38/1390 | 334/18723 | 5.69e-03 | 4.10e-02 | 38 |
| GO:000915016 | Endometrium | AEH | purine ribonucleotide metabolic process | 68/2100 | 368/18723 | 2.26e-05 | 4.35e-04 | 68 |
| GO:000616316 | Endometrium | AEH | purine nucleotide metabolic process | 70/2100 | 396/18723 | 7.46e-05 | 1.13e-03 | 70 |
| GO:000925910 | Endometrium | AEH | ribonucleotide metabolic process | 68/2100 | 385/18723 | 9.63e-05 | 1.39e-03 | 68 |
| GO:001969310 | Endometrium | AEH | ribose phosphate metabolic process | 69/2100 | 396/18723 | 1.31e-04 | 1.79e-03 | 69 |
| GO:007252116 | Endometrium | AEH | purine-containing compound metabolic process | 71/2100 | 416/18723 | 2.01e-04 | 2.54e-03 | 71 |
| GO:000915210 | Endometrium | AEH | purine ribonucleotide biosynthetic process | 35/2100 | 169/18723 | 2.36e-04 | 2.84e-03 | 35 |
| GO:000911715 | Endometrium | AEH | nucleotide metabolic process | 78/2100 | 489/18723 | 8.39e-04 | 7.82e-03 | 78 |
| GO:00092609 | Endometrium | AEH | ribonucleotide biosynthetic process | 35/2100 | 182/18723 | 9.88e-04 | 8.90e-03 | 35 |
| GO:00463909 | Endometrium | AEH | ribose phosphate biosynthetic process | 36/2100 | 190/18723 | 1.11e-03 | 9.74e-03 | 36 |
| GO:000675314 | Endometrium | AEH | nucleoside phosphate metabolic process | 78/2100 | 497/18723 | 1.34e-03 | 1.13e-02 | 78 |
| GO:00061648 | Endometrium | AEH | purine nucleotide biosynthetic process | 35/2100 | 191/18723 | 2.34e-03 | 1.76e-02 | 35 |
| GO:00192165 | Endometrium | AEH | regulation of lipid metabolic process | 53/2100 | 331/18723 | 4.86e-03 | 3.07e-02 | 53 |
| GO:00725228 | Endometrium | AEH | purine-containing compound biosynthetic process | 35/2100 | 200/18723 | 5.05e-03 | 3.16e-02 | 35 |
| GO:000915017 | Endometrium | EEC | purine ribonucleotide metabolic process | 69/2168 | 368/18723 | 3.38e-05 | 5.77e-04 | 69 |
| GO:000616317 | Endometrium | EEC | purine nucleotide metabolic process | 71/2168 | 396/18723 | 1.14e-04 | 1.54e-03 | 71 |
| GO:000925916 | Endometrium | EEC | ribonucleotide metabolic process | 69/2168 | 385/18723 | 1.43e-04 | 1.84e-03 | 69 |
| Page: 1 2 3 4 5 6 7 8 9 10 11 12 13 14 15 16 17 18 |
| Pathway ID | Tissue | Disease Stage | Description | Gene Ratio | Bg Ratio | pvalue | p.adjust | qvalue | Count |
| hsa012129 | Esophagus | ESCC | Fatty acid metabolism | 41/4205 | 57/8465 | 5.13e-04 | 1.75e-03 | 8.98e-04 | 41 |
| hsa0121214 | Esophagus | ESCC | Fatty acid metabolism | 41/4205 | 57/8465 | 5.13e-04 | 1.75e-03 | 8.98e-04 | 41 |
| hsa012122 | Liver | Cirrhotic | Fatty acid metabolism | 32/2530 | 57/8465 | 3.12e-05 | 2.47e-04 | 1.52e-04 | 32 |
| hsa01040 | Liver | Cirrhotic | Biosynthesis of unsaturated fatty acids | 14/2530 | 27/8465 | 1.36e-02 | 4.25e-02 | 2.62e-02 | 14 |
| hsa012123 | Liver | Cirrhotic | Fatty acid metabolism | 32/2530 | 57/8465 | 3.12e-05 | 2.47e-04 | 1.52e-04 | 32 |
| hsa010401 | Liver | Cirrhotic | Biosynthesis of unsaturated fatty acids | 14/2530 | 27/8465 | 1.36e-02 | 4.25e-02 | 2.62e-02 | 14 |
| hsa012124 | Liver | HCC | Fatty acid metabolism | 45/4020 | 57/8465 | 1.05e-06 | 1.10e-05 | 6.09e-06 | 45 |
| hsa000622 | Liver | HCC | Fatty acid elongation | 20/4020 | 27/8465 | 4.58e-03 | 1.36e-02 | 7.55e-03 | 20 |
| hsa010402 | Liver | HCC | Biosynthesis of unsaturated fatty acids | 19/4020 | 27/8465 | 1.37e-02 | 3.33e-02 | 1.85e-02 | 19 |
| hsa012125 | Liver | HCC | Fatty acid metabolism | 45/4020 | 57/8465 | 1.05e-06 | 1.10e-05 | 6.09e-06 | 45 |
| hsa0006211 | Liver | HCC | Fatty acid elongation | 20/4020 | 27/8465 | 4.58e-03 | 1.36e-02 | 7.55e-03 | 20 |
| hsa010403 | Liver | HCC | Biosynthesis of unsaturated fatty acids | 19/4020 | 27/8465 | 1.37e-02 | 3.33e-02 | 1.85e-02 | 19 |
| hsa012128 | Oral cavity | OSCC | Fatty acid metabolism | 35/3704 | 57/8465 | 5.37e-03 | 1.29e-02 | 6.55e-03 | 35 |
| hsa0121213 | Oral cavity | OSCC | Fatty acid metabolism | 35/3704 | 57/8465 | 5.37e-03 | 1.29e-02 | 6.55e-03 | 35 |
| hsa012127 | Prostate | BPH | Fatty acid metabolism | 19/1718 | 57/8465 | 1.44e-02 | 4.17e-02 | 2.58e-02 | 19 |
| hsa0121212 | Prostate | BPH | Fatty acid metabolism | 19/1718 | 57/8465 | 1.44e-02 | 4.17e-02 | 2.58e-02 | 19 |
| hsa0121221 | Prostate | Tumor | Fatty acid metabolism | 23/1791 | 57/8465 | 7.60e-04 | 3.59e-03 | 2.23e-03 | 23 |
| hsa010404 | Prostate | Tumor | Biosynthesis of unsaturated fatty acids | 12/1791 | 27/8465 | 5.53e-03 | 1.93e-02 | 1.19e-02 | 12 |
| hsa0121231 | Prostate | Tumor | Fatty acid metabolism | 23/1791 | 57/8465 | 7.60e-04 | 3.59e-03 | 2.23e-03 | 23 |
| hsa0104011 | Prostate | Tumor | Biosynthesis of unsaturated fatty acids | 12/1791 | 27/8465 | 5.53e-03 | 1.93e-02 | 1.19e-02 | 12 |
| Page: 1 |
Top |
Cell-cell communication analysis |
| Identification of potential cell-cell interactions between two cell types and their ligand-receptor pairs for different disease states |
| Ligand | Receptor | LRpair | Pathway | Tissue | Disease Stage |
| Page: 1 |
Top |
Single-cell gene regulatory network inference analysis |
| Find out the significant the regulons (TFs) and the target genes of each regulon across cell types for different disease states |
| TF | Cell Type | Tissue | Disease Stage | Target Gene | RSS | Regulon Activity |
| ∗The dot plots of a searched regulon are shown for all cell subpopulations in each disease state of each tissue based on the regulon specific score inferred using pySCENIC and by calculating the average expression. |
| Page: 1 |
Top |
Somatic mutation of malignant transformation related genes |
| Annotation of somatic variants for genes involved in malignant transformation |
| Hugo Symbol | Variant Class | Variant Classification | dbSNP RS | HGVSc | HGVSp | HGVSp Short | SWISSPROT | BIOTYPE | SIFT | PolyPhen | Tumor Sample Barcode | Tissue | Histology | Sex | Age | Stage | Therapy Types | Drugs | Outcome |
| ELOVL5 | SNV | Missense_Mutation | c.896N>C | p.Gly299Ala | p.G299A | Q9NYP7 | protein_coding | tolerated(0.08) | possibly_damaging(0.523) | TCGA-A8-A085-01 | Breast | breast invasive carcinoma | Male | <65 | I/II | Hormone Therapy | tamoxiphen | SD | |
| ELOVL5 | SNV | Missense_Mutation | c.208N>T | p.Leu70Phe | p.L70F | Q9NYP7 | protein_coding | tolerated(0.61) | benign(0.053) | TCGA-AR-A1AW-01 | Breast | breast invasive carcinoma | Female | >=65 | I/II | Chemotherapy | docetaxel | SD | |
| ELOVL5 | SNV | Missense_Mutation | c.67N>A | p.Val23Ile | p.V23I | Q9NYP7 | protein_coding | deleterious(0.03) | possibly_damaging(0.794) | TCGA-D8-A1XK-01 | Breast | breast invasive carcinoma | Female | <65 | I/II | Chemotherapy | doxorubicine+cyclophosphamide | SD | |
| ELOVL5 | SNV | Missense_Mutation | novel | c.905N>A | p.Ala302Asp | p.A302D | Q9NYP7 | protein_coding | deleterious(0.02) | benign(0.006) | TCGA-C5-A8YQ-01 | Cervix | cervical & endocervical cancer | Female | >=65 | I/II | Chemotherapy | cisplatin | PD |
| ELOVL5 | SNV | Missense_Mutation | c.826N>G | p.Phe276Val | p.F276V | Q9NYP7 | protein_coding | deleterious(0) | probably_damaging(0.977) | TCGA-AA-3715-01 | Colorectum | colon adenocarcinoma | Male | >=65 | I/II | Unknown | Unknown | PD | |
| ELOVL5 | SNV | Missense_Mutation | rs766390073 | c.380N>A | p.Arg127His | p.R127H | Q9NYP7 | protein_coding | tolerated(1) | benign(0.001) | TCGA-AA-A022-01 | Colorectum | colon adenocarcinoma | Female | >=65 | I/II | Unknown | Unknown | SD |
| ELOVL5 | SNV | Missense_Mutation | novel | c.482N>C | p.Lys161Thr | p.K161T | Q9NYP7 | protein_coding | deleterious(0) | probably_damaging(0.998) | TCGA-AZ-4315-01 | Colorectum | colon adenocarcinoma | Male | <65 | I/II | Unknown | Unknown | SD |
| ELOVL5 | SNV | Missense_Mutation | c.356N>G | p.Tyr119Cys | p.Y119C | Q9NYP7 | protein_coding | deleterious(0) | probably_damaging(0.993) | TCGA-CM-5861-01 | Colorectum | colon adenocarcinoma | Female | <65 | I/II | Unknown | Unknown | PD | |
| ELOVL5 | SNV | Missense_Mutation | rs780696778 | c.947A>G | p.Asn316Ser | p.N316S | Q9NYP7 | protein_coding | tolerated(0.07) | benign(0.006) | TCGA-F5-6814-01 | Colorectum | rectum adenocarcinoma | Male | <65 | I/II | Unknown | Unknown | SD |
| ELOVL5 | insertion | Frame_Shift_Ins | novel | c.59_60insACATA | p.Asp20GlufsTer6 | p.D20Efs*6 | Q9NYP7 | protein_coding | TCGA-AM-5820-01 | Colorectum | colon adenocarcinoma | Female | <65 | I/II | Unknown | Unknown | SD |
| Page: 1 2 3 |
Top |
Related drugs of malignant transformation related genes |
| Identification of chemicals and drugs interact with genes involved in malignant transfromation |
| (DGIdb 4.0) |
| Entrez ID | Symbol | Category | Interaction Types | Drug Claim Name | Drug Name | PMIDs |
| Page: 1 |

Copyright 2023-Present -The University of Texas Health Science Center at Houston |