Schematic overview of the cellular and molecular mechanisms involved in the cancer progression, including the proposed cellular and molecular mechanisms in cancer cells trajectory. AT1: alveolar type 1 cells; AT2: alveolar type 2 cells; AAH: atypical adenomatous hyperplasia; AIS: adenocarcinoma in situ; MIA: minimally invasive adenocarcinoma; IA: invasive adenocarcinoma; EMT: epithelial-mesenchymal transition

Home

Download

Statistics

Help

Contact

Center for Computational Systems Medicine
leaf

Gene summary

leaf

Malignant transformation analysis

leaf

Malignant transformation related pathway analysis

leaf

Cell-cell communication analysis

leaf

Single-cell gene regulatory network inference analysis

leaf

Somatic mutation of malignant transformation related genes

leaf

Related drugs of malignant transformation related genes

Gene: EIF3B

Gene summary for EIF3B

check button Gene summary.

Gene informationSpeciesHuman
Gene symbol

EIF3B

Gene ID

8662

Gene nameeukaryotic translation initiation factor 3 subunit B
Gene AliasEIF3-ETA
Cytomap7p22.3
Gene Typeprotein-coding
GO ID

GO:0001732

UniProtAcc

A0A024R821


Top

Malignant transformation analysis

check button Identification of the aberrant gene expression in precancerous and cancerous lesions by comparing the gene expression of stem-like cells in diseased tissues with normal stem cells
check button Malignant transformation involving gene list.
Entrez IDSymbolReplicatesSpeciesOrganTissueAdj P-valueLog2FCMalignancy
8662EIF3BHTA11_1938_2000001011HumanColorectumAD1.10e-045.49e-01-0.0811
8662EIF3BHTA11_78_2000001011HumanColorectumAD5.91e-075.41e-01-0.1088
8662EIF3BHTA11_347_2000001011HumanColorectumAD5.60e-094.74e-01-0.1954
8662EIF3BHTA11_83_2000001011HumanColorectumSER1.31e-035.16e-01-0.1526
8662EIF3BHTA11_696_2000001011HumanColorectumAD1.79e-064.67e-01-0.1464
8662EIF3BHTA11_866_2000001011HumanColorectumAD1.58e-022.75e-01-0.1001
8662EIF3BHTA11_1391_2000001011HumanColorectumAD2.66e-128.17e-01-0.059
8662EIF3BHTA11_866_3004761011HumanColorectumAD5.12e-187.51e-010.096
8662EIF3BHTA11_8622_2000001021HumanColorectumSER9.59e-045.76e-010.0528
8662EIF3BHTA11_10623_2000001011HumanColorectumAD3.92e-057.16e-01-0.0177
8662EIF3BHTA11_7696_3000711011HumanColorectumAD6.01e-177.09e-010.0674
8662EIF3BHTA11_6818_2000001021HumanColorectumAD4.62e-085.61e-010.0588
8662EIF3BHTA11_99999970781_79442HumanColorectumMSS2.66e-268.44e-010.294
8662EIF3BHTA11_99999965104_69814HumanColorectumMSS2.11e-271.24e+000.281
8662EIF3BHTA11_99999971662_82457HumanColorectumMSS2.14e-321.28e+000.3859
8662EIF3BHTA11_99999973899_84307HumanColorectumMSS1.35e-098.98e-010.2585
8662EIF3BHTA11_99999974143_84620HumanColorectumMSS2.93e-208.35e-010.3005
8662EIF3BA015-C-203HumanColorectumFAP3.24e-08-5.01e-02-0.1294
8662EIF3BA002-C-201HumanColorectumFAP2.29e-05-5.78e-020.0324
8662EIF3BA001-C-119HumanColorectumFAP8.27e-04-2.43e-01-0.1557
Page: 1 2 3 4 5 6 7 8 9 

check button Transcriptomic changes along malignancy continuum.
TissueExpression DynamicsAbbreviation
Colorectum (GSE201348)The image shows the transcriptomic changes along malignancy continuum.log2FC in expression of this searched gene in stem-like cells from each diseased tissue sample relative to stem-like cells in normal samples in each tissue plotted against the malignancy continuum. Samples are colored based on if they are from different disease stage.FAP: Familial adenomatous polyposis
CRC: Colorectal cancer
Colorectum (HTA11)The image shows the transcriptomic changes along malignancy continuum.log2FC in expression of this searched gene in stem-like cells from each diseased tissue sample relative to stem-like cells in normal samples in each tissue plotted against the malignancy continuum. Samples are colored based on if they are from different disease stage.AD: Adenomas
SER: Sessile serrated lesions
MSI-H: Microsatellite-high colorectal cancer
MSS: Microsatellite stable colorectal cancer
EsophagusThe image shows the transcriptomic changes along malignancy continuum.log2FC in expression of this searched gene in stem-like cells from each diseased tissue sample relative to stem-like cells in normal samples in each tissue plotted against the malignancy continuum. Samples are colored based on if they are from different disease stage.
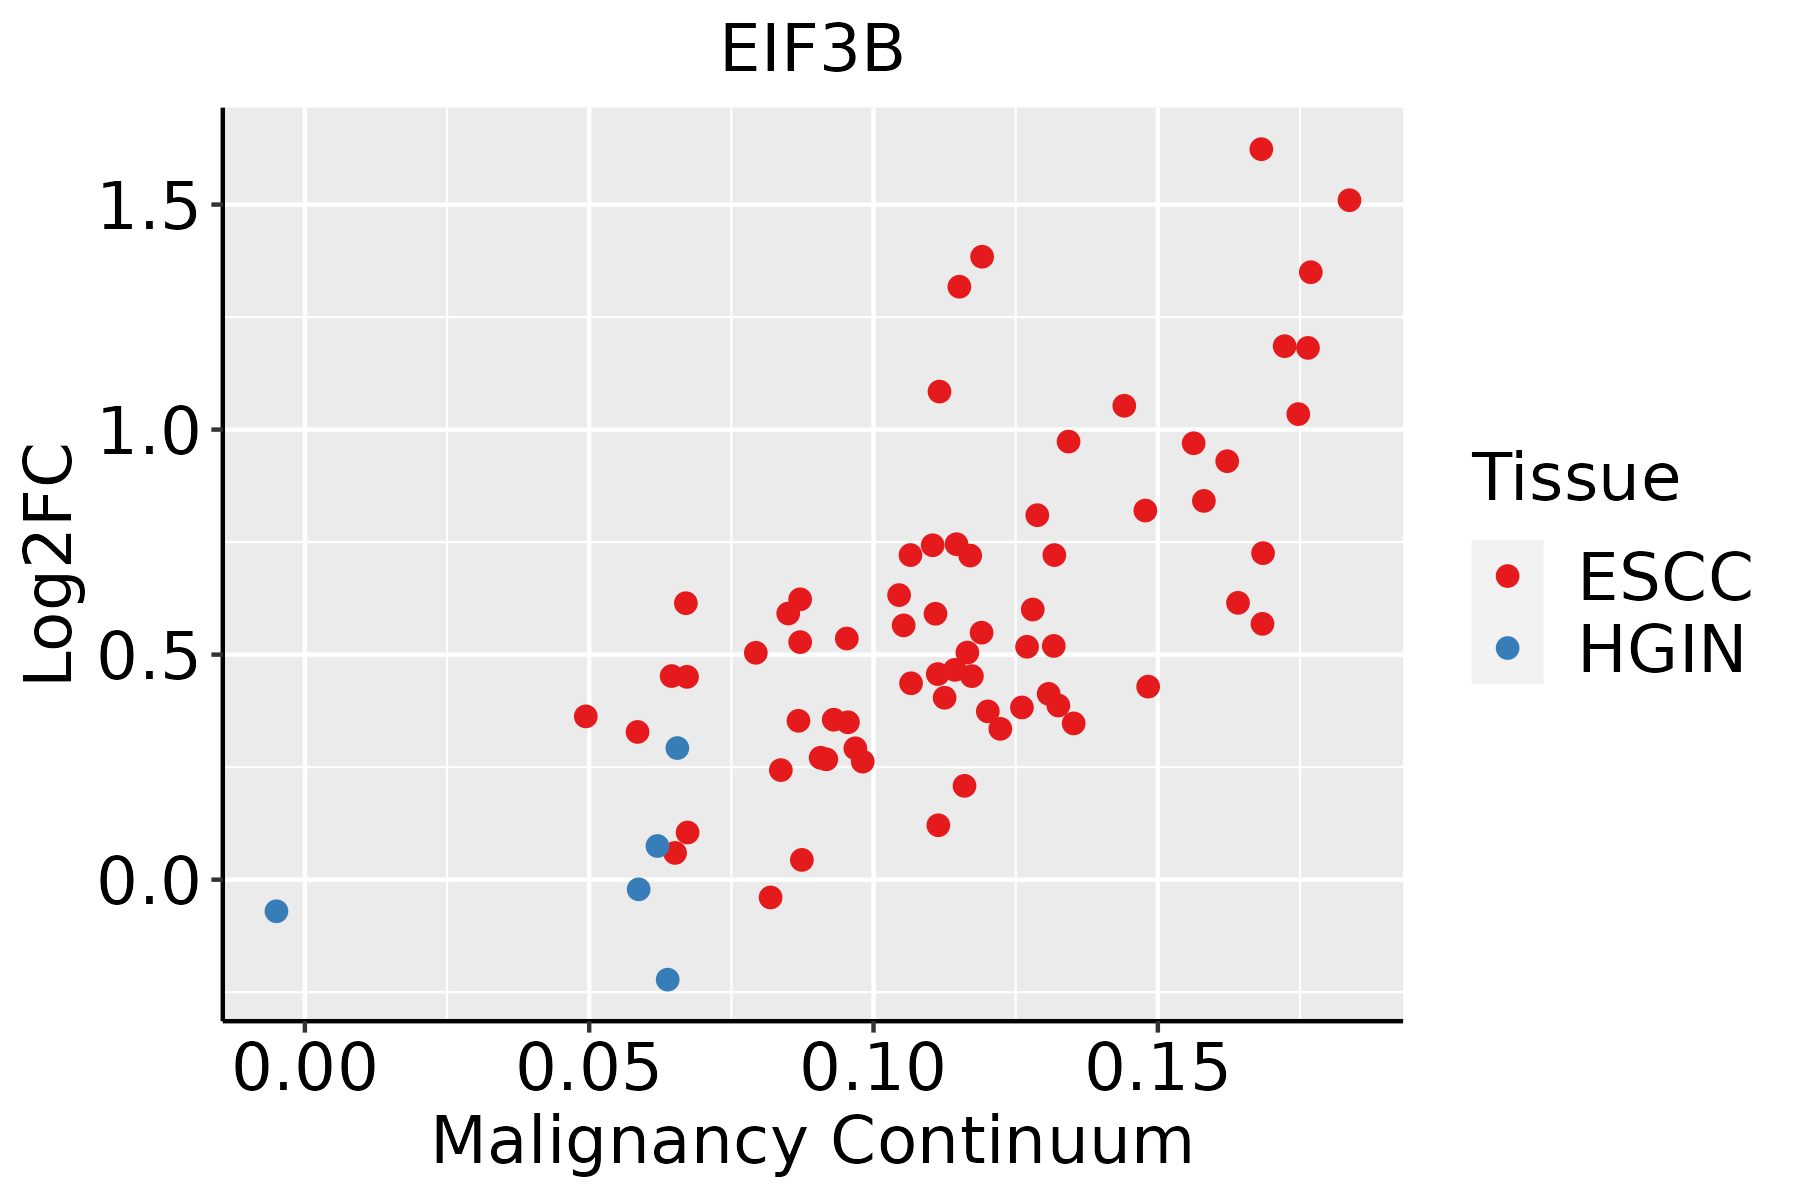
ESCC: Esophageal squamous cell carcinoma
HGIN: High-grade intraepithelial neoplasias
LGIN: Low-grade intraepithelial neoplasias
LiverThe image shows the transcriptomic changes along malignancy continuum.log2FC in expression of this searched gene in stem-like cells from each diseased tissue sample relative to stem-like cells in normal samples in each tissue plotted against the malignancy continuum. Samples are colored based on if they are from different disease stage.HCC: Hepatocellular carcinoma
NAFLD: Non-alcoholic fatty liver disease
Oral CavityThe image shows the transcriptomic changes along malignancy continuum.log2FC in expression of this searched gene in stem-like cells from each diseased tissue sample relative to stem-like cells in normal samples in each tissue plotted against the malignancy continuum. Samples are colored based on if they are from different disease stage.
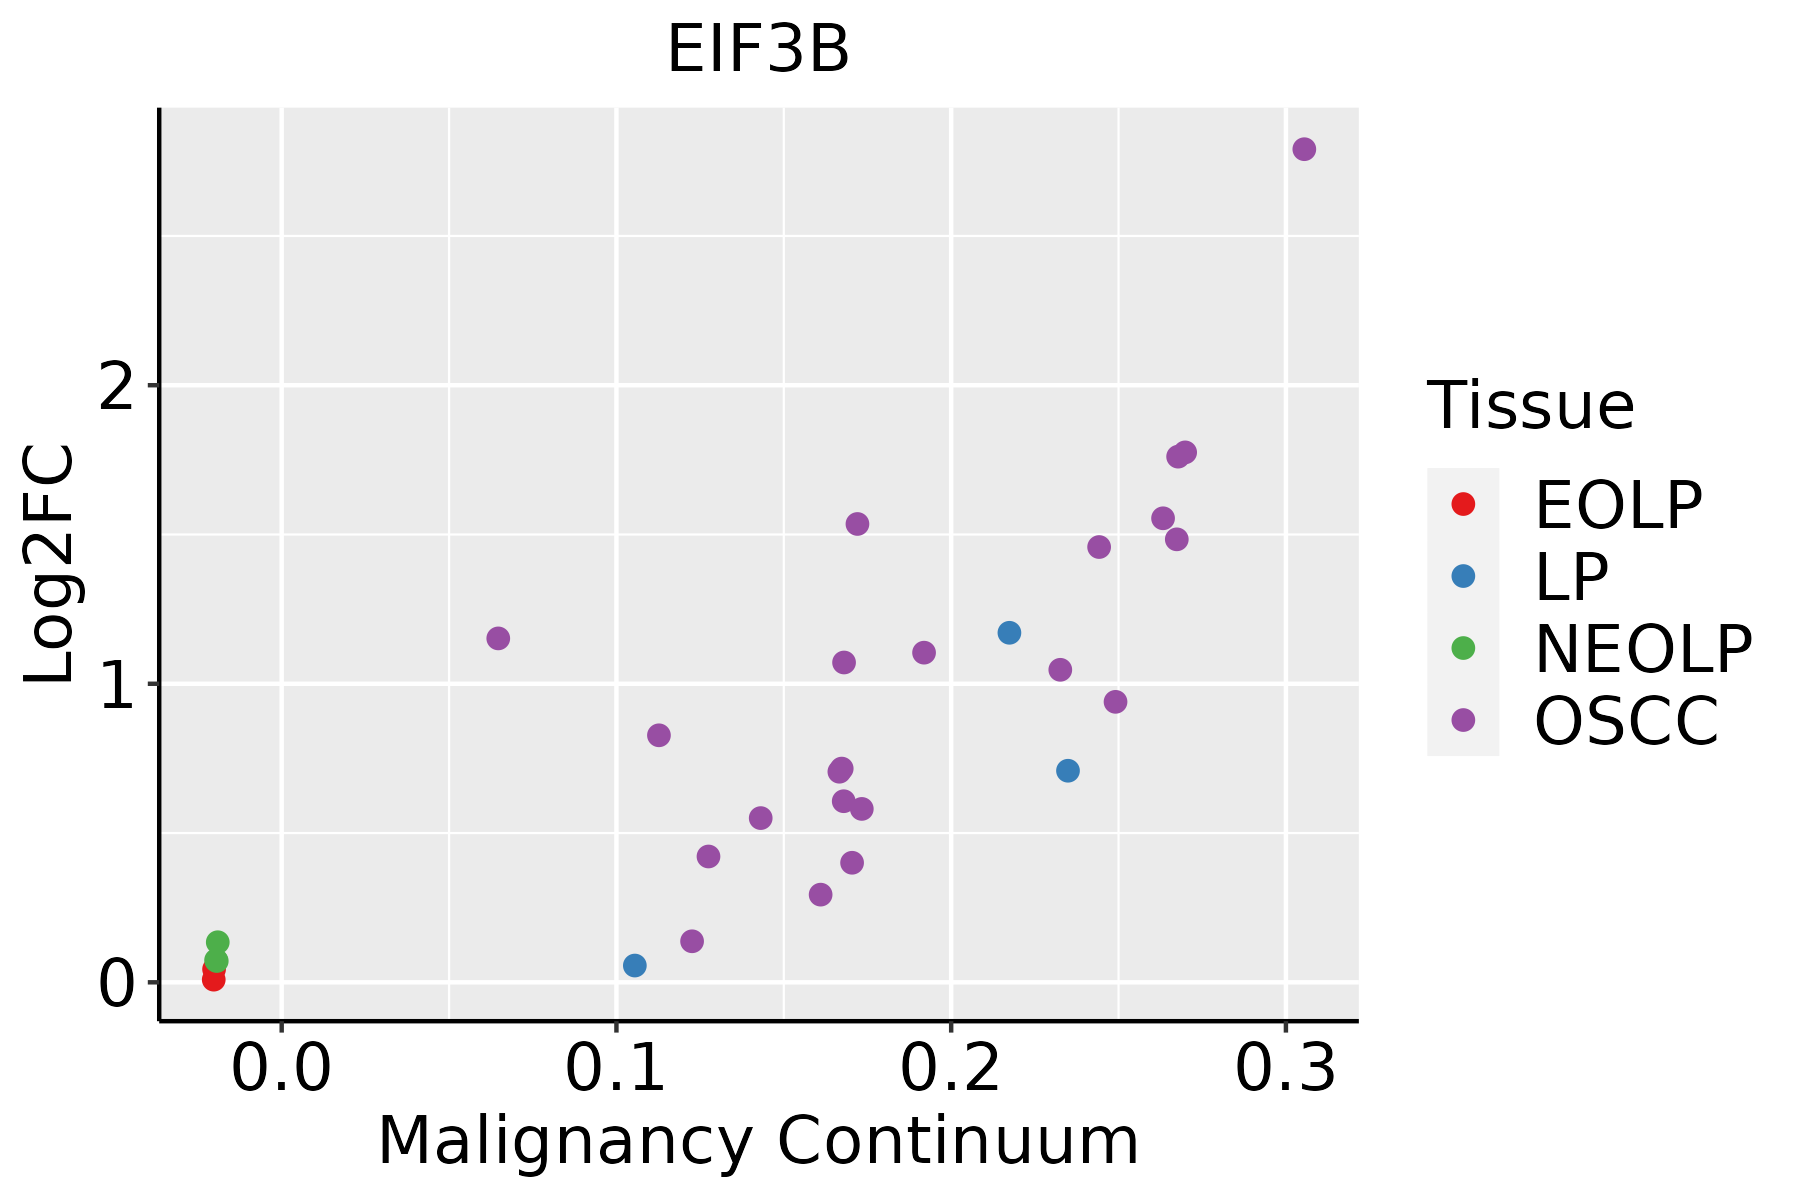
EOLP: Erosive Oral lichen planus
LP: leukoplakia
NEOLP: Non-erosive oral lichen planus
OSCC: Oral squamous cell carcinoma
ProstateThe image shows the transcriptomic changes along malignancy continuum.log2FC in expression of this searched gene in stem-like cells from each diseased tissue sample relative to stem-like cells in normal samples in each tissue plotted against the malignancy continuum. Samples are colored based on if they are from different disease stage.
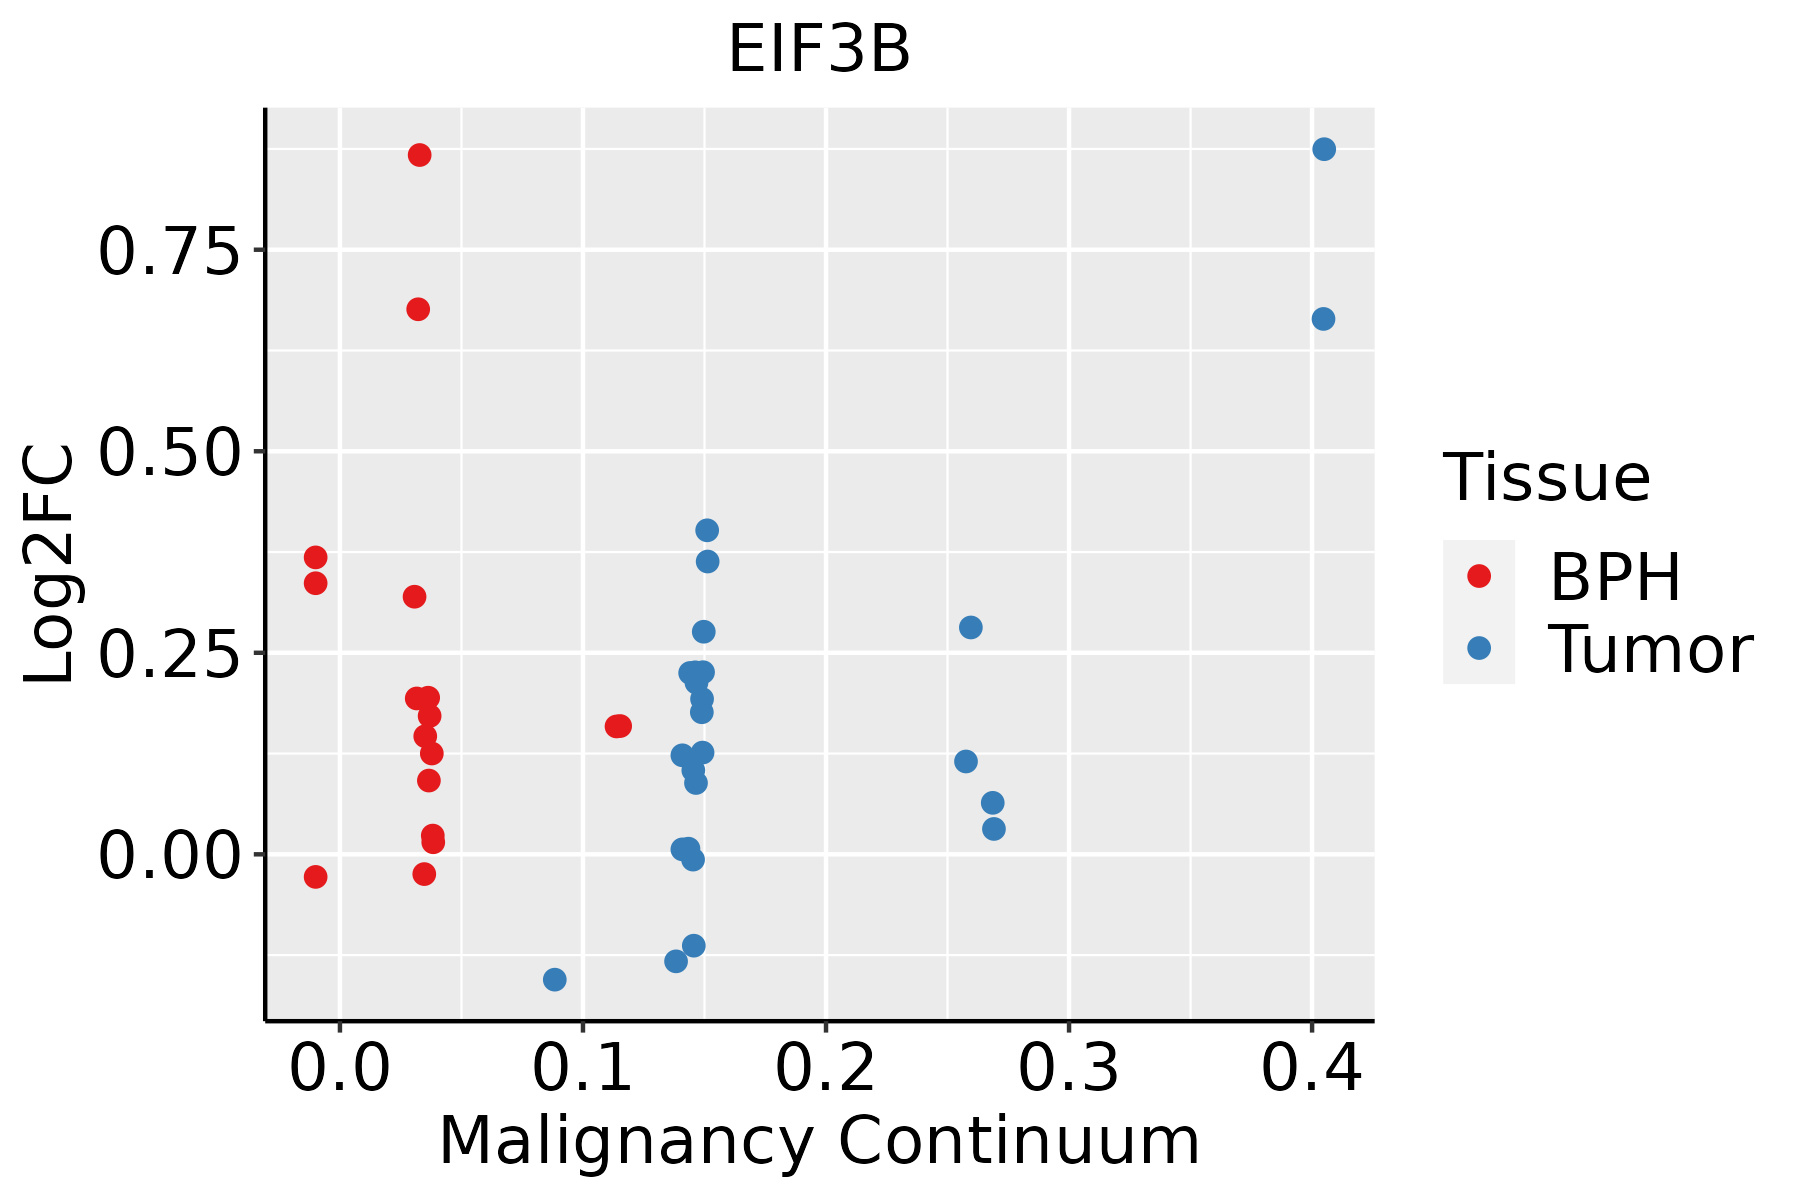
BPH: Benign Prostatic Hyperplasia
SkinThe image shows the transcriptomic changes along malignancy continuum.log2FC in expression of this searched gene in stem-like cells from each diseased tissue sample relative to stem-like cells in normal samples in each tissue plotted against the malignancy continuum. Samples are colored based on if they are from different disease stage.AK: Actinic keratosis
cSCC: Cutaneous squamous cell carcinoma
SCCIS:squamous cell carcinoma in situ
ThyroidThe image shows the transcriptomic changes along malignancy continuum.log2FC in expression of this searched gene in stem-like cells from each diseased tissue sample relative to stem-like cells in normal samples in each tissue plotted against the malignancy continuum. Samples are colored based on if they are from different disease stage.
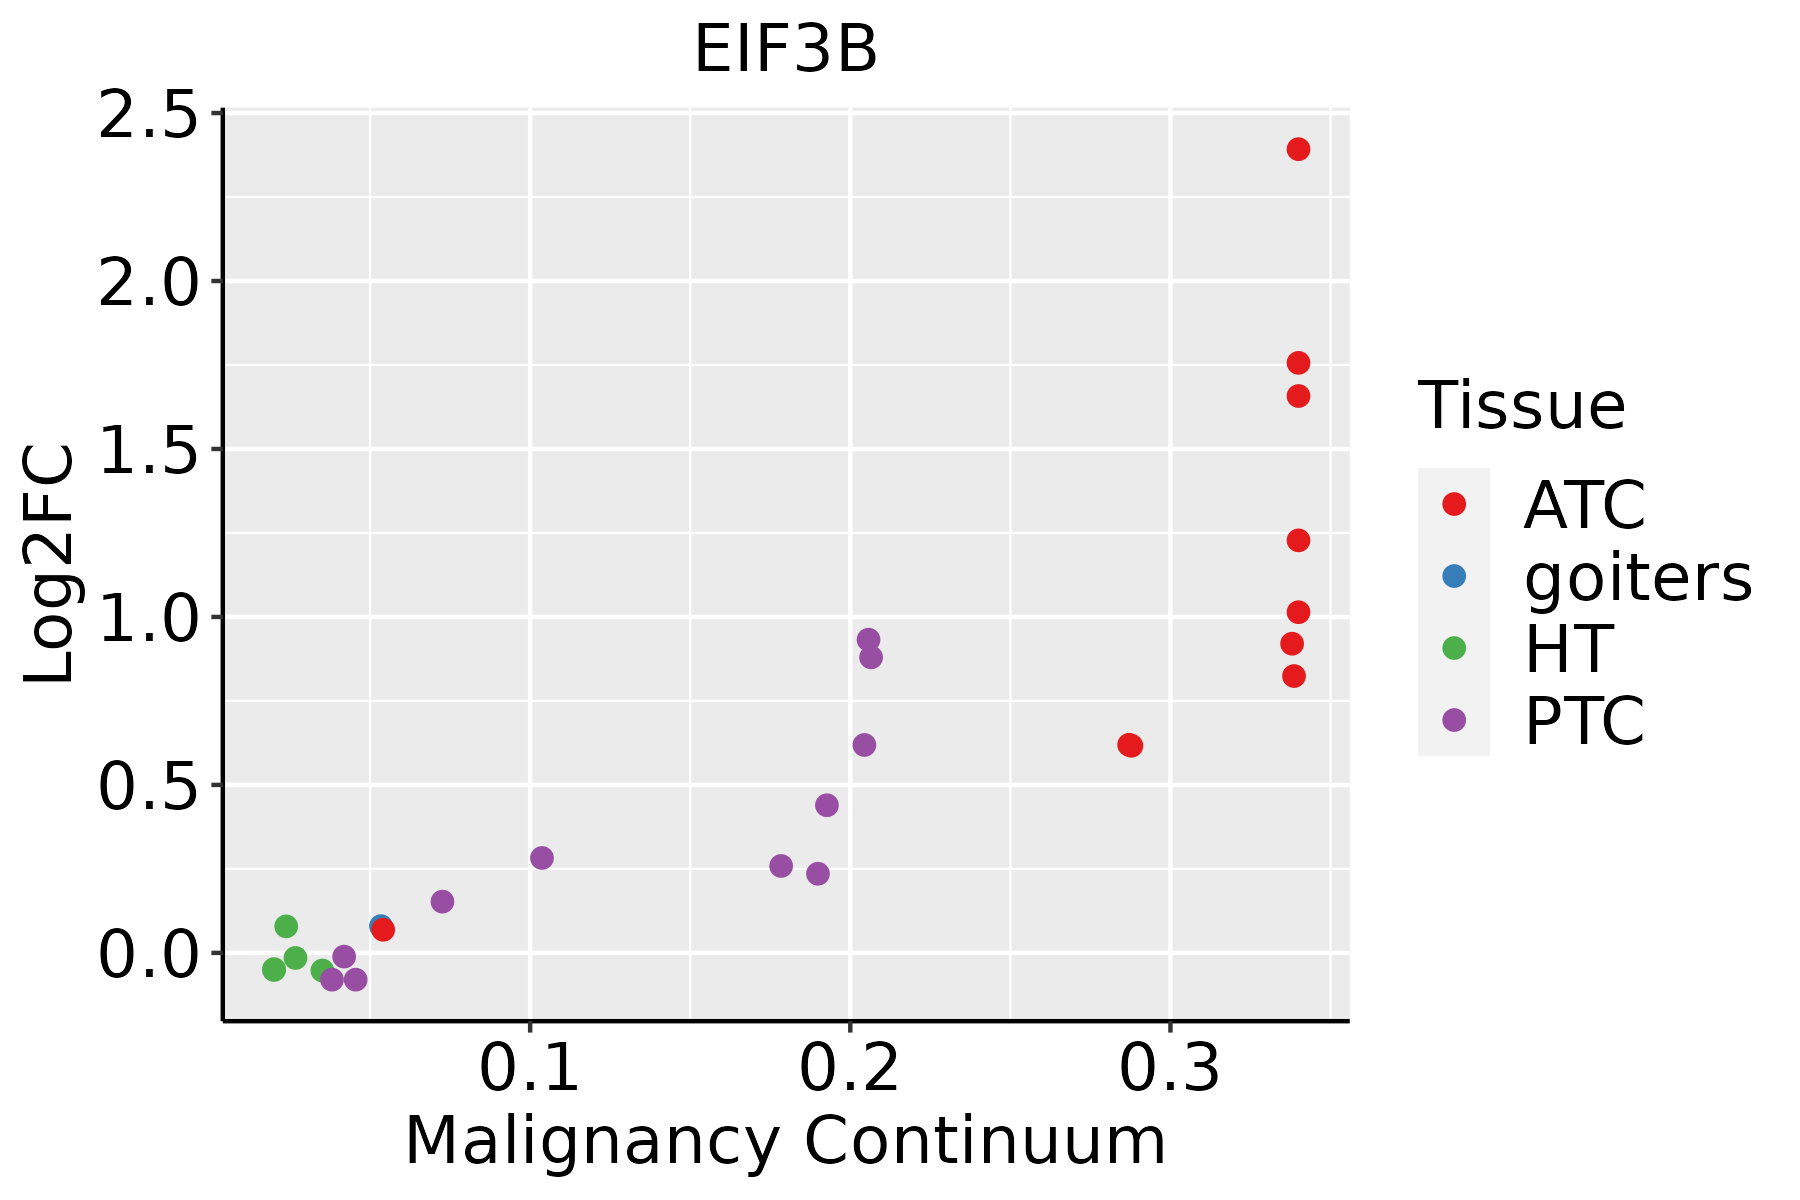
ATC: Anaplastic thyroid cancer
HT: Hashimoto's thyroiditis
PTC: Papillary thyroid cancer
∗log2FC in expression of this searched gene in stem-like cells from each diseased tissue sample relative to stem-like cells in normal samples in each tissue plotted against the malignancy continuum. Samples are colored based on if they are from different disease stage.

Top

Malignant transformation related pathway analysis

check buttonFind out the enriched GO biological processes and KEGG pathways involved in transition from healthy to precancer to cancer
check button Figure of enriched GO biological processes.
TissueDisease StageEnriched GO biological Processes
ColorectumADGO analysis - Figure of enriched GO biological processes: Top 15 enriched GO BP terms are showed in the bar plot of each disease state in each tissue. Each row represents a significant GO biological process which is colored according to the -log10(p.adjust).
ColorectumSERGO analysis - Figure of enriched GO biological processes: Top 15 enriched GO BP terms are showed in the bar plot of each disease state in each tissue. Each row represents a significant GO biological process which is colored according to the -log10(p.adjust).
ColorectumMSSGO analysis - Figure of enriched GO biological processes: Top 15 enriched GO BP terms are showed in the bar plot of each disease state in each tissue. Each row represents a significant GO biological process which is colored according to the -log10(p.adjust).
ColorectumMSI-HGO analysis - Figure of enriched GO biological processes: Top 15 enriched GO BP terms are showed in the bar plot of each disease state in each tissue. Each row represents a significant GO biological process which is colored according to the -log10(p.adjust).
ColorectumFAPGO analysis - Figure of enriched GO biological processes: Top 15 enriched GO BP terms are showed in the bar plot of each disease state in each tissue. Each row represents a significant GO biological process which is colored according to the -log10(p.adjust).
∗Top 15 enriched GO BP terms are showed in the bar plot of each disease state in each tissue. Each row represents a significant GO biological process which is colored according to the -log10(p.adjust).
Page: 1 2 3 4 5 6 7 8 9 

check button Enriched GO biological processes.
GO IDTissueDisease StageDescriptionGene RatioBg Ratiopvaluep.adjustCount
GO:0022613111EsophagusESCCribonucleoprotein complex biogenesis365/8552463/187231.74e-491.11e-45365
GO:0002181111EsophagusESCCcytoplasmic translation135/8552148/187234.17e-322.65e-29135
GO:0016032111EsophagusESCCviral process301/8552415/187233.34e-291.32e-26301
GO:0006413110EsophagusESCCtranslational initiation100/8552118/187231.16e-181.25e-16100
GO:0006417111EsophagusESCCregulation of translation304/8552468/187231.53e-171.33e-15304
GO:0071826111EsophagusESCCribonucleoprotein complex subunit organization166/8552227/187232.94e-172.42e-15166
GO:0022618111EsophagusESCCribonucleoprotein complex assembly159/8552220/187238.19e-165.71e-14159
GO:001908017EsophagusESCCviral gene expression80/855294/187232.04e-151.28e-1380
GO:000644617EsophagusESCCregulation of translational initiation65/855279/187232.04e-117.07e-1065
GO:0002183110EsophagusESCCcytoplasmic translational initiation32/855234/187232.18e-094.94e-0832
GO:001908116EsophagusESCCviral translation16/855216/187233.56e-063.92e-0516
GO:0001732110EsophagusESCCformation of cytoplasmic translation initiation complex15/855216/187237.15e-055.38e-0415
GO:007552210EsophagusESCCIRES-dependent viral translational initiation11/855211/187231.80e-041.16e-0311
GO:002261322LiverHCCribonucleoprotein complex biogenesis355/7958463/187237.76e-524.92e-48355
GO:000218122LiverHCCcytoplasmic translation132/7958148/187239.09e-335.76e-30132
GO:001603222LiverHCCviral process286/7958415/187234.41e-281.86e-25286
GO:007182622LiverHCCribonucleoprotein complex subunit organization159/7958227/187233.14e-173.06e-15159
GO:000641722LiverHCCregulation of translation287/7958468/187238.79e-178.08e-15287
GO:000641322LiverHCCtranslational initiation94/7958118/187231.39e-161.24e-1494
GO:002261822LiverHCCribonucleoprotein complex assembly153/7958220/187233.44e-162.91e-14153
Page: 1 2 3 4 5 6 7 8 9 10 

check button Enriched KEGG pathways.
Pathway IDTissueDisease StageDescriptionGene RatioBg Ratiopvaluep.adjustqvalueCount
Page: 1 

Top

Cell-cell communication analysis

check buttonIdentification of potential cell-cell interactions between two cell types and their ligand-receptor pairs for different disease states
LigandReceptorLRpairPathwayTissueDisease Stage
Page: 1 

Top

Single-cell gene regulatory network inference analysis

check buttonFind out the significant the regulons (TFs) and the target genes of each regulon across cell types for different disease states
TFCell TypeTissueDisease StageTarget GeneRSSRegulon Activity
∗The dot plots of a searched regulon are shown for all cell subpopulations in each disease state of each tissue based on the regulon specific score inferred using pySCENIC and by calculating the average expression.
Page: 1 

Top

Somatic mutation of malignant transformation related genes

check buttonAnnotation of somatic variants for genes involved in malignant transformation
Hugo SymbolVariant ClassVariant ClassificationdbSNP RSHGVScHGVSpHGVSp ShortSWISSPROTBIOTYPESIFTPolyPhenTumor Sample BarcodeTissueHistologySexAgeStageTherapy TypesDrugsOutcome
EIF3BSNVMissense_Mutationc.1311C>Ap.Phe437Leup.F437LP55884protein_codingtolerated(0.06)benign(0.184)TCGA-AN-A046-01Breastbreast invasive carcinomaFemale>=65I/IIUnknownUnknownSD
EIF3BSNVMissense_Mutationnovelc.2194N>Cp.Glu732Glnp.E732QP55884protein_codingdeleterious(0)probably_damaging(0.983)TCGA-D8-A27V-01Breastbreast invasive carcinomaFemale<65I/IIHormone TherapytamoxiphenSD
EIF3BSNVMissense_Mutationc.2264A>Gp.Glu755Glyp.E755GP55884protein_codingdeleterious(0)benign(0.218)TCGA-E2-A15D-01Breastbreast invasive carcinomaFemale<65I/IIHormone TherapytamoxiphenSD
EIF3BinsertionNonsense_Mutationnovelc.781_782insCTAGAATTATCAAATACAGGTAATGCTGCp.Phe261SerfsTer8p.F261Sfs*8P55884protein_codingTCGA-A2-A04V-01Breastbreast invasive carcinomaFemale<65I/IIChemotherapycytoxanPD
EIF3BinsertionFrame_Shift_Insnovelc.1598_1599insGCTAATAAGCTTTTTACTGAGAp.Pro534LeufsTer19p.P534Lfs*19P55884protein_codingTCGA-A2-A04V-01Breastbreast invasive carcinomaFemale<65I/IIChemotherapycytoxanPD
EIF3BinsertionFrame_Shift_Insnovelc.1995_1996insTCCAGGACTCAGGCCAAGCCCGCACAGAp.Val666SerfsTer20p.V666Sfs*20P55884protein_codingTCGA-A8-A093-01Breastbreast invasive carcinomaFemale<65I/IIHormone TherapytamoxiphenSD
EIF3BinsertionFrame_Shift_Insnovelc.1802_1803insCCGCCCTTCCAGGCAGGGAGp.Glu601AspfsTer35p.E601Dfs*35P55884protein_codingTCGA-BH-A0AY-01Breastbreast invasive carcinomaFemale<65I/IIChemotherapySD
EIF3BSNVMissense_Mutationrs759606657c.1907C>Tp.Ala636Valp.A636VP55884protein_codingtolerated(0.4)benign(0.014)TCGA-2W-A8YY-01Cervixcervical & endocervical cancerFemale<65I/IIChemotherapycisplatinCR
EIF3BSNVMissense_Mutationrs370274071c.1996G>Ap.Val666Ilep.V666IP55884protein_codingtolerated(0.07)benign(0.342)TCGA-2W-A8YY-01Cervixcervical & endocervical cancerFemale<65I/IIChemotherapycisplatinCR
EIF3BSNVMissense_Mutationc.1311C>Gp.Phe437Leup.F437LP55884protein_codingtolerated(0.06)benign(0.184)TCGA-HM-A4S6-01Cervixcervical & endocervical cancerFemale<65III/IVChemotherapycisplatinCR
Page: 1 2 3 4 5 6 7 8 

Top

Related drugs of malignant transformation related genes

check buttonIdentification of chemicals and drugs interact with genes involved in malignant transfromation
(DGIdb 4.0)
Entrez IDSymbolCategoryInteraction TypesDrug Claim NameDrug NamePMIDs
Page: 1