Schematic overview of the cellular and molecular mechanisms involved in the cancer progression, including the proposed cellular and molecular mechanisms in cancer cells trajectory. AT1: alveolar type 1 cells; AT2: alveolar type 2 cells; AAH: atypical adenomatous hyperplasia; AIS: adenocarcinoma in situ; MIA: minimally invasive adenocarcinoma; IA: invasive adenocarcinoma; EMT: epithelial-mesenchymal transition

Home

Download

Statistics

Help

Contact

Center for Computational Systems Medicine
leaf

Gene summary

leaf

Malignant transformation analysis

leaf

Malignant transformation related pathway analysis

leaf

Cell-cell communication analysis

leaf

Single-cell gene regulatory network inference analysis

leaf

Somatic mutation of malignant transformation related genes

leaf

Related drugs of malignant transformation related genes

Gene: DUOX2

Gene summary for DUOX2

check button Gene summary.

Gene informationSpeciesHuman
Gene symbol

DUOX2

Gene ID

50506

Gene namedual oxidase 2
Gene AliasLNOX2
Cytomap15q21.1
Gene Typeprotein-coding
GO ID

GO:0006575

UniProtAcc

Q9NRD8


Top

Malignant transformation analysis

check button Identification of the aberrant gene expression in precancerous and cancerous lesions by comparing the gene expression of stem-like cells in diseased tissues with normal stem cells
check button Malignant transformation involving gene list.
Entrez IDSymbolReplicatesSpeciesOrganTissueAdj P-valueLog2FCMalignancy
50506DUOX2CCII_1HumanCervixCC3.08e-206.00e-010.3249
50506DUOX2TumorHumanCervixCC1.59e-225.63e-010.1241
50506DUOX2sample3HumanCervixCC3.26e-478.19e-010.1387
50506DUOX2H2HumanCervixHSIL_HPV4.82e-257.35e-010.0632
50506DUOX2T3HumanCervixCC1.65e-498.42e-010.1389
50506DUOX2HTA11_1938_2000001011HumanColorectumAD4.75e-165.71e-01-0.0811
50506DUOX2HTA11_411_2000001011HumanColorectumSER5.01e-102.52e+00-0.2602
50506DUOX2HTA11_1391_2000001011HumanColorectumAD5.64e-251.27e+00-0.059
50506DUOX2HTA11_866_3004761011HumanColorectumAD8.37e-116.16e-010.096
50506DUOX2HTA11_7696_3000711011HumanColorectumAD1.21e-042.98e-010.0674
50506DUOX2HTA11_6818_2000001011HumanColorectumAD3.01e-065.39e-010.0112
50506DUOX2HTA11_6818_2000001021HumanColorectumAD1.77e-209.12e-010.0588
50506DUOX2HTA11_99999973899_84307HumanColorectumMSS5.67e-075.32e-010.2585
50506DUOX2A002-C-010HumanColorectumFAP7.88e-043.46e-010.242
50506DUOX2A001-C-207HumanColorectumFAP1.17e-023.10e-010.1278
50506DUOX2A002-C-201HumanColorectumFAP3.68e-207.45e-010.0324
50506DUOX2A002-C-203HumanColorectumFAP9.53e-135.40e-010.2786
50506DUOX2A001-C-108HumanColorectumFAP4.25e-023.15e-01-0.0272
50506DUOX2A002-C-021HumanColorectumFAP5.09e-154.69e-010.1171
50506DUOX2A015-C-005HumanColorectumFAP5.56e-043.17e-01-0.0336
Page: 1 2 3 4 

check button Transcriptomic changes along malignancy continuum.
TissueExpression DynamicsAbbreviation
CervixThe image shows the transcriptomic changes along malignancy continuum.log2FC in expression of this searched gene in stem-like cells from each diseased tissue sample relative to stem-like cells in normal samples in each tissue plotted against the malignancy continuum. Samples are colored based on if they are from different disease stage.CC: Cervix cancer
HSIL_HPV: HPV-infected high-grade squamous intraepithelial lesions
N_HPV: HPV-infected normal cervix
Colorectum (GSE201348)The image shows the transcriptomic changes along malignancy continuum.log2FC in expression of this searched gene in stem-like cells from each diseased tissue sample relative to stem-like cells in normal samples in each tissue plotted against the malignancy continuum. Samples are colored based on if they are from different disease stage.FAP: Familial adenomatous polyposis
CRC: Colorectal cancer
Colorectum (HTA11)The image shows the transcriptomic changes along malignancy continuum.log2FC in expression of this searched gene in stem-like cells from each diseased tissue sample relative to stem-like cells in normal samples in each tissue plotted against the malignancy continuum. Samples are colored based on if they are from different disease stage.AD: Adenomas
SER: Sessile serrated lesions
MSI-H: Microsatellite-high colorectal cancer
MSS: Microsatellite stable colorectal cancer
EsophagusThe image shows the transcriptomic changes along malignancy continuum.log2FC in expression of this searched gene in stem-like cells from each diseased tissue sample relative to stem-like cells in normal samples in each tissue plotted against the malignancy continuum. Samples are colored based on if they are from different disease stage.
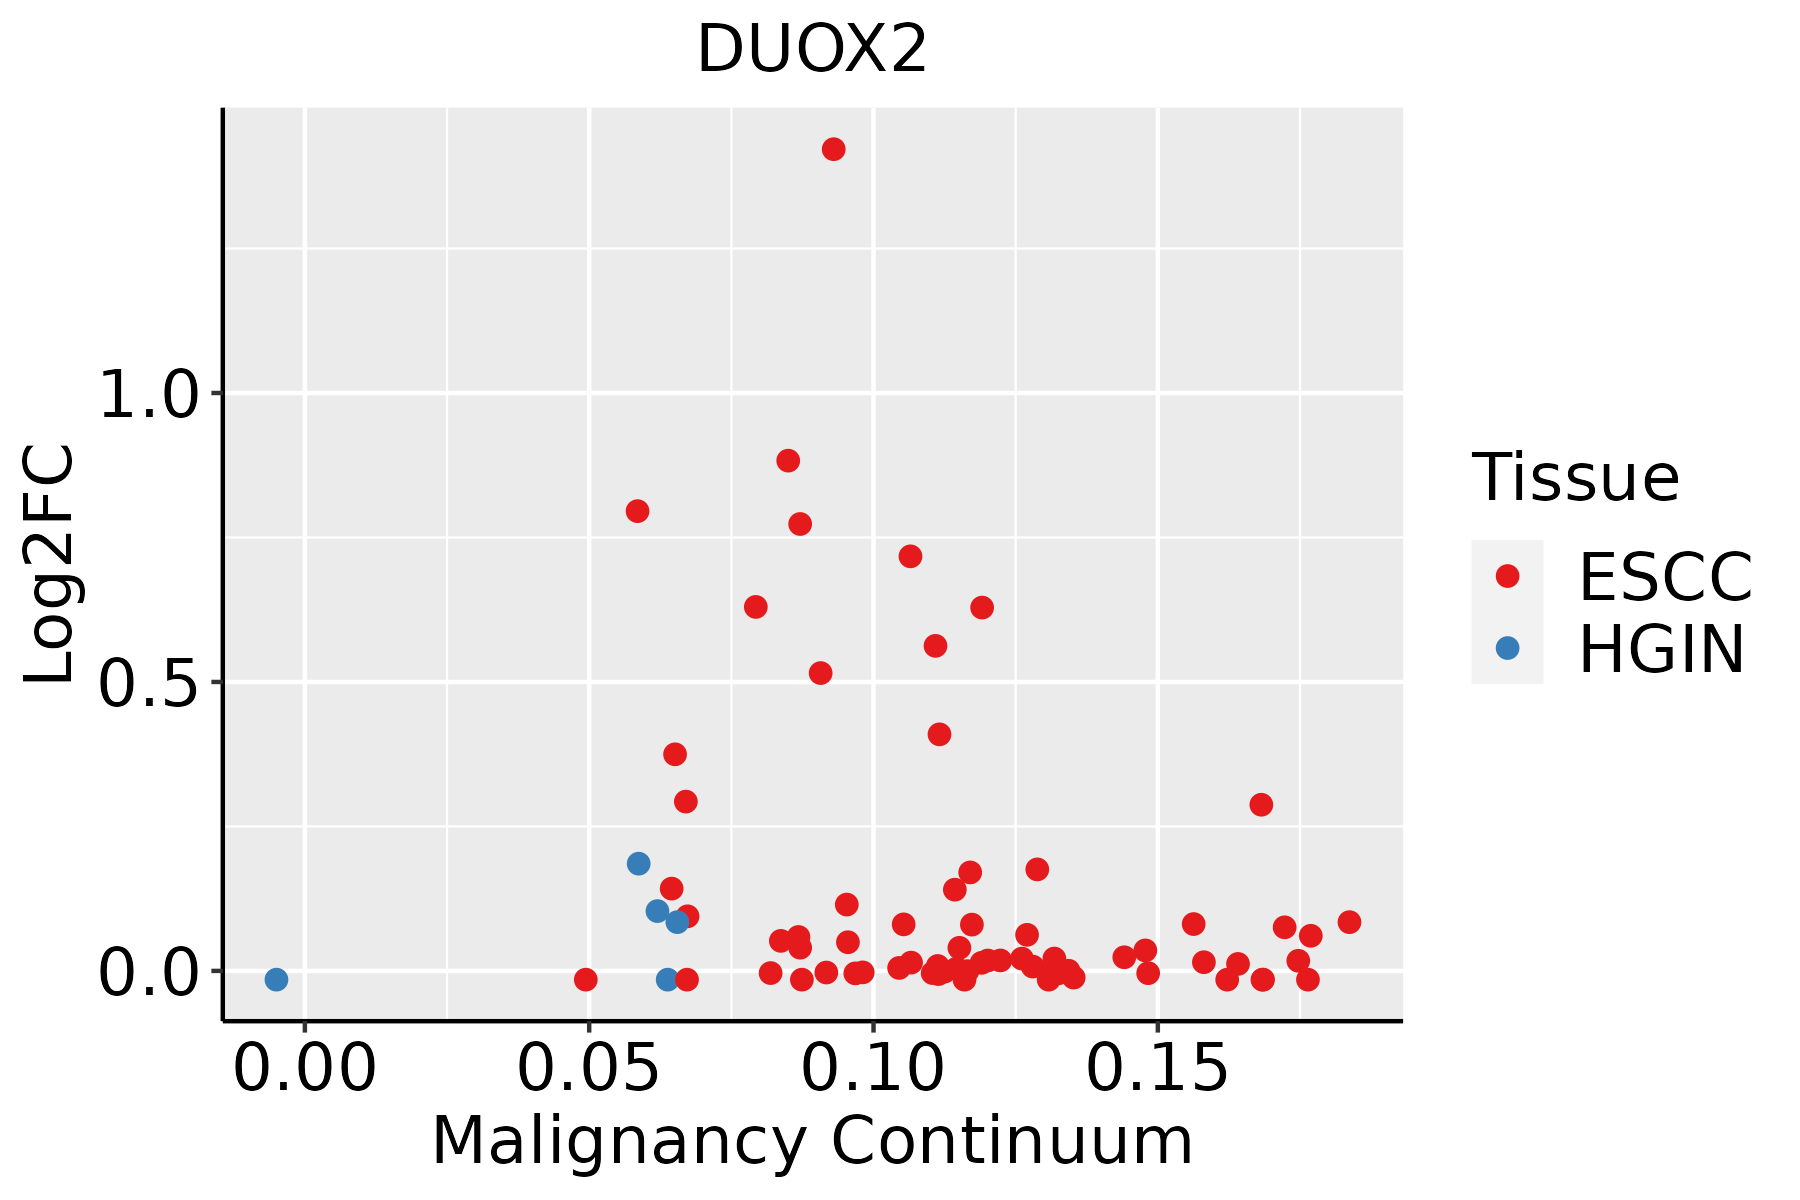
ESCC: Esophageal squamous cell carcinoma
HGIN: High-grade intraepithelial neoplasias
LGIN: Low-grade intraepithelial neoplasias
GCThe image shows the transcriptomic changes along malignancy continuum.log2FC in expression of this searched gene in stem-like cells from each diseased tissue sample relative to stem-like cells in normal samples in each tissue plotted against the malignancy continuum. Samples are colored based on if they are from different disease stage.
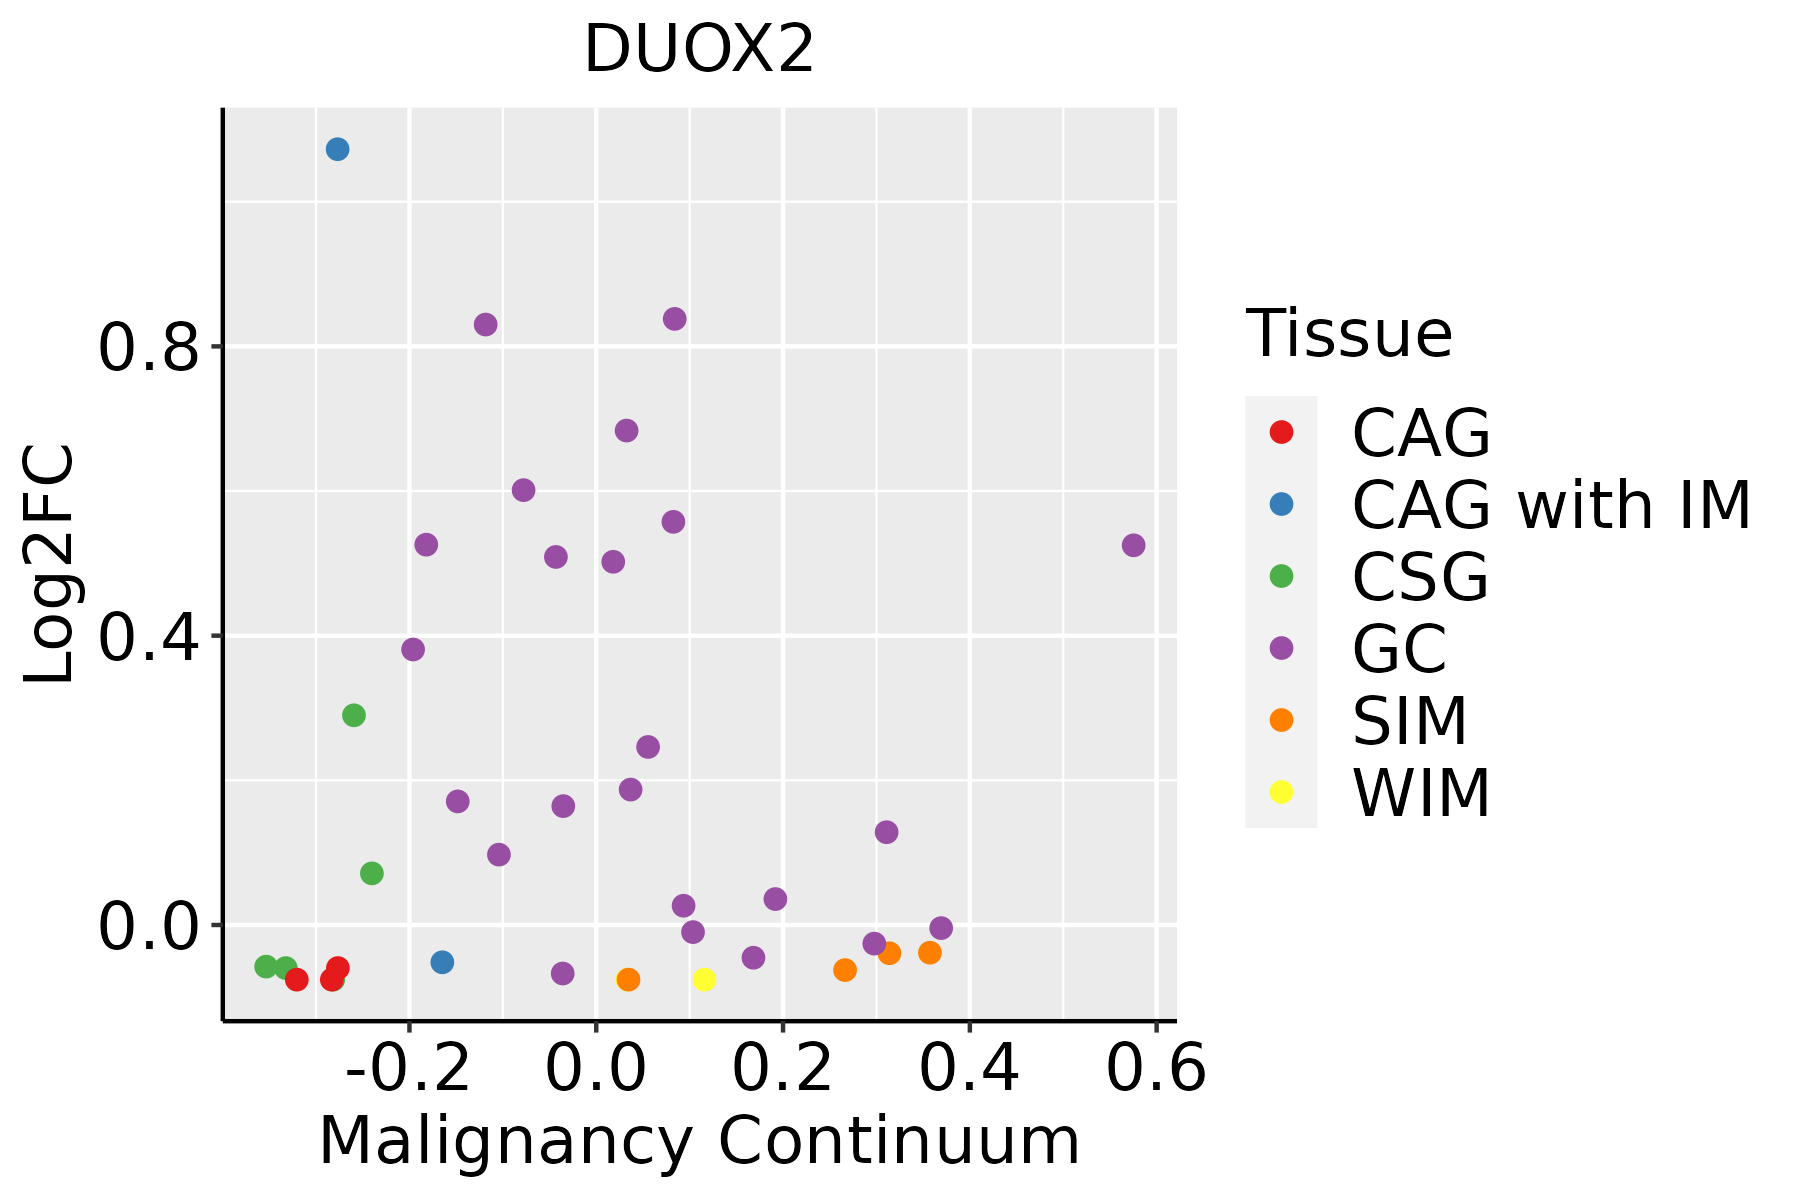
CAG: Chronic atrophic gastritis
CAG with IM: Chronic atrophic gastritis with intestinal metaplasia
CSG: Chronic superficial gastritis
GC: Gastric cancer
SIM: Severe intestinal metaplasia
WIM: Wild intestinal metaplasia
ThyroidThe image shows the transcriptomic changes along malignancy continuum.log2FC in expression of this searched gene in stem-like cells from each diseased tissue sample relative to stem-like cells in normal samples in each tissue plotted against the malignancy continuum. Samples are colored based on if they are from different disease stage.
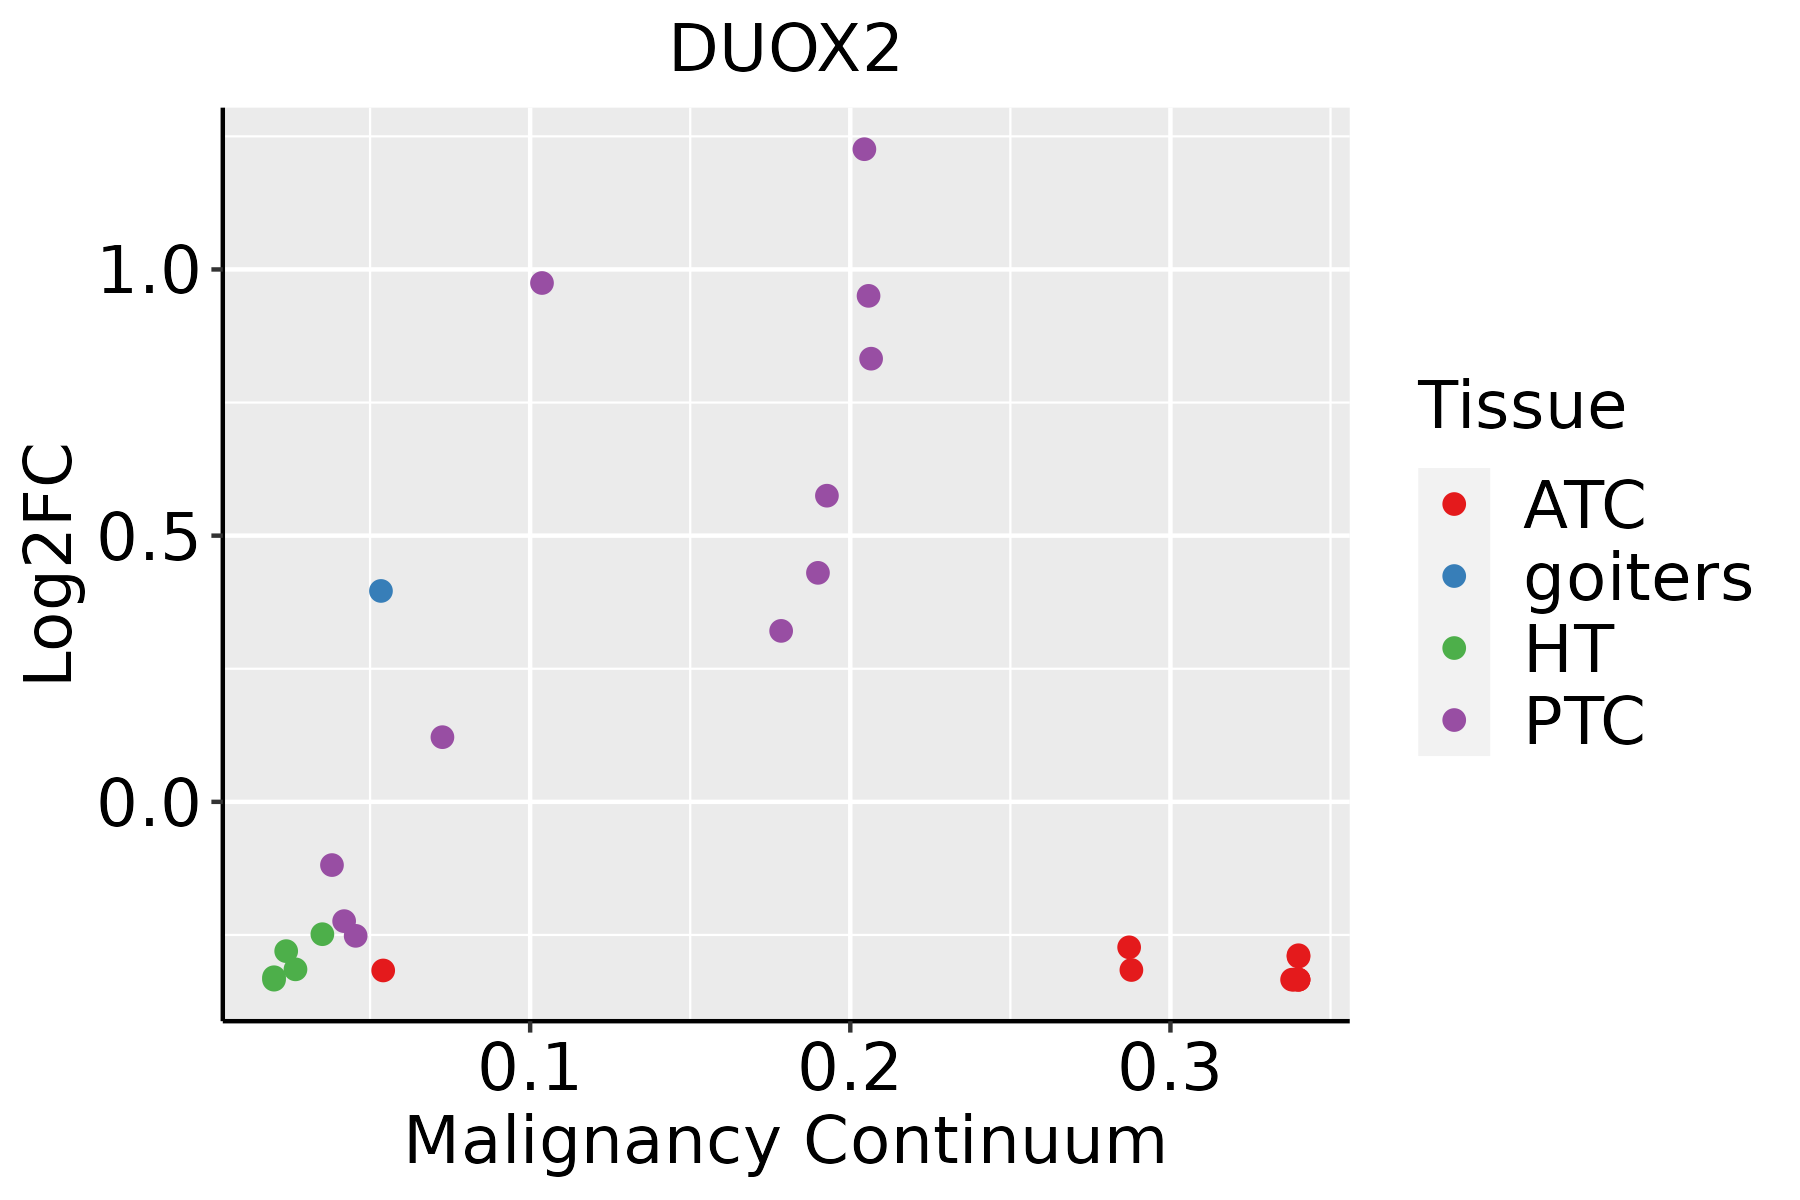
ATC: Anaplastic thyroid cancer
HT: Hashimoto's thyroiditis
PTC: Papillary thyroid cancer
∗log2FC in expression of this searched gene in stem-like cells from each diseased tissue sample relative to stem-like cells in normal samples in each tissue plotted against the malignancy continuum. Samples are colored based on if they are from different disease stage.

Top

Malignant transformation related pathway analysis

check buttonFind out the enriched GO biological processes and KEGG pathways involved in transition from healthy to precancer to cancer
check button Figure of enriched GO biological processes.
TissueDisease StageEnriched GO biological Processes
ColorectumADGO analysis - Figure of enriched GO biological processes: Top 15 enriched GO BP terms are showed in the bar plot of each disease state in each tissue. Each row represents a significant GO biological process which is colored according to the -log10(p.adjust).
ColorectumSERGO analysis - Figure of enriched GO biological processes: Top 15 enriched GO BP terms are showed in the bar plot of each disease state in each tissue. Each row represents a significant GO biological process which is colored according to the -log10(p.adjust).
ColorectumMSSGO analysis - Figure of enriched GO biological processes: Top 15 enriched GO BP terms are showed in the bar plot of each disease state in each tissue. Each row represents a significant GO biological process which is colored according to the -log10(p.adjust).
ColorectumMSI-HGO analysis - Figure of enriched GO biological processes: Top 15 enriched GO BP terms are showed in the bar plot of each disease state in each tissue. Each row represents a significant GO biological process which is colored according to the -log10(p.adjust).
ColorectumFAPGO analysis - Figure of enriched GO biological processes: Top 15 enriched GO BP terms are showed in the bar plot of each disease state in each tissue. Each row represents a significant GO biological process which is colored according to the -log10(p.adjust).
∗Top 15 enriched GO BP terms are showed in the bar plot of each disease state in each tissue. Each row represents a significant GO biological process which is colored according to the -log10(p.adjust).
Page: 1 2 3 4 5 6 7 8 9 

check button Enriched GO biological processes.
GO IDTissueDisease StageDescriptionGene RatioBg Ratiopvaluep.adjustCount
GO:00096362ColorectumMSSresponse to toxic substance73/3467262/187231.26e-041.94e-0373
GO:00065751ColorectumMSScellular modified amino acid metabolic process55/3467188/187232.16e-043.01e-0355
GO:00972372ColorectumMSScellular response to toxic substance37/3467124/187231.47e-031.36e-0237
GO:00725932ColorectumMSSreactive oxygen species metabolic process62/3467239/187232.68e-032.12e-0262
GO:19907482ColorectumMSScellular detoxification34/3467116/187233.08e-032.34e-0234
GO:00987542ColorectumMSSdetoxification41/3467152/187236.41e-034.27e-0241
GO:00420604ColorectumFAPwound healing99/2622422/187239.50e-086.33e-0699
GO:00069794ColorectumFAPresponse to oxidative stress102/2622446/187232.29e-071.33e-05102
GO:00515911ColorectumFAPresponse to cAMP27/262293/187231.26e-042.03e-0327
GO:00610411ColorectumFAPregulation of wound healing35/2622134/187231.48e-042.29e-0335
GO:19030341ColorectumFAPregulation of response to wounding41/2622167/187231.86e-042.74e-0341
GO:0046683ColorectumFAPresponse to organophosphorus33/2622131/187234.61e-045.39e-0333
GO:0014074ColorectumFAPresponse to purine-containing compound35/2622148/187231.09e-031.05e-0235
GO:0090303ColorectumFAPpositive regulation of wound healing17/262259/187232.33e-031.87e-0217
GO:00096363ColorectumFAPresponse to toxic substance53/2622262/187233.35e-032.46e-0253
GO:000697927EsophagusHGINresponse to oxidative stress107/2587446/187233.91e-092.76e-07107
GO:199074820EsophagusHGINcellular detoxification30/2587116/187234.05e-046.15e-0330
GO:009723720EsophagusHGINcellular response to toxic substance30/2587124/187231.32e-031.57e-0230
GO:009886920EsophagusHGINcellular oxidant detoxification25/2587101/187232.29e-032.34e-0225
GO:000961517EsophagusHGINresponse to virus69/2587367/187234.39e-033.86e-0269
Page: 1 2 3 4 5 6 7 8 9 10 11 

check button Enriched KEGG pathways.
Pathway IDTissueDisease StageDescriptionGene RatioBg Ratiopvaluep.adjustqvalueCount
Page: 1 

Top

Cell-cell communication analysis

check buttonIdentification of potential cell-cell interactions between two cell types and their ligand-receptor pairs for different disease states
LigandReceptorLRpairPathwayTissueDisease Stage
Page: 1 

Top

Single-cell gene regulatory network inference analysis

check buttonFind out the significant the regulons (TFs) and the target genes of each regulon across cell types for different disease states
TFCell TypeTissueDisease StageTarget GeneRSSRegulon Activity
∗The dot plots of a searched regulon are shown for all cell subpopulations in each disease state of each tissue based on the regulon specific score inferred using pySCENIC and by calculating the average expression.
Page: 1 

Top

Somatic mutation of malignant transformation related genes

check buttonAnnotation of somatic variants for genes involved in malignant transformation
Hugo SymbolVariant ClassVariant ClassificationdbSNP RSHGVScHGVSpHGVSp ShortSWISSPROTBIOTYPESIFTPolyPhenTumor Sample BarcodeTissueHistologySexAgeStageTherapy TypesDrugsOutcome
DUOX2SNVMissense_Mutationrs764655103c.1636G>Ap.Ala546Thrp.A546TQ9NRD8protein_codingtolerated(0.1)benign(0.052)TCGA-A8-A09Z-01Breastbreast invasive carcinomaFemale>=65I/IIUnknownUnknownSD
DUOX2SNVMissense_Mutationnovelc.1900C>Tp.Leu634Phep.L634FQ9NRD8protein_codingtolerated(0.07)benign(0.003)TCGA-AN-A046-01Breastbreast invasive carcinomaFemale>=65I/IIUnknownUnknownSD
DUOX2SNVMissense_Mutationc.4105N>Ap.Glu1369Lysp.E1369KQ9NRD8protein_codingdeleterious(0)possibly_damaging(0.861)TCGA-D8-A1JA-01Breastbreast invasive carcinomaFemale<65III/IVChemotherapyadriamycinPD
DUOX2SNVMissense_Mutationc.1951N>Ap.Glu651Lysp.E651KQ9NRD8protein_codingdeleterious(0)possibly_damaging(0.463)TCGA-D8-A1JN-01Breastbreast invasive carcinomaFemale>=65III/IVHormone TherapyanastrozolumSD
DUOX2SNVMissense_Mutationc.4391N>Gp.Met1464Argp.M1464RQ9NRD8protein_codingdeleterious(0)probably_damaging(0.94)TCGA-E9-A1NC-01Breastbreast invasive carcinomaFemale<65I/IIChemotherapydoxorubicinCR
DUOX2SNVMissense_Mutationrs778481365c.2960C>Ap.Ala987Aspp.A987DQ9NRD8protein_codingtolerated(0.67)benign(0.039)TCGA-GM-A2DH-01Breastbreast invasive carcinomaFemale<65I/IIChemotherapytaxolCR
DUOX2SNVMissense_Mutationrs758697659c.4613G>Ap.Arg1538Glnp.R1538QQ9NRD8protein_codingtolerated(1)benign(0)TCGA-PE-A5DE-01Breastbreast invasive carcinomaFemale<65I/IIChemotherapytaxotereCR
DUOX2SNVMissense_Mutationrs368488511c.3329G>Ap.Arg1110Glnp.R1110QQ9NRD8protein_codingdeleterious(0.02)possibly_damaging(0.906)TCGA-PE-A5DE-01Breastbreast invasive carcinomaFemale<65I/IIChemotherapytaxotereCR
DUOX2insertionFrame_Shift_Insnovelc.2897_2898insGGCTCTCTCCCTGCTGCTCCAGGCCAGAATCp.Phe966LeufsTer166p.F966Lfs*166Q9NRD8protein_codingTCGA-AN-A0FX-01Breastbreast invasive carcinomaFemale<65I/IIUnknownUnknownSD
DUOX2insertionFrame_Shift_Insnovelc.2895_2896insGATGCp.Phe966AspfsTer32p.F966Dfs*32Q9NRD8protein_codingTCGA-AN-A0FX-01Breastbreast invasive carcinomaFemale<65I/IIUnknownUnknownSD
Page: 1 2 3 4 5 6 7 8 9 10 11 12 13 14 15 16 17 18 

Top

Related drugs of malignant transformation related genes

check buttonIdentification of chemicals and drugs interact with genes involved in malignant transfromation
(DGIdb 4.0)
Entrez IDSymbolCategoryInteraction TypesDrug Claim NameDrug NamePMIDs
50506DUOX2TRANSPORTER, ENZYME, DRUGGABLE GENOME, CELL SURFACEinhibitor363894227
Page: 1