
|
|||||
|
 | |
| |
| |
| |
| |
| |
|
Gene: DNMT3A |
Gene summary for DNMT3A |
| Gene information | Species | Human | Gene symbol | DNMT3A | Gene ID | 1788 |
| Gene name | DNA methyltransferase 3 alpha | |
| Gene Alias | DNMT3A2 | |
| Cytomap | 2p23.3 | |
| Gene Type | protein-coding | GO ID | GO:0000003 | UniProtAcc | Q9Y6K1 |
Top |
Malignant transformation analysis |
| Identification of the aberrant gene expression in precancerous and cancerous lesions by comparing the gene expression of stem-like cells in diseased tissues with normal stem cells |
| Entrez ID | Symbol | Replicates | Species | Organ | Tissue | Adj P-value | Log2FC | Malignancy |
| 1788 | DNMT3A | LZE2T | Human | Esophagus | ESCC | 5.71e-03 | 3.50e-01 | 0.082 |
| 1788 | DNMT3A | LZE4T | Human | Esophagus | ESCC | 3.20e-03 | 1.49e-01 | 0.0811 |
| 1788 | DNMT3A | LZE7T | Human | Esophagus | ESCC | 1.53e-04 | 2.36e-01 | 0.0667 |
| 1788 | DNMT3A | LZE24T | Human | Esophagus | ESCC | 4.08e-04 | 1.58e-01 | 0.0596 |
| 1788 | DNMT3A | P1T-E | Human | Esophagus | ESCC | 8.93e-04 | 2.46e-01 | 0.0875 |
| 1788 | DNMT3A | P2T-E | Human | Esophagus | ESCC | 1.56e-39 | 6.69e-01 | 0.1177 |
| 1788 | DNMT3A | P4T-E | Human | Esophagus | ESCC | 1.28e-02 | 1.64e-01 | 0.1323 |
| 1788 | DNMT3A | P5T-E | Human | Esophagus | ESCC | 4.76e-11 | 1.27e-01 | 0.1327 |
| 1788 | DNMT3A | P8T-E | Human | Esophagus | ESCC | 1.04e-10 | 1.79e-01 | 0.0889 |
| 1788 | DNMT3A | P9T-E | Human | Esophagus | ESCC | 6.18e-03 | 1.36e-01 | 0.1131 |
| 1788 | DNMT3A | P10T-E | Human | Esophagus | ESCC | 3.91e-27 | 3.81e-01 | 0.116 |
| 1788 | DNMT3A | P11T-E | Human | Esophagus | ESCC | 4.64e-05 | 1.95e-01 | 0.1426 |
| 1788 | DNMT3A | P12T-E | Human | Esophagus | ESCC | 3.70e-18 | 3.58e-01 | 0.1122 |
| 1788 | DNMT3A | P15T-E | Human | Esophagus | ESCC | 1.12e-10 | 2.28e-01 | 0.1149 |
| 1788 | DNMT3A | P16T-E | Human | Esophagus | ESCC | 1.12e-22 | 4.45e-01 | 0.1153 |
| 1788 | DNMT3A | P20T-E | Human | Esophagus | ESCC | 5.29e-04 | 1.01e-01 | 0.1124 |
| 1788 | DNMT3A | P21T-E | Human | Esophagus | ESCC | 4.82e-03 | 6.97e-02 | 0.1617 |
| 1788 | DNMT3A | P22T-E | Human | Esophagus | ESCC | 9.55e-11 | 1.48e-01 | 0.1236 |
| 1788 | DNMT3A | P23T-E | Human | Esophagus | ESCC | 3.31e-11 | 2.91e-01 | 0.108 |
| 1788 | DNMT3A | P24T-E | Human | Esophagus | ESCC | 4.66e-06 | 1.50e-01 | 0.1287 |
| Page: 1 2 3 4 |
| Tissue | Expression Dynamics | Abbreviation |
| Esophagus |  | ESCC: Esophageal squamous cell carcinoma |
| HGIN: High-grade intraepithelial neoplasias | ||
| LGIN: Low-grade intraepithelial neoplasias | ||
| Thyroid | 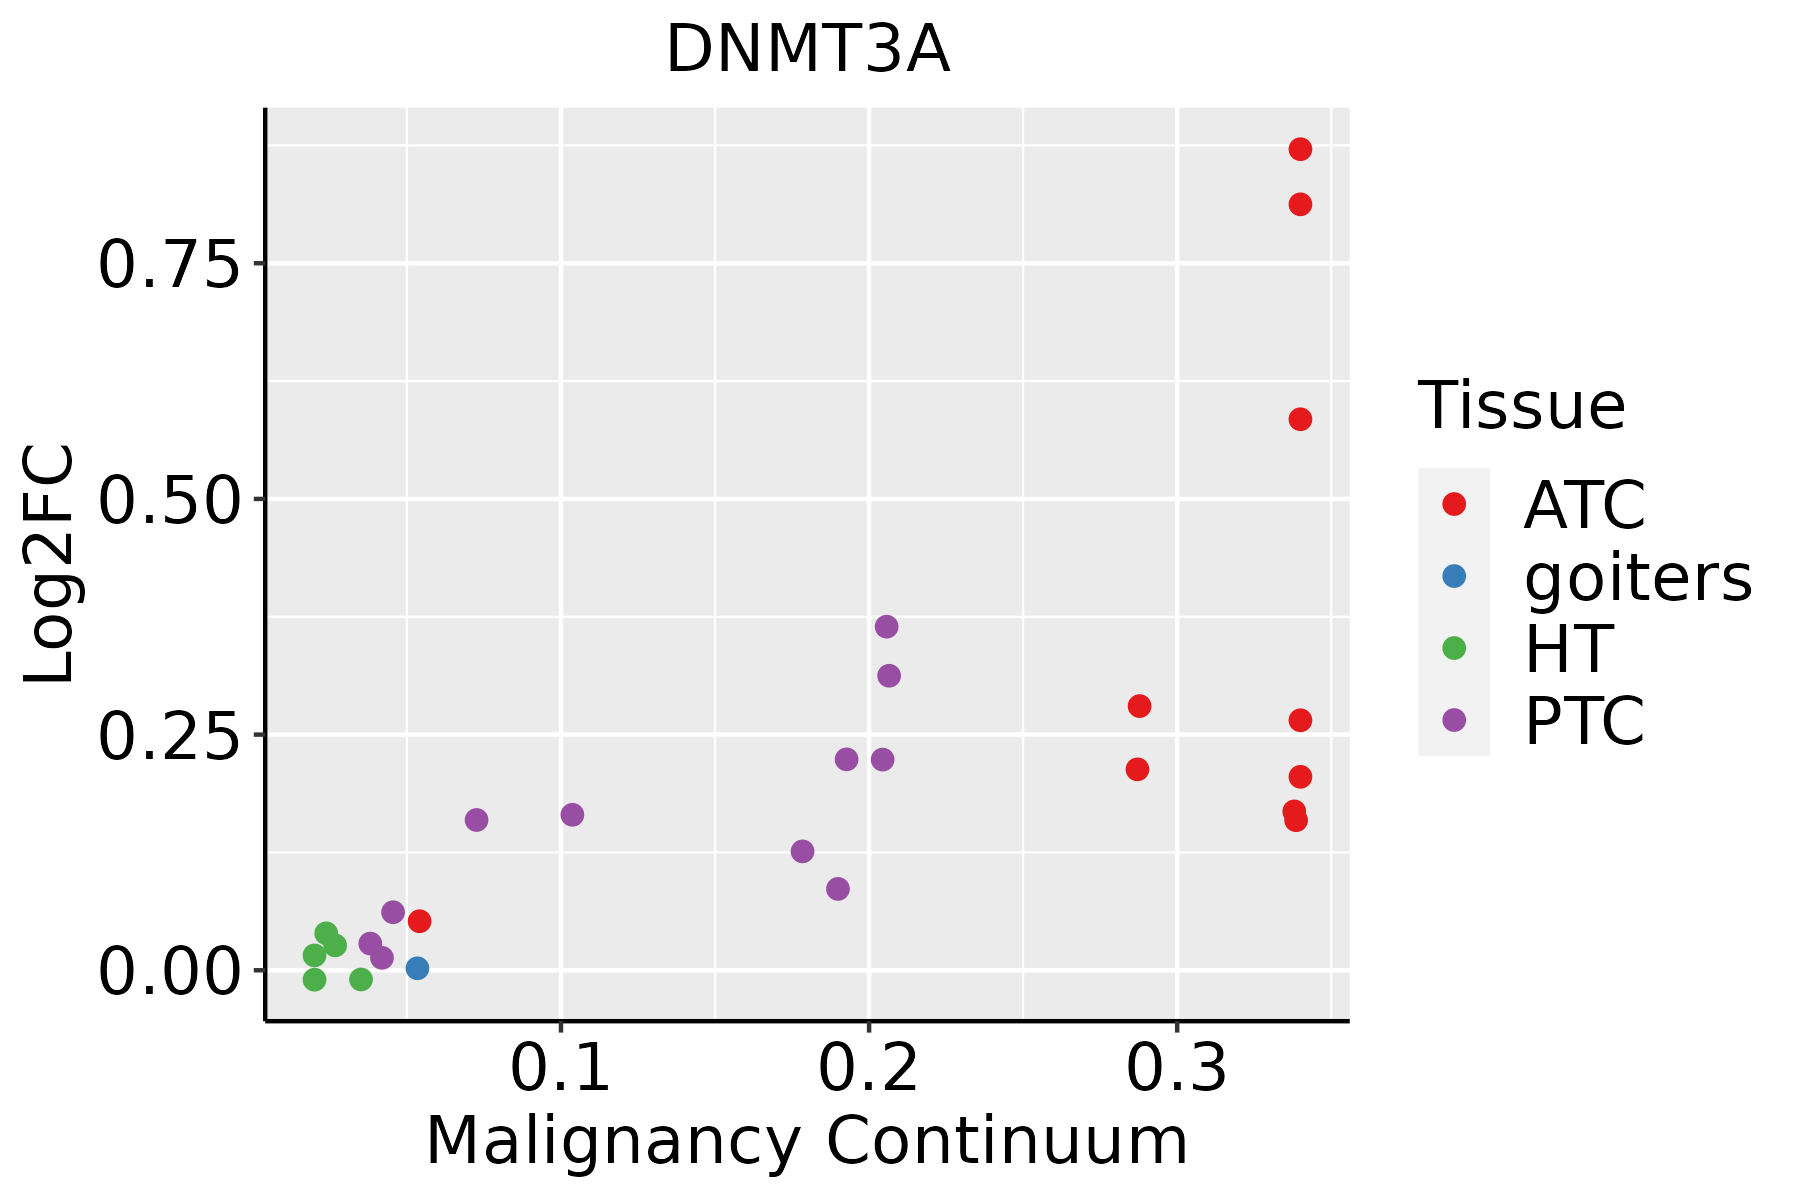 | ATC: Anaplastic thyroid cancer |
| HT: Hashimoto's thyroiditis | ||
| PTC: Papillary thyroid cancer |
| ∗log2FC in expression of this searched gene in stem-like cells from each diseased tissue sample relative to stem-like cells in normal samples in each tissue plotted against the malignancy continuum. Samples are colored based on if they are from different disease stage. |
Top |
Malignant transformation related pathway analysis |
| Find out the enriched GO biological processes and KEGG pathways involved in transition from healthy to precancer to cancer |
| Tissue | Disease Stage | Enriched GO biological Processes |
| Colorectum | AD |  |
| Colorectum | SER |  |
| Colorectum | MSS |  |
| Colorectum | MSI-H |  |
| Colorectum | FAP |  |
| ∗Top 15 enriched GO BP terms are showed in the bar plot of each disease state in each tissue. Each row represents a significant GO biological process which is colored according to the -log10(p.adjust). |
| Page: 1 2 3 4 5 6 7 8 9 |
| GO ID | Tissue | Disease Stage | Description | Gene Ratio | Bg Ratio | pvalue | p.adjust | Count |
| GO:000166628 | Thyroid | ATC | response to hypoxia | 169/6293 | 307/18723 | 6.58e-15 | 4.12e-13 | 169 |
| GO:000756829 | Thyroid | ATC | aging | 166/6293 | 339/18723 | 2.79e-09 | 6.60e-08 | 166 |
| GO:000931426 | Thyroid | ATC | response to radiation | 210/6293 | 456/18723 | 1.69e-08 | 3.39e-07 | 210 |
| GO:0010212110 | Thyroid | ATC | response to ionizing radiation | 82/6293 | 148/18723 | 3.88e-08 | 7.15e-07 | 82 |
| GO:0006325110 | Thyroid | ATC | chromatin organization | 189/6293 | 409/18723 | 6.40e-08 | 1.13e-06 | 189 |
| GO:007145325 | Thyroid | ATC | cellular response to oxygen levels | 94/6293 | 177/18723 | 6.62e-08 | 1.17e-06 | 94 |
| GO:0031667210 | Thyroid | ATC | response to nutrient levels | 212/6293 | 474/18723 | 2.37e-07 | 3.70e-06 | 212 |
| GO:003629425 | Thyroid | ATC | cellular response to decreased oxygen levels | 85/6293 | 161/18723 | 3.86e-07 | 5.65e-06 | 85 |
| GO:007145624 | Thyroid | ATC | cellular response to hypoxia | 78/6293 | 151/18723 | 3.44e-06 | 3.86e-05 | 78 |
| GO:004002913 | Thyroid | ATC | regulation of gene expression, epigenetic | 57/6293 | 105/18723 | 1.01e-05 | 1.00e-04 | 57 |
| GO:0010038210 | Thyroid | ATC | response to metal ion | 165/6293 | 373/18723 | 1.07e-05 | 1.05e-04 | 165 |
| GO:003235519 | Thyroid | ATC | response to estradiol | 72/6293 | 141/18723 | 1.35e-05 | 1.29e-04 | 72 |
| GO:000110124 | Thyroid | ATC | response to acid chemical | 69/6293 | 135/18723 | 1.95e-05 | 1.76e-04 | 69 |
| GO:000963634 | Thyroid | ATC | response to toxic substance | 119/6293 | 262/18723 | 4.30e-05 | 3.48e-04 | 119 |
| GO:009730528 | Thyroid | ATC | response to alcohol | 113/6293 | 253/18723 | 1.53e-04 | 1.06e-03 | 113 |
| GO:004320022 | Thyroid | ATC | response to amino acid | 58/6293 | 116/18723 | 1.88e-04 | 1.26e-03 | 58 |
| GO:007122922 | Thyroid | ATC | cellular response to acid chemical | 42/6293 | 80/18723 | 3.75e-04 | 2.29e-03 | 42 |
| GO:190401921 | Thyroid | ATC | epithelial cell apoptotic process | 58/6293 | 121/18723 | 7.47e-04 | 4.14e-03 | 58 |
| GO:007123022 | Thyroid | ATC | cellular response to amino acid stimulus | 37/6293 | 71/18723 | 9.80e-04 | 5.21e-03 | 37 |
| GO:000758418 | Thyroid | ATC | response to nutrient | 78/6293 | 174/18723 | 1.31e-03 | 6.85e-03 | 78 |
| Page: 1 2 3 4 5 |
| Pathway ID | Tissue | Disease Stage | Description | Gene Ratio | Bg Ratio | pvalue | p.adjust | qvalue | Count |
| Page: 1 |
Top |
Cell-cell communication analysis |
| Identification of potential cell-cell interactions between two cell types and their ligand-receptor pairs for different disease states |
| Ligand | Receptor | LRpair | Pathway | Tissue | Disease Stage |
| Page: 1 |
Top |
Single-cell gene regulatory network inference analysis |
| Find out the significant the regulons (TFs) and the target genes of each regulon across cell types for different disease states |
| TF | Cell Type | Tissue | Disease Stage | Target Gene | RSS | Regulon Activity |
| DNMT3A | GDT | Endometrium | AEH | PHYKPL,SERTAD2,PLA2G16, etc. | 2.03e-01 |  |
| DNMT3A | GDT | Endometrium | EEC | PHYKPL,SERTAD2,PLA2G16, etc. | 1.54e-01 |  |
| DNMT3A | NK | Endometrium | EEC | PHYKPL,SERTAD2,PLA2G16, etc. | 6.10e-02 | |
| ∗The dot plots of a searched regulon are shown for all cell subpopulations in each disease state of each tissue based on the regulon specific score inferred using pySCENIC and by calculating the average expression. |
| Page: 1 |
Top |
Somatic mutation of malignant transformation related genes |
| Annotation of somatic variants for genes involved in malignant transformation |
| Hugo Symbol | Variant Class | Variant Classification | dbSNP RS | HGVSc | HGVSp | HGVSp Short | SWISSPROT | BIOTYPE | SIFT | PolyPhen | Tumor Sample Barcode | Tissue | Histology | Sex | Age | Stage | Therapy Types | Drugs | Outcome |
| DNMT3A | SNV | Missense_Mutation | rs367909007 | c.2141N>G | p.Ser714Cys | p.S714C | Q9Y6K1 | protein_coding | deleterious(0.01) | probably_damaging(0.997) | TCGA-A2-A0D2-01 | Breast | breast invasive carcinoma | Female | <65 | I/II | Chemotherapy | adriamycin | SD |
| DNMT3A | SNV | Missense_Mutation | novel | c.2431N>A | p.Asp811Asn | p.D811N | Q9Y6K1 | protein_coding | deleterious(0) | benign(0.202) | TCGA-A2-A0YK-01 | Breast | breast invasive carcinoma | Female | <65 | I/II | Chemotherapy | cytoxan | SD |
| DNMT3A | SNV | Missense_Mutation | c.1282N>C | p.Glu428Gln | p.E428Q | Q9Y6K1 | protein_coding | tolerated(0.21) | benign(0.424) | TCGA-AC-A23H-01 | Breast | breast invasive carcinoma | Female | >=65 | I/II | Unknown | Unknown | PD | |
| DNMT3A | SNV | Missense_Mutation | c.1024N>A | p.Glu342Lys | p.E342K | Q9Y6K1 | protein_coding | deleterious(0.05) | possibly_damaging(0.802) | TCGA-AC-A23H-01 | Breast | breast invasive carcinoma | Female | >=65 | I/II | Unknown | Unknown | PD | |
| DNMT3A | SNV | Missense_Mutation | c.793N>A | p.Val265Met | p.V265M | Q9Y6K1 | protein_coding | tolerated(0.07) | possibly_damaging(0.593) | TCGA-AO-A128-01 | Breast | breast invasive carcinoma | Female | <65 | I/II | Chemotherapy | doxorubicin | SD | |
| DNMT3A | SNV | Missense_Mutation | novel | c.650N>C | p.Lys217Thr | p.K217T | Q9Y6K1 | protein_coding | deleterious(0.03) | benign(0.074) | TCGA-BH-A18J-01 | Breast | breast invasive carcinoma | Female | <65 | III/IV | Unknown | Unknown | PD |
| DNMT3A | SNV | Missense_Mutation | rs752160822 | c.2669N>A | p.Gly890Asp | p.G890D | Q9Y6K1 | protein_coding | deleterious(0) | probably_damaging(0.989) | TCGA-D8-A1JE-01 | Breast | breast invasive carcinoma | Female | <65 | I/II | Chemotherapy | adriamicin | SD |
| DNMT3A | insertion | Frame_Shift_Ins | novel | c.572_573insTGCCGAGGCTCACCTTCCA | p.Gln191HisfsTer31 | p.Q191Hfs*31 | Q9Y6K1 | protein_coding | TCGA-A7-A3IY-01 | Breast | breast invasive carcinoma | Female | >=65 | I/II | Hormone Therapy | anastrozole | SD | ||
| DNMT3A | insertion | Nonsense_Mutation | novel | c.1607_1608insGT | p.Tyr536Ter | p.Y536* | Q9Y6K1 | protein_coding | TCGA-A8-A09G-01 | Breast | breast invasive carcinoma | Female | >=65 | III/IV | Unknown | Unknown | SD | ||
| DNMT3A | insertion | In_Frame_Ins | novel | c.1606_1607insCCTGGGTTCAAGCAGTTCTCCTGCCTCAGCCTCCCG | p.Tyr536delinsSerTrpValGlnAlaValLeuLeuProGlnProProAsp | p.Y536delinsSWVQAVLLPQPPD | Q9Y6K1 | protein_coding | TCGA-A8-A09G-01 | Breast | breast invasive carcinoma | Female | >=65 | III/IV | Unknown | Unknown | SD |
| Page: 1 2 3 4 5 6 7 8 9 10 11 12 |
Top |
Related drugs of malignant transformation related genes |
| Identification of chemicals and drugs interact with genes involved in malignant transfromation |
| (DGIdb 4.0) |
| Entrez ID | Symbol | Category | Interaction Types | Drug Claim Name | Drug Name | PMIDs |
| 1788 | DNMT3A | DRUGGABLE GENOME, ENZYME, CLINICALLY ACTIONABLE | PMID27376512-Compound-MTC-423 | |||
| 1788 | DNMT3A | DRUGGABLE GENOME, ENZYME, CLINICALLY ACTIONABLE | N/A | 21881046,25281355,22490330,21670448 | ||
| 1788 | DNMT3A | DRUGGABLE GENOME, ENZYME, CLINICALLY ACTIONABLE | PMID27376512-Compound-Figure2aExample1 | |||
| 1788 | DNMT3A | DRUGGABLE GENOME, ENZYME, CLINICALLY ACTIONABLE | PMID27376512-Compound-Figure3CM | |||
| 1788 | DNMT3A | DRUGGABLE GENOME, ENZYME, CLINICALLY ACTIONABLE | PMID27376512-Compound-MTC-427 | |||
| 1788 | DNMT3A | DRUGGABLE GENOME, ENZYME, CLINICALLY ACTIONABLE | PMID27376512-Compound-MTC-422 | |||
| 1788 | DNMT3A | DRUGGABLE GENOME, ENZYME, CLINICALLY ACTIONABLE | IDARUBICIN | IDARUBICIN | 22081665 | |
| 1788 | DNMT3A | DRUGGABLE GENOME, ENZYME, CLINICALLY ACTIONABLE | warfarin | WARFARIN | 27740732 | |
| 1788 | DNMT3A | DRUGGABLE GENOME, ENZYME, CLINICALLY ACTIONABLE | Decitabine | DECITABINE | 27418649 | |
| 1788 | DNMT3A | DRUGGABLE GENOME, ENZYME, CLINICALLY ACTIONABLE | DECITABINE | DECITABINE | 22124213 |
| Page: 1 2 |

Copyright 2023-Present -The University of Texas Health Science Center at Houston |