
|
|||||
|
 | |
| |
| |
| |
| |
| |
|
Gene: DNAJC5 |
Gene summary for DNAJC5 |
| Gene information | Species | Human | Gene symbol | DNAJC5 | Gene ID | 80331 |
| Gene name | DnaJ heat shock protein family (Hsp40) member C5 | |
| Gene Alias | CLN4 | |
| Cytomap | 20q13.33 | |
| Gene Type | protein-coding | GO ID | GO:0001505 | UniProtAcc | Q6AHX3 |
Top |
Malignant transformation analysis |
| Identification of the aberrant gene expression in precancerous and cancerous lesions by comparing the gene expression of stem-like cells in diseased tissues with normal stem cells |
| Entrez ID | Symbol | Replicates | Species | Organ | Tissue | Adj P-value | Log2FC | Malignancy |
| 80331 | DNAJC5 | CCI_1 | Human | Cervix | CC | 1.32e-08 | 9.30e-01 | 0.528 |
| 80331 | DNAJC5 | CCI_3 | Human | Cervix | CC | 2.43e-13 | 9.64e-01 | 0.516 |
| 80331 | DNAJC5 | HTA11_2487_2000001011 | Human | Colorectum | SER | 1.42e-02 | 3.80e-01 | -0.1808 |
| 80331 | DNAJC5 | HTA11_347_2000001011 | Human | Colorectum | AD | 2.49e-12 | 4.84e-01 | -0.1954 |
| 80331 | DNAJC5 | HTA11_411_2000001011 | Human | Colorectum | SER | 7.49e-05 | 9.36e-01 | -0.2602 |
| 80331 | DNAJC5 | HTA11_696_2000001011 | Human | Colorectum | AD | 3.07e-08 | 4.80e-01 | -0.1464 |
| 80331 | DNAJC5 | HTA11_866_2000001011 | Human | Colorectum | AD | 4.34e-02 | 2.89e-01 | -0.1001 |
| 80331 | DNAJC5 | HTA11_1391_2000001011 | Human | Colorectum | AD | 1.18e-06 | 4.91e-01 | -0.059 |
| 80331 | DNAJC5 | HTA11_546_2000001011 | Human | Colorectum | AD | 1.76e-02 | 4.18e-01 | -0.0842 |
| 80331 | DNAJC5 | HTA11_99999965104_69814 | Human | Colorectum | MSS | 8.59e-03 | 3.77e-01 | 0.281 |
| 80331 | DNAJC5 | HTA11_99999971662_82457 | Human | Colorectum | MSS | 3.58e-32 | 1.22e+00 | 0.3859 |
| 80331 | DNAJC5 | A015-C-203 | Human | Colorectum | FAP | 1.21e-08 | -1.38e-01 | -0.1294 |
| 80331 | DNAJC5 | A002-C-201 | Human | Colorectum | FAP | 1.21e-03 | -1.84e-01 | 0.0324 |
| 80331 | DNAJC5 | A001-C-108 | Human | Colorectum | FAP | 1.43e-04 | -2.20e-02 | -0.0272 |
| 80331 | DNAJC5 | A002-C-205 | Human | Colorectum | FAP | 1.47e-09 | -3.32e-01 | -0.1236 |
| 80331 | DNAJC5 | A015-C-006 | Human | Colorectum | FAP | 9.32e-07 | -2.40e-01 | -0.0994 |
| 80331 | DNAJC5 | A015-C-106 | Human | Colorectum | FAP | 6.00e-03 | -1.12e-01 | -0.0511 |
| 80331 | DNAJC5 | A002-C-114 | Human | Colorectum | FAP | 1.06e-06 | -7.62e-03 | -0.1561 |
| 80331 | DNAJC5 | A015-C-104 | Human | Colorectum | FAP | 2.95e-11 | -1.62e-01 | -0.1899 |
| 80331 | DNAJC5 | A001-C-014 | Human | Colorectum | FAP | 4.03e-07 | -1.83e-01 | 0.0135 |
| Page: 1 2 3 4 5 6 7 |
| Tissue | Expression Dynamics | Abbreviation |
| Cervix | 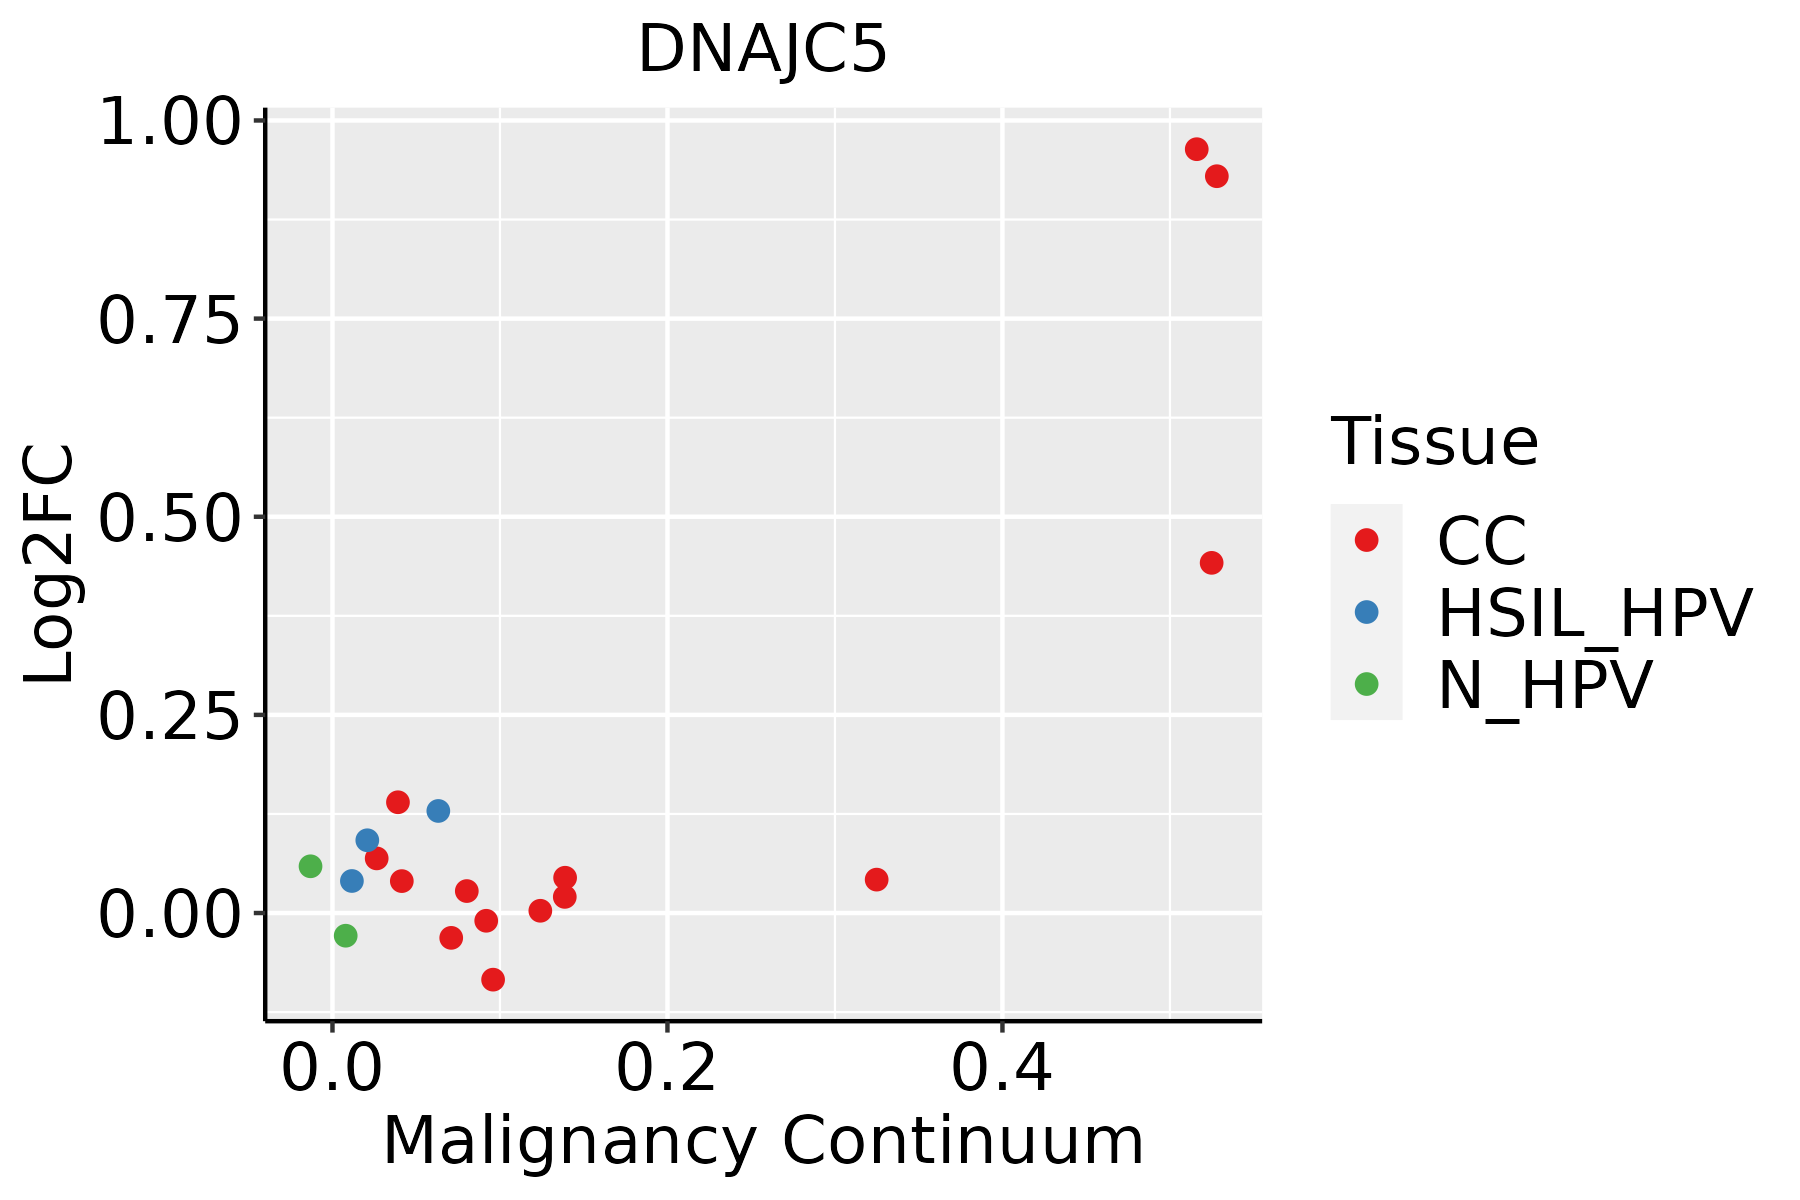 | CC: Cervix cancer |
| HSIL_HPV: HPV-infected high-grade squamous intraepithelial lesions | ||
| N_HPV: HPV-infected normal cervix | ||
| Colorectum (GSE201348) | 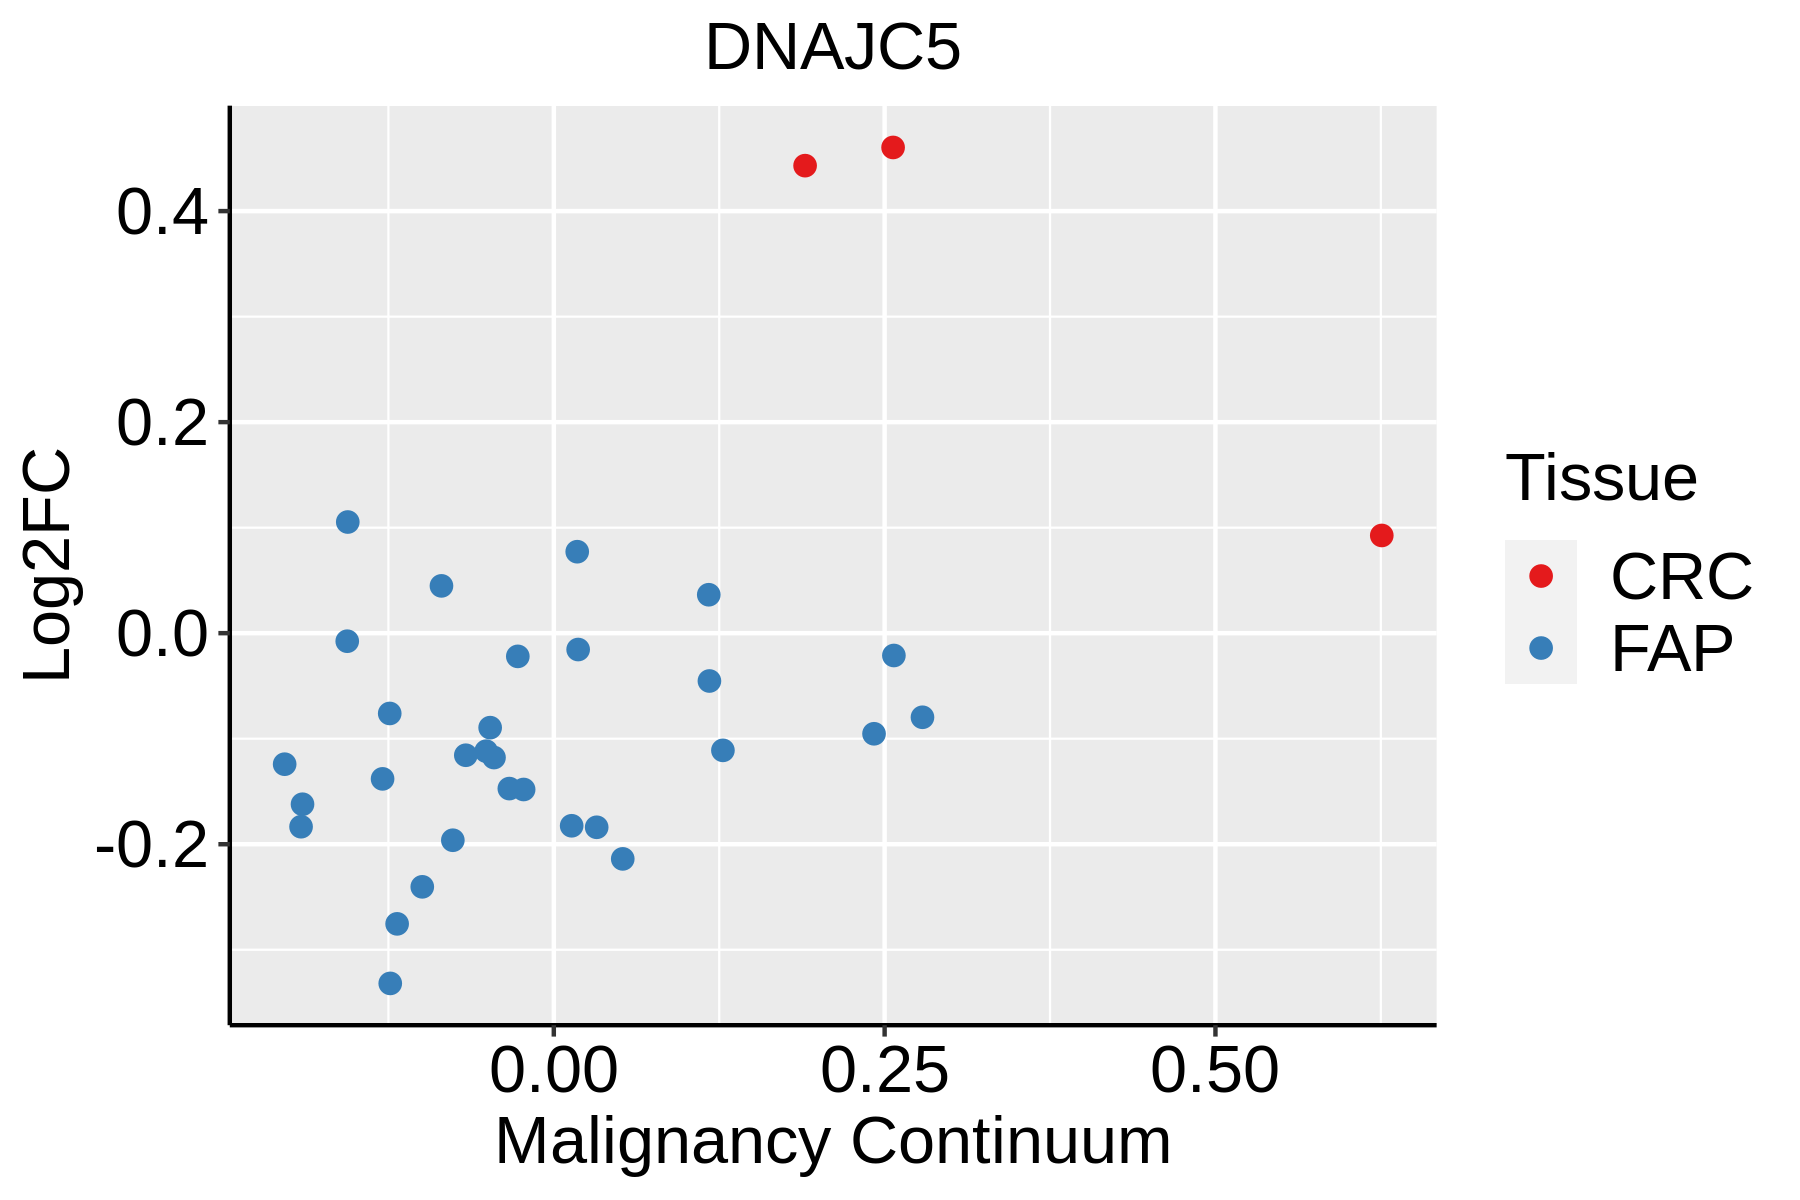 | FAP: Familial adenomatous polyposis |
| CRC: Colorectal cancer | ||
| Colorectum (HTA11) | 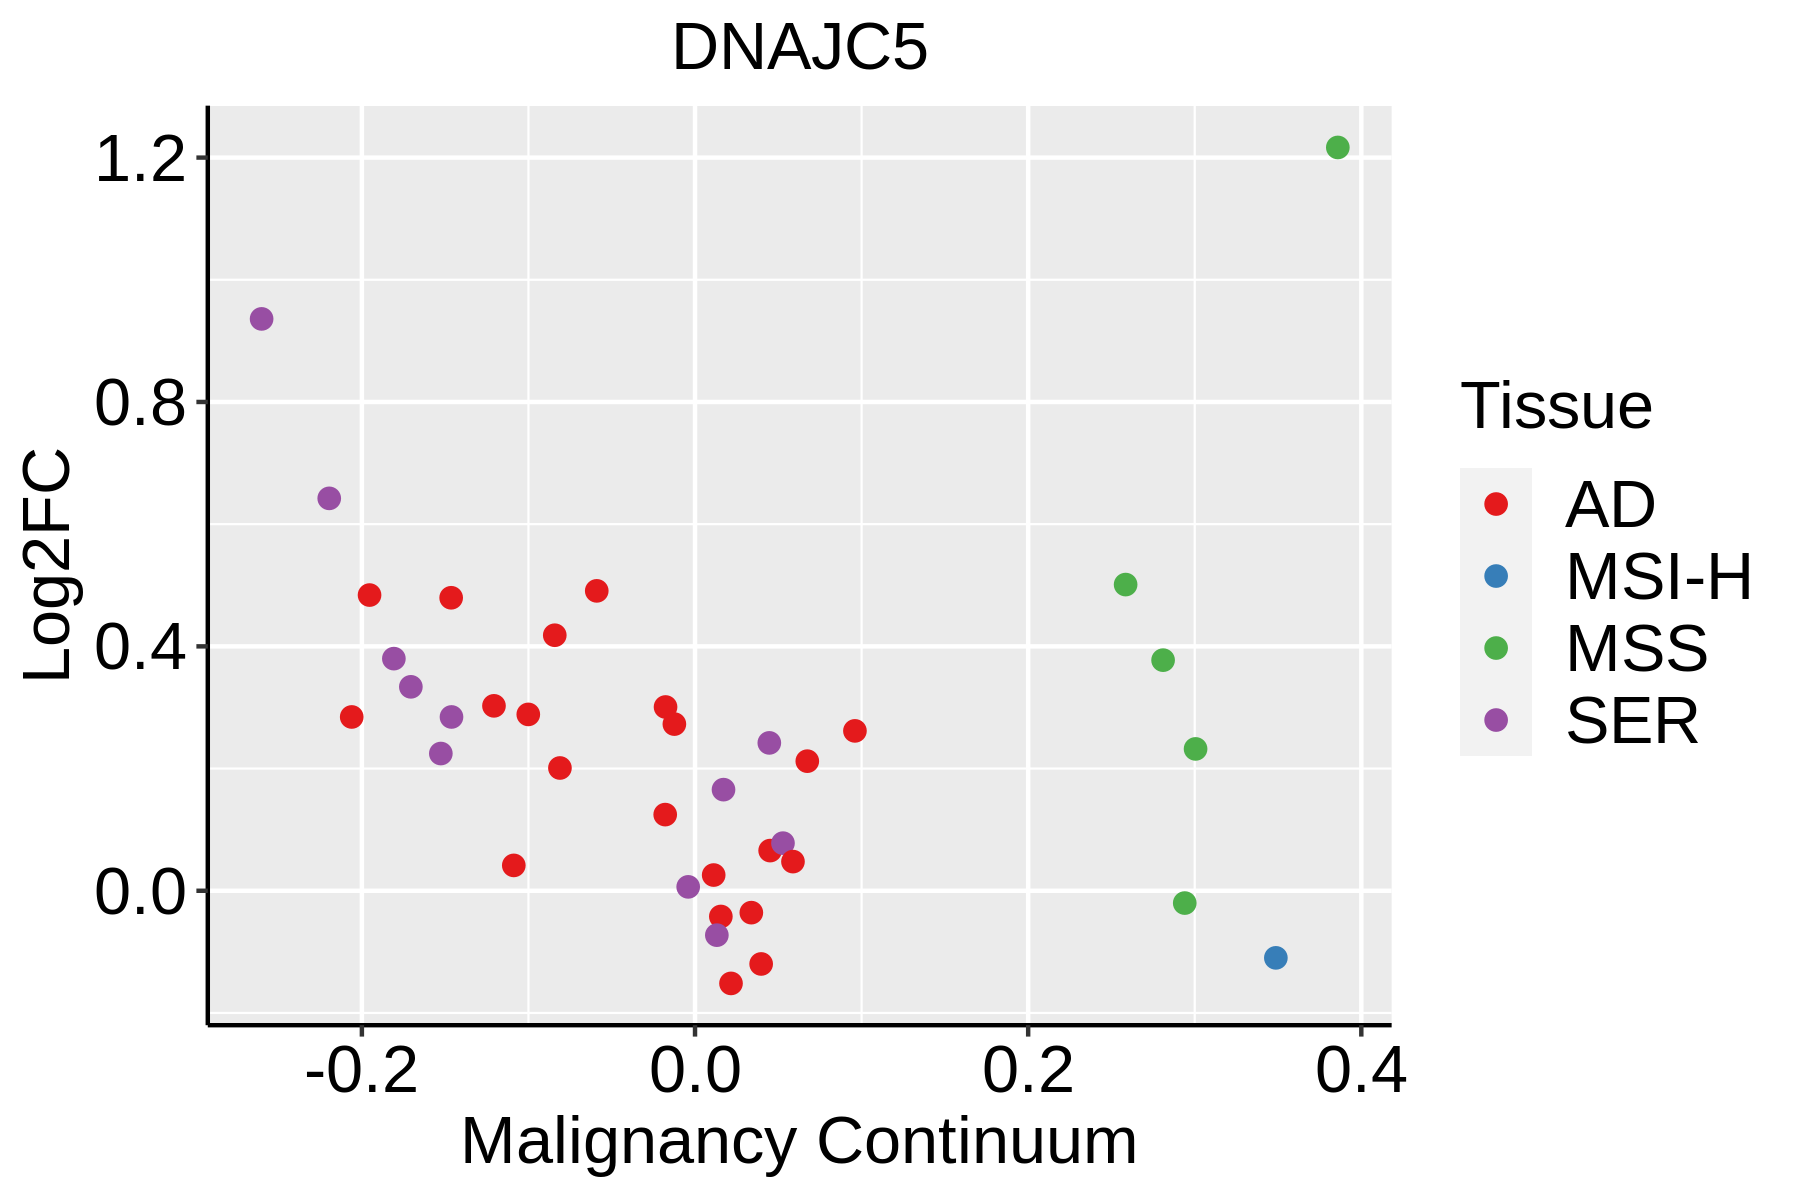 | AD: Adenomas |
| SER: Sessile serrated lesions | ||
| MSI-H: Microsatellite-high colorectal cancer | ||
| MSS: Microsatellite stable colorectal cancer | ||
| Esophagus |  | ESCC: Esophageal squamous cell carcinoma |
| HGIN: High-grade intraepithelial neoplasias | ||
| LGIN: Low-grade intraepithelial neoplasias | ||
| Liver | 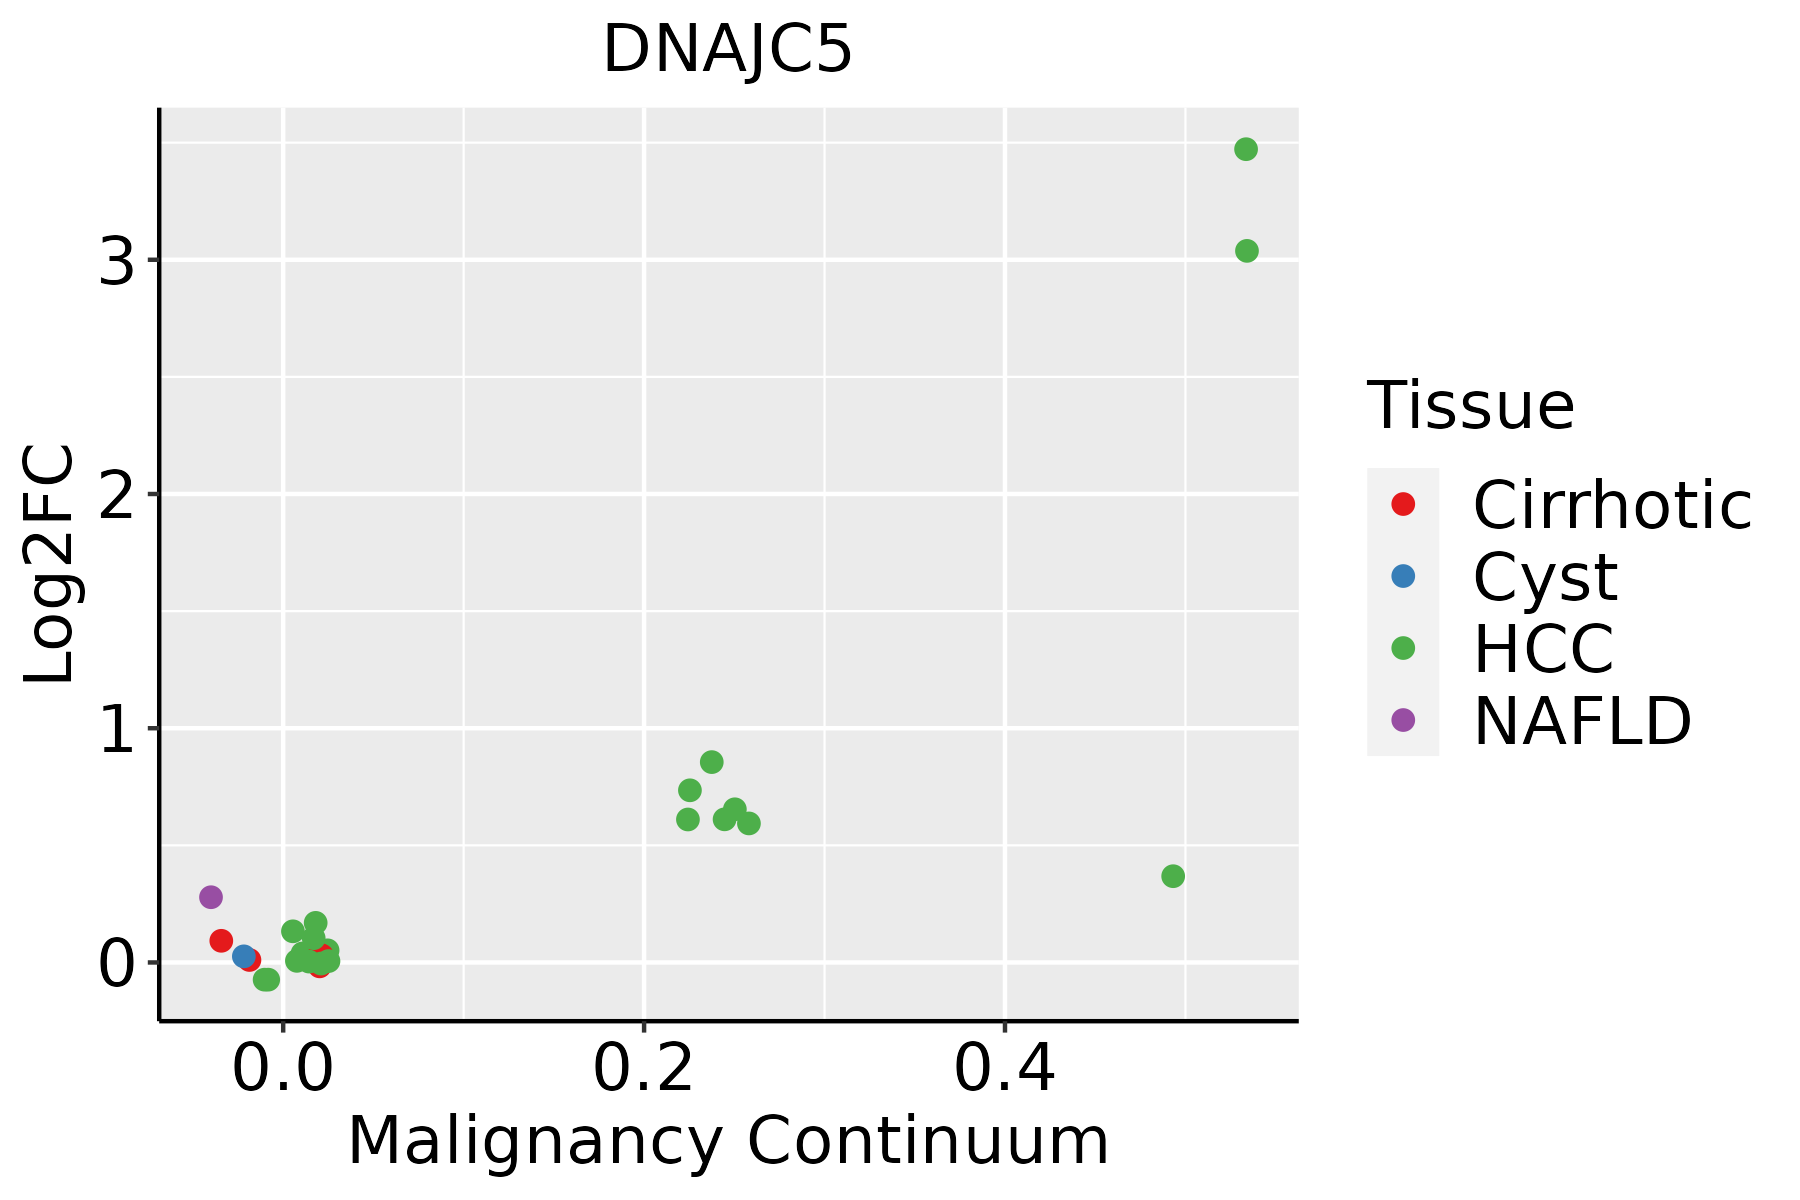 | HCC: Hepatocellular carcinoma |
| NAFLD: Non-alcoholic fatty liver disease | ||
| Lung |  | AAH: Atypical adenomatous hyperplasia |
| AIS: Adenocarcinoma in situ | ||
| IAC: Invasive lung adenocarcinoma | ||
| MIA: Minimally invasive adenocarcinoma | ||
| Oral Cavity |  | EOLP: Erosive Oral lichen planus |
| LP: leukoplakia | ||
| NEOLP: Non-erosive oral lichen planus | ||
| OSCC: Oral squamous cell carcinoma | ||
| Skin | 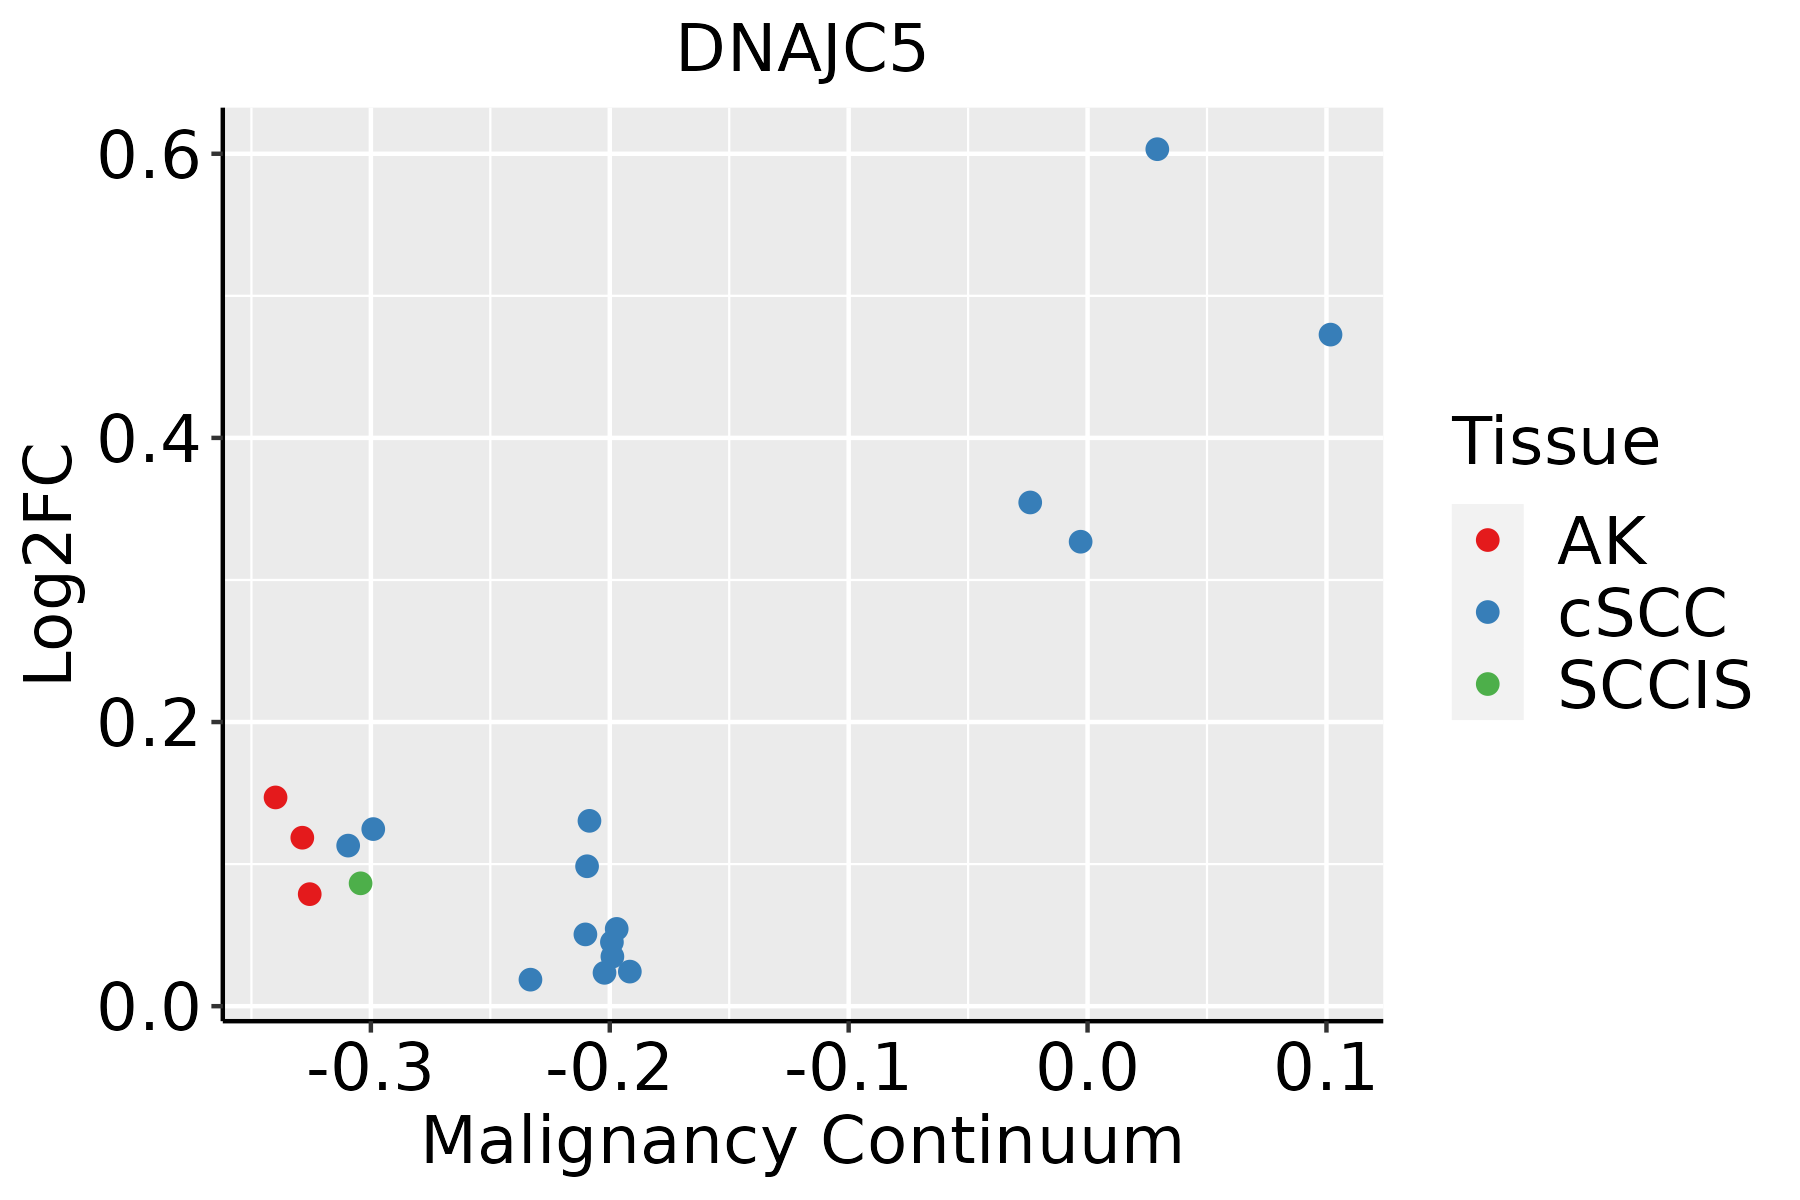 | AK: Actinic keratosis |
| cSCC: Cutaneous squamous cell carcinoma | ||
| SCCIS:squamous cell carcinoma in situ | ||
| Thyroid | 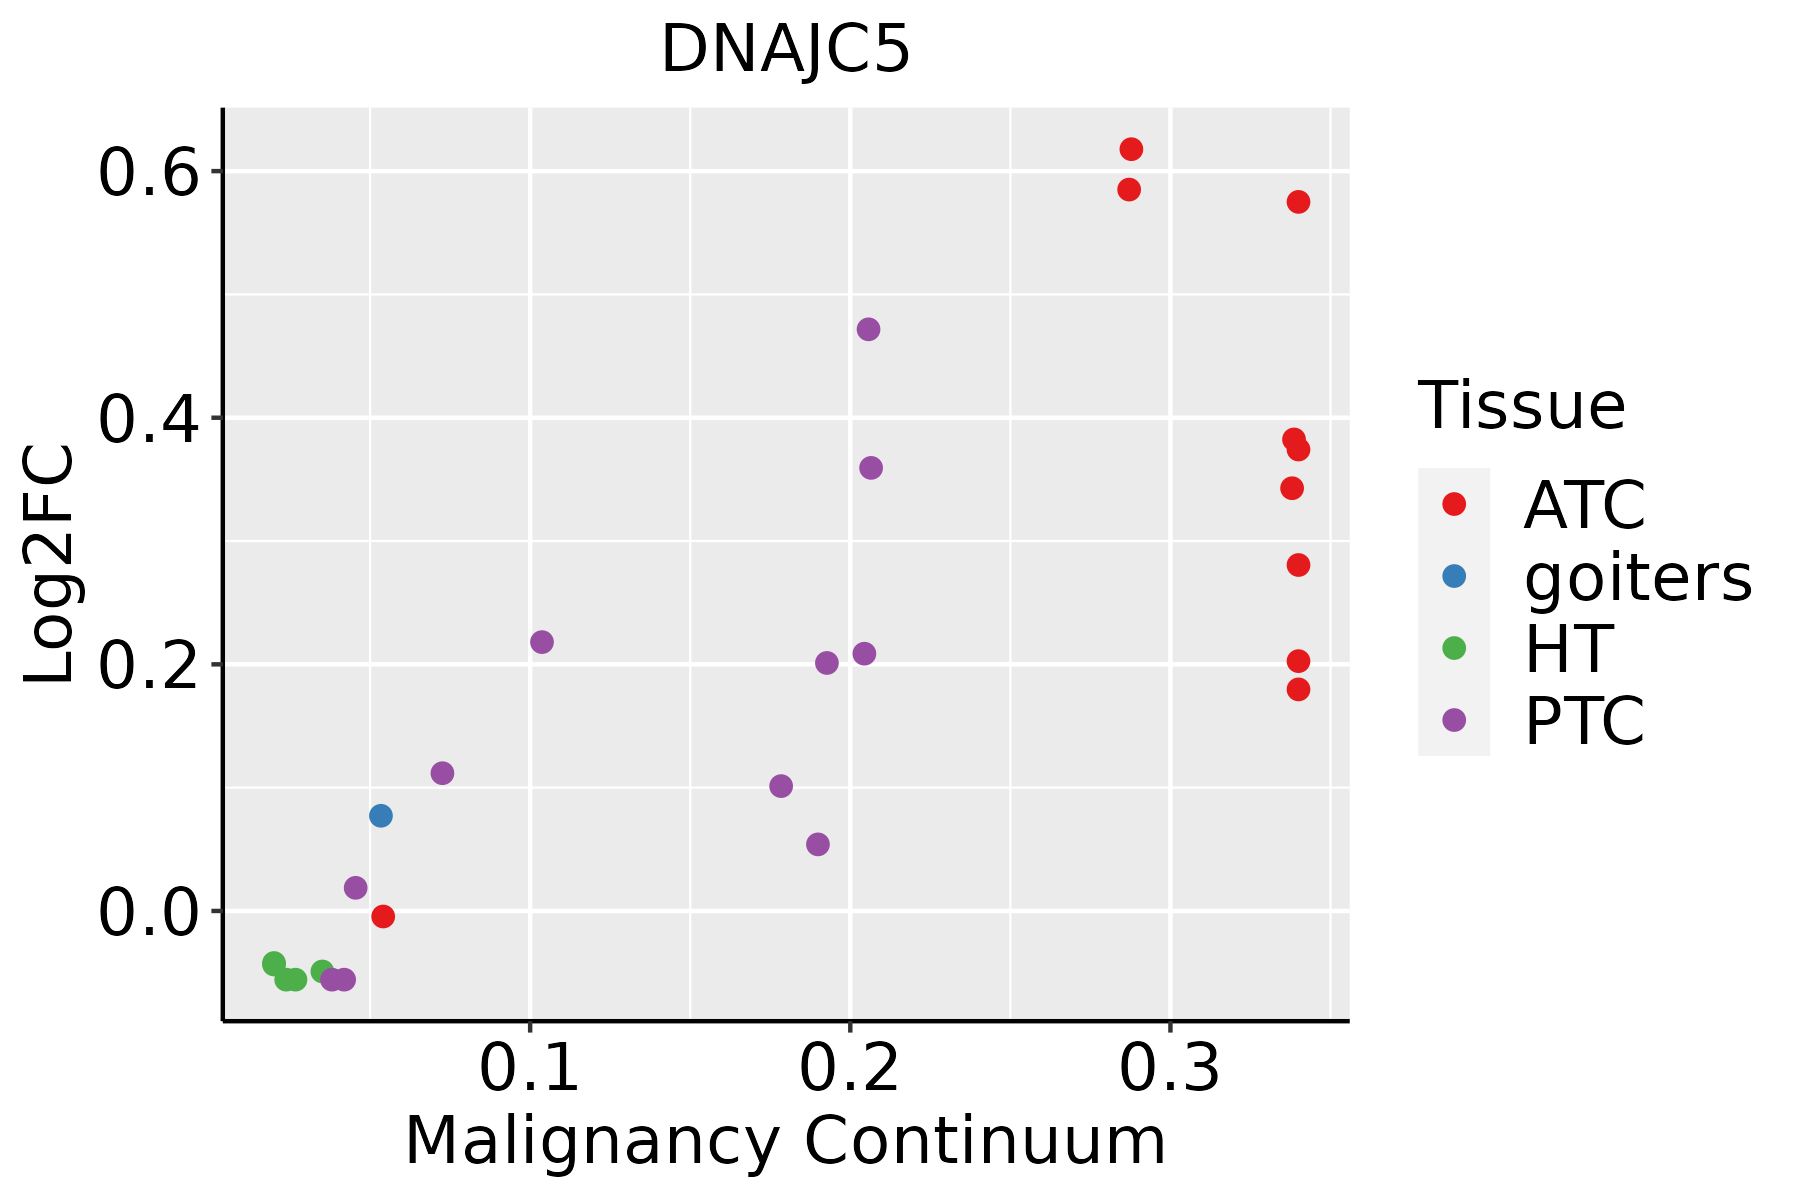 | ATC: Anaplastic thyroid cancer |
| HT: Hashimoto's thyroiditis | ||
| PTC: Papillary thyroid cancer |
| ∗log2FC in expression of this searched gene in stem-like cells from each diseased tissue sample relative to stem-like cells in normal samples in each tissue plotted against the malignancy continuum. Samples are colored based on if they are from different disease stage. |
Top |
Malignant transformation related pathway analysis |
| Find out the enriched GO biological processes and KEGG pathways involved in transition from healthy to precancer to cancer |
| Tissue | Disease Stage | Enriched GO biological Processes |
| Colorectum | AD |  |
| Colorectum | SER |  |
| Colorectum | MSS |  |
| Colorectum | MSI-H |  |
| Colorectum | FAP |  |
| ∗Top 15 enriched GO BP terms are showed in the bar plot of each disease state in each tissue. Each row represents a significant GO biological process which is colored according to the -log10(p.adjust). |
| Page: 1 2 3 4 5 6 7 8 9 |
| GO ID | Tissue | Disease Stage | Description | Gene Ratio | Bg Ratio | pvalue | p.adjust | Count |
| GO:006107712 | Liver | HCC | chaperone-mediated protein folding | 56/7958 | 67/18723 | 4.86e-12 | 2.14e-10 | 56 |
| GO:007099722 | Liver | HCC | neuron death | 202/7958 | 361/18723 | 1.44e-07 | 2.70e-06 | 202 |
| GO:190121412 | Liver | HCC | regulation of neuron death | 179/7958 | 319/18723 | 5.65e-07 | 9.01e-06 | 179 |
| GO:005140212 | Liver | HCC | neuron apoptotic process | 135/7958 | 246/18723 | 5.64e-05 | 5.26e-04 | 135 |
| GO:004352312 | Liver | HCC | regulation of neuron apoptotic process | 117/7958 | 212/18723 | 1.25e-04 | 1.03e-03 | 117 |
| GO:190121512 | Liver | HCC | negative regulation of neuron death | 113/7958 | 208/18723 | 3.68e-04 | 2.54e-03 | 113 |
| GO:00709978 | Lung | IAC | neuron death | 68/2061 | 361/18723 | 6.32e-06 | 2.32e-04 | 68 |
| GO:19012148 | Lung | IAC | regulation of neuron death | 58/2061 | 319/18723 | 8.28e-05 | 1.69e-03 | 58 |
| GO:00990034 | Lung | IAC | vesicle-mediated transport in synapse | 39/2061 | 200/18723 | 2.71e-04 | 4.49e-03 | 39 |
| GO:00514028 | Lung | IAC | neuron apoptotic process | 43/2061 | 246/18723 | 1.46e-03 | 1.57e-02 | 43 |
| GO:00995043 | Lung | IAC | synaptic vesicle cycle | 33/2061 | 181/18723 | 2.47e-03 | 2.33e-02 | 33 |
| GO:009900311 | Lung | AIS | vesicle-mediated transport in synapse | 42/1849 | 200/18723 | 1.87e-06 | 1.10e-04 | 42 |
| GO:009950411 | Lung | AIS | synaptic vesicle cycle | 36/1849 | 181/18723 | 3.42e-05 | 1.05e-03 | 36 |
| GO:007099713 | Lung | AIS | neuron death | 58/1849 | 361/18723 | 1.39e-04 | 3.05e-03 | 58 |
| GO:190121413 | Lung | AIS | regulation of neuron death | 50/1849 | 319/18723 | 6.90e-04 | 1.02e-02 | 50 |
| GO:000645718 | Oral cavity | OSCC | protein folding | 154/7305 | 212/18723 | 1.89e-23 | 4.60e-21 | 154 |
| GO:006107718 | Oral cavity | OSCC | chaperone-mediated protein folding | 54/7305 | 67/18723 | 3.73e-12 | 1.45e-10 | 54 |
| GO:007099720 | Oral cavity | OSCC | neuron death | 202/7305 | 361/18723 | 3.75e-11 | 1.23e-09 | 202 |
| GO:190121420 | Oral cavity | OSCC | regulation of neuron death | 174/7305 | 319/18723 | 1.09e-08 | 2.23e-07 | 174 |
| GO:005140217 | Oral cavity | OSCC | neuron apoptotic process | 134/7305 | 246/18723 | 5.65e-07 | 8.19e-06 | 134 |
| Page: 1 2 3 4 5 6 7 |
| Pathway ID | Tissue | Disease Stage | Description | Gene Ratio | Bg Ratio | pvalue | p.adjust | qvalue | Count |
| hsa0414120 | Cervix | CC | Protein processing in endoplasmic reticulum | 55/1267 | 174/8465 | 1.74e-08 | 2.68e-07 | 1.58e-07 | 55 |
| hsa04141110 | Cervix | CC | Protein processing in endoplasmic reticulum | 55/1267 | 174/8465 | 1.74e-08 | 2.68e-07 | 1.58e-07 | 55 |
| hsa04141 | Colorectum | AD | Protein processing in endoplasmic reticulum | 80/2092 | 174/8465 | 5.96e-10 | 1.25e-08 | 7.96e-09 | 80 |
| hsa041411 | Colorectum | AD | Protein processing in endoplasmic reticulum | 80/2092 | 174/8465 | 5.96e-10 | 1.25e-08 | 7.96e-09 | 80 |
| hsa041412 | Colorectum | SER | Protein processing in endoplasmic reticulum | 60/1580 | 174/8465 | 4.20e-07 | 7.33e-06 | 5.32e-06 | 60 |
| hsa041413 | Colorectum | SER | Protein processing in endoplasmic reticulum | 60/1580 | 174/8465 | 4.20e-07 | 7.33e-06 | 5.32e-06 | 60 |
| hsa041414 | Colorectum | MSS | Protein processing in endoplasmic reticulum | 75/1875 | 174/8465 | 3.78e-10 | 8.44e-09 | 5.17e-09 | 75 |
| hsa041415 | Colorectum | MSS | Protein processing in endoplasmic reticulum | 75/1875 | 174/8465 | 3.78e-10 | 8.44e-09 | 5.17e-09 | 75 |
| hsa041418 | Colorectum | FAP | Protein processing in endoplasmic reticulum | 50/1404 | 174/8465 | 3.64e-05 | 3.68e-04 | 2.24e-04 | 50 |
| hsa041419 | Colorectum | FAP | Protein processing in endoplasmic reticulum | 50/1404 | 174/8465 | 3.64e-05 | 3.68e-04 | 2.24e-04 | 50 |
| hsa04141211 | Esophagus | ESCC | Protein processing in endoplasmic reticulum | 147/4205 | 174/8465 | 3.29e-22 | 1.10e-19 | 5.64e-20 | 147 |
| hsa04141310 | Esophagus | ESCC | Protein processing in endoplasmic reticulum | 147/4205 | 174/8465 | 3.29e-22 | 1.10e-19 | 5.64e-20 | 147 |
| hsa0414122 | Liver | HCC | Protein processing in endoplasmic reticulum | 146/4020 | 174/8465 | 7.34e-24 | 2.46e-21 | 1.37e-21 | 146 |
| hsa0414132 | Liver | HCC | Protein processing in endoplasmic reticulum | 146/4020 | 174/8465 | 7.34e-24 | 2.46e-21 | 1.37e-21 | 146 |
| hsa0414116 | Lung | IAC | Protein processing in endoplasmic reticulum | 37/1053 | 174/8465 | 6.53e-04 | 5.73e-03 | 3.81e-03 | 37 |
| hsa0414117 | Lung | IAC | Protein processing in endoplasmic reticulum | 37/1053 | 174/8465 | 6.53e-04 | 5.73e-03 | 3.81e-03 | 37 |
| hsa0414123 | Lung | AIS | Protein processing in endoplasmic reticulum | 35/961 | 174/8465 | 4.88e-04 | 4.39e-03 | 2.81e-03 | 35 |
| hsa0414133 | Lung | AIS | Protein processing in endoplasmic reticulum | 35/961 | 174/8465 | 4.88e-04 | 4.39e-03 | 2.81e-03 | 35 |
| hsa0414130 | Oral cavity | OSCC | Protein processing in endoplasmic reticulum | 143/3704 | 174/8465 | 6.82e-26 | 2.28e-23 | 1.16e-23 | 143 |
| hsa04141113 | Oral cavity | OSCC | Protein processing in endoplasmic reticulum | 143/3704 | 174/8465 | 6.82e-26 | 2.28e-23 | 1.16e-23 | 143 |
| Page: 1 2 |
Top |
Cell-cell communication analysis |
| Identification of potential cell-cell interactions between two cell types and their ligand-receptor pairs for different disease states |
| Ligand | Receptor | LRpair | Pathway | Tissue | Disease Stage |
| Page: 1 |
Top |
Single-cell gene regulatory network inference analysis |
| Find out the significant the regulons (TFs) and the target genes of each regulon across cell types for different disease states |
| TF | Cell Type | Tissue | Disease Stage | Target Gene | RSS | Regulon Activity |
| ∗The dot plots of a searched regulon are shown for all cell subpopulations in each disease state of each tissue based on the regulon specific score inferred using pySCENIC and by calculating the average expression. |
| Page: 1 |
Top |
Somatic mutation of malignant transformation related genes |
| Annotation of somatic variants for genes involved in malignant transformation |
| Hugo Symbol | Variant Class | Variant Classification | dbSNP RS | HGVSc | HGVSp | HGVSp Short | SWISSPROT | BIOTYPE | SIFT | PolyPhen | Tumor Sample Barcode | Tissue | Histology | Sex | Age | Stage | Therapy Types | Drugs | Outcome |
| DNAJC5 | SNV | Missense_Mutation | c.112N>T | p.Leu38Phe | p.L38F | Q9H3Z4 | protein_coding | deleterious(0) | probably_damaging(0.984) | TCGA-BH-A18U-01 | Breast | breast invasive carcinoma | Female | >=65 | III/IV | Unknown | Unknown | SD | |
| DNAJC5 | deletion | Frame_Shift_Del | c.94_95delNN | p.Lys33ValfsTer25 | p.K33Vfs*25 | Q9H3Z4 | protein_coding | TCGA-AR-A254-01 | Breast | breast invasive carcinoma | Female | <65 | III/IV | Chemotherapy | paclitaxel | SD | |||
| DNAJC5 | SNV | Missense_Mutation | novel | c.340N>A | p.Gly114Ser | p.G114S | Q9H3Z4 | protein_coding | tolerated(0.22) | benign(0.341) | TCGA-2W-A8YY-01 | Cervix | cervical & endocervical cancer | Female | <65 | I/II | Chemotherapy | cisplatin | CR |
| DNAJC5 | SNV | Missense_Mutation | c.106C>T | p.Arg36Trp | p.R36W | Q9H3Z4 | protein_coding | deleterious(0) | probably_damaging(1) | TCGA-BI-A0VS-01 | Cervix | cervical & endocervical cancer | Female | <65 | I/II | Unknown | Unknown | SD | |
| DNAJC5 | SNV | Missense_Mutation | novel | c.128N>G | p.His43Arg | p.H43R | Q9H3Z4 | protein_coding | deleterious(0) | probably_damaging(0.993) | TCGA-CM-6674-01 | Colorectum | colon adenocarcinoma | Male | <65 | I/II | Unknown | Unknown | SD |
| DNAJC5 | SNV | Missense_Mutation | rs772453351 | c.193N>A | p.Ala65Thr | p.A65T | Q9H3Z4 | protein_coding | tolerated(0.23) | benign(0.015) | TCGA-D5-6928-01 | Colorectum | colon adenocarcinoma | Male | >=65 | I/II | Unknown | Unknown | SD |
| DNAJC5 | SNV | Missense_Mutation | novel | c.283N>A | p.Val95Met | p.V95M | Q9H3Z4 | protein_coding | deleterious(0.01) | probably_damaging(0.992) | TCGA-A5-A0G2-01 | Endometrium | uterine corpus endometrioid carcinoma | Female | <65 | III/IV | Unknown | Unknown | SD |
| DNAJC5 | SNV | Missense_Mutation | c.20G>A | p.Arg7His | p.R7H | Q9H3Z4 | protein_coding | deleterious(0.01) | probably_damaging(0.968) | TCGA-B5-A3FC-01 | Endometrium | uterine corpus endometrioid carcinoma | Female | <65 | I/II | Unknown | Unknown | SD | |
| DNAJC5 | SNV | Missense_Mutation | c.76N>A | p.Ala26Thr | p.A26T | Q9H3Z4 | protein_coding | deleterious(0.01) | possibly_damaging(0.595) | TCGA-EO-A22U-01 | Endometrium | uterine corpus endometrioid carcinoma | Female | >=65 | I/II | Unknown | Unknown | SD | |
| DNAJC5 | SNV | Missense_Mutation | c.473N>T | p.Gln158Leu | p.Q158L | Q9H3Z4 | protein_coding | deleterious(0) | benign(0.218) | TCGA-ED-A459-01 | Liver | liver hepatocellular carcinoma | Male | <65 | I/II | Ancillary | alvesin | CR |
| Page: 1 2 |
Top |
Related drugs of malignant transformation related genes |
| Identification of chemicals and drugs interact with genes involved in malignant transfromation |
| (DGIdb 4.0) |
| Entrez ID | Symbol | Category | Interaction Types | Drug Claim Name | Drug Name | PMIDs |
| Page: 1 |

Copyright 2023-Present -The University of Texas Health Science Center at Houston |