
|
|||||
|
 | |
| |
| |
| |
| |
| |
|
Gene: DLL1 |
Gene summary for DLL1 |
| Gene information | Species | Human | Gene symbol | DLL1 | Gene ID | 28514 |
| Gene name | delta like canonical Notch ligand 1 | |
| Gene Alias | DELTA1 | |
| Cytomap | 6q27 | |
| Gene Type | protein-coding | GO ID | GO:0001525 | UniProtAcc | O00548 |
Top |
Malignant transformation analysis |
| Identification of the aberrant gene expression in precancerous and cancerous lesions by comparing the gene expression of stem-like cells in diseased tissues with normal stem cells |
| Entrez ID | Symbol | Replicates | Species | Organ | Tissue | Adj P-value | Log2FC | Malignancy |
| 28514 | DLL1 | C04 | Human | Oral cavity | OSCC | 6.60e-16 | 1.01e+00 | 0.2633 |
| 28514 | DLL1 | C21 | Human | Oral cavity | OSCC | 4.92e-05 | 2.98e-01 | 0.2678 |
| 28514 | DLL1 | C30 | Human | Oral cavity | OSCC | 2.34e-16 | 8.14e-01 | 0.3055 |
| 28514 | DLL1 | C43 | Human | Oral cavity | OSCC | 1.55e-05 | 2.31e-01 | 0.1704 |
| 28514 | DLL1 | C51 | Human | Oral cavity | OSCC | 1.89e-08 | 5.93e-01 | 0.2674 |
| 28514 | DLL1 | C06 | Human | Oral cavity | OSCC | 8.45e-07 | 1.59e+00 | 0.2699 |
| 28514 | DLL1 | C09 | Human | Oral cavity | OSCC | 7.24e-05 | 3.63e-01 | 0.1431 |
| 28514 | DLL1 | LP17 | Human | Oral cavity | LP | 2.23e-02 | 4.37e-01 | 0.2349 |
| 28514 | DLL1 | SYSMH2 | Human | Oral cavity | OSCC | 4.25e-04 | 3.61e-01 | 0.2326 |
| 28514 | DLL1 | SYSMH3 | Human | Oral cavity | OSCC | 2.05e-22 | 5.93e-01 | 0.2442 |
| 28514 | DLL1 | P1_cSCC | Human | Skin | cSCC | 3.49e-12 | 6.68e-01 | 0.0292 |
| 28514 | DLL1 | P2_cSCC | Human | Skin | cSCC | 3.56e-04 | 2.43e-01 | -0.024 |
| 28514 | DLL1 | P4_cSCC | Human | Skin | cSCC | 3.41e-02 | 2.03e-01 | -0.00290000000000005 |
| 28514 | DLL1 | P10_cSCC | Human | Skin | cSCC | 6.09e-10 | 5.06e-01 | 0.1017 |
| 28514 | DLL1 | cSCC_p11 | Human | Skin | cSCC | 6.18e-03 | 1.84e-01 | -0.2102 |
| 28514 | DLL1 | cSCC_p7 | Human | Skin | cSCC | 4.55e-02 | 1.46e-01 | -0.2332 |
| Page: 1 |
| Tissue | Expression Dynamics | Abbreviation |
| Oral Cavity |  | EOLP: Erosive Oral lichen planus |
| LP: leukoplakia | ||
| NEOLP: Non-erosive oral lichen planus | ||
| OSCC: Oral squamous cell carcinoma | ||
| Skin | 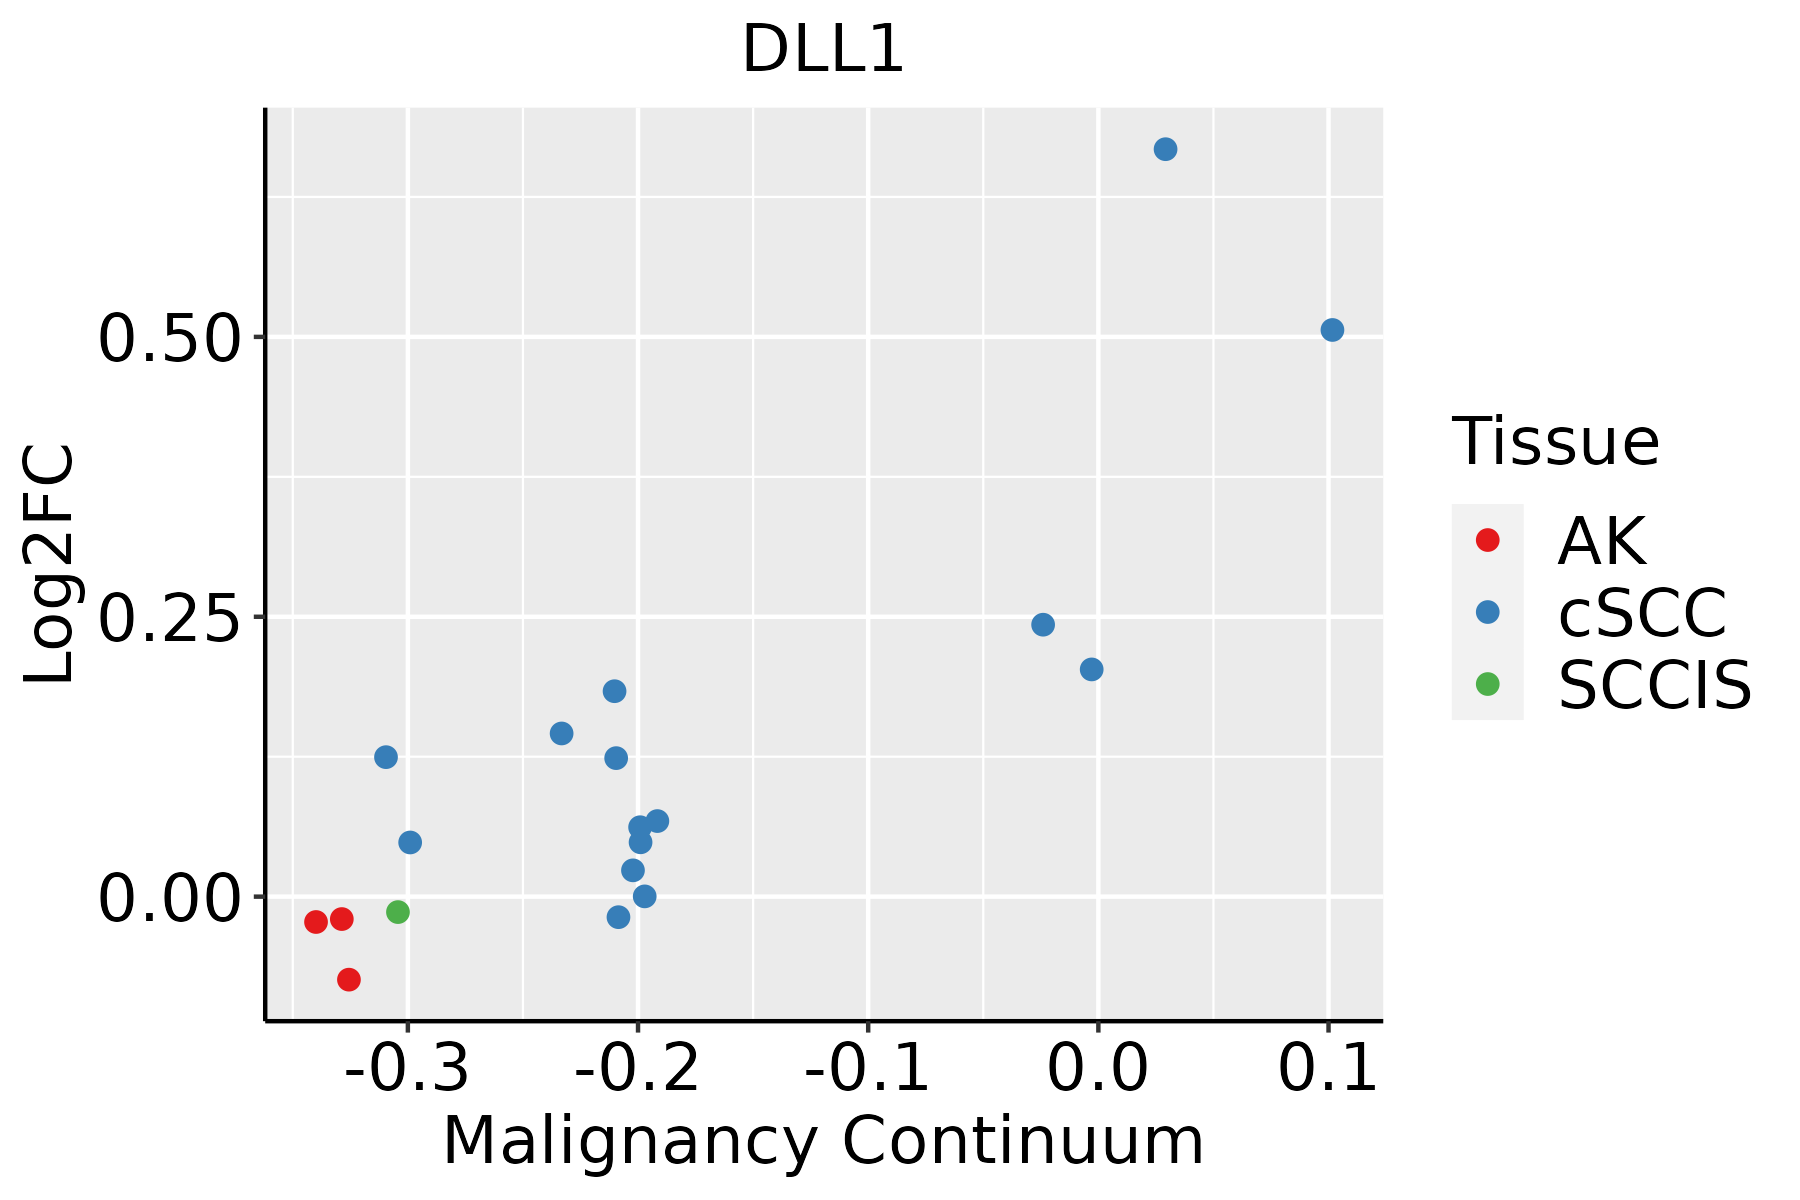 | AK: Actinic keratosis |
| cSCC: Cutaneous squamous cell carcinoma | ||
| SCCIS:squamous cell carcinoma in situ |
| ∗log2FC in expression of this searched gene in stem-like cells from each diseased tissue sample relative to stem-like cells in normal samples in each tissue plotted against the malignancy continuum. Samples are colored based on if they are from different disease stage. |
Top |
Malignant transformation related pathway analysis |
| Find out the enriched GO biological processes and KEGG pathways involved in transition from healthy to precancer to cancer |
| Tissue | Disease Stage | Enriched GO biological Processes |
| Colorectum | AD |  |
| Colorectum | SER |  |
| Colorectum | MSS |  |
| Colorectum | MSI-H |  |
| Colorectum | FAP |  |
| ∗Top 15 enriched GO BP terms are showed in the bar plot of each disease state in each tissue. Each row represents a significant GO biological process which is colored according to the -log10(p.adjust). |
| Page: 1 2 3 4 5 6 7 8 9 |
| GO ID | Tissue | Disease Stage | Description | Gene Ratio | Bg Ratio | pvalue | p.adjust | Count |
| GO:004206322 | Skin | cSCC | gliogenesis | 103/4864 | 301/18723 | 8.48e-04 | 5.85e-03 | 103 |
| GO:004544513 | Skin | cSCC | myoblast differentiation | 35/4864 | 84/18723 | 1.23e-03 | 7.97e-03 | 35 |
| GO:004568215 | Skin | cSCC | regulation of epidermis development | 28/4864 | 65/18723 | 2.02e-03 | 1.20e-02 | 28 |
| GO:190370626 | Skin | cSCC | regulation of hemopoiesis | 120/4864 | 367/18723 | 2.23e-03 | 1.32e-02 | 120 |
| GO:001000122 | Skin | cSCC | glial cell differentiation | 78/4864 | 225/18723 | 2.27e-03 | 1.33e-02 | 78 |
| GO:004563727 | Skin | cSCC | regulation of myeloid cell differentiation | 73/4864 | 210/18723 | 2.84e-03 | 1.59e-02 | 73 |
| GO:005076722 | Skin | cSCC | regulation of neurogenesis | 118/4864 | 364/18723 | 3.32e-03 | 1.81e-02 | 118 |
| GO:003010024 | Skin | cSCC | regulation of endocytosis | 72/4864 | 211/18723 | 5.06e-03 | 2.56e-02 | 72 |
| GO:000721922 | Skin | cSCC | Notch signaling pathway | 60/4864 | 172/18723 | 5.82e-03 | 2.87e-02 | 60 |
| GO:000315824 | Skin | cSCC | endothelium development | 49/4864 | 136/18723 | 6.00e-03 | 2.95e-02 | 49 |
| GO:00513026 | Skin | cSCC | regulation of cell division | 61/4864 | 177/18723 | 7.34e-03 | 3.47e-02 | 61 |
| GO:004560414 | Skin | cSCC | regulation of epidermal cell differentiation | 24/4864 | 58/18723 | 7.50e-03 | 3.52e-02 | 24 |
| GO:004592719 | Skin | cSCC | positive regulation of growth | 85/4864 | 259/18723 | 8.03e-03 | 3.73e-02 | 85 |
| GO:004580725 | Skin | cSCC | positive regulation of endocytosis | 37/4864 | 100/18723 | 9.75e-03 | 4.32e-02 | 37 |
| Page: 1 2 3 4 |
| Pathway ID | Tissue | Disease Stage | Description | Gene Ratio | Bg Ratio | pvalue | p.adjust | qvalue | Count |
| hsa043305 | Oral cavity | OSCC | Notch signaling pathway | 44/3704 | 62/8465 | 1.26e-05 | 5.55e-05 | 2.83e-05 | 44 |
| hsa015226 | Oral cavity | OSCC | Endocrine resistance | 63/3704 | 98/8465 | 3.09e-05 | 1.31e-04 | 6.67e-05 | 63 |
| hsa0433012 | Oral cavity | OSCC | Notch signaling pathway | 44/3704 | 62/8465 | 1.26e-05 | 5.55e-05 | 2.83e-05 | 44 |
| hsa0152214 | Oral cavity | OSCC | Endocrine resistance | 63/3704 | 98/8465 | 3.09e-05 | 1.31e-04 | 6.67e-05 | 63 |
| Page: 1 |
Top |
Cell-cell communication analysis |
| Identification of potential cell-cell interactions between two cell types and their ligand-receptor pairs for different disease states |
| Ligand | Receptor | LRpair | Pathway | Tissue | Disease Stage |
| DLL1 | NOTCH2 | DLL1_NOTCH2 | NOTCH | Breast | ADJ |
| DLL1 | NOTCH1 | DLL1_NOTCH1 | NOTCH | CRC | CRC |
| DLL1 | NOTCH3 | DLL1_NOTCH3 | NOTCH | CRC | CRC |
| DLL1 | NOTCH2 | DLL1_NOTCH2 | NOTCH | CRC | CRC |
| DLL1 | NOTCH1 | DLL1_NOTCH1 | NOTCH | CRC | MSS |
| DLL1 | NOTCH3 | DLL1_NOTCH3 | NOTCH | CRC | MSS |
| DLL1 | NOTCH4 | DLL1_NOTCH4 | NOTCH | CRC | MSS |
| DLL1 | NOTCH1 | DLL1_NOTCH1 | NOTCH | HNSCC | ADJ |
| DLL1 | NOTCH3 | DLL1_NOTCH3 | NOTCH | HNSCC | ADJ |
| DLL1 | NOTCH4 | DLL1_NOTCH4 | NOTCH | HNSCC | ADJ |
| DLL1 | NOTCH2 | DLL1_NOTCH2 | NOTCH | HNSCC | ADJ |
| DLL1 | NOTCH1 | DLL1_NOTCH1 | NOTCH | HNSCC | OSCC |
| DLL1 | NOTCH4 | DLL1_NOTCH4 | NOTCH | HNSCC | OSCC |
| DLL1 | NOTCH2 | DLL1_NOTCH2 | NOTCH | HNSCC | OSCC |
| DLL1 | NOTCH1 | DLL1_NOTCH1 | NOTCH | HNSCC | Precancer |
| DLL1 | NOTCH3 | DLL1_NOTCH3 | NOTCH | HNSCC | Precancer |
| DLL1 | NOTCH4 | DLL1_NOTCH4 | NOTCH | HNSCC | Precancer |
| DLL1 | NOTCH2 | DLL1_NOTCH2 | NOTCH | HNSCC | Precancer |
| DLL1 | NOTCH3 | DLL1_NOTCH3 | NOTCH | Lung | AAH |
| DLL1 | NOTCH4 | DLL1_NOTCH4 | NOTCH | Lung | AAH |
| Page: 1 2 3 |
Top |
Single-cell gene regulatory network inference analysis |
| Find out the significant the regulons (TFs) and the target genes of each regulon across cell types for different disease states |
| TF | Cell Type | Tissue | Disease Stage | Target Gene | RSS | Regulon Activity |
| ∗The dot plots of a searched regulon are shown for all cell subpopulations in each disease state of each tissue based on the regulon specific score inferred using pySCENIC and by calculating the average expression. |
| Page: 1 |
Top |
Somatic mutation of malignant transformation related genes |
| Annotation of somatic variants for genes involved in malignant transformation |
| Hugo Symbol | Variant Class | Variant Classification | dbSNP RS | HGVSc | HGVSp | HGVSp Short | SWISSPROT | BIOTYPE | SIFT | PolyPhen | Tumor Sample Barcode | Tissue | Histology | Sex | Age | Stage | Therapy Types | Drugs | Outcome |
| DLL1 | SNV | Missense_Mutation | rs372640222 | c.1156N>A | p.Asp386Asn | p.D386N | O00548 | protein_coding | tolerated(0.78) | benign(0.16) | TCGA-A2-A0T1-01 | Breast | breast invasive carcinoma | Female | <65 | III/IV | Targeted Molecular therapy | herceptin | SD |
| DLL1 | SNV | Missense_Mutation | rs200861263 | c.1747N>C | p.Cys583Arg | p.C583R | O00548 | protein_coding | tolerated(0.45) | benign(0.017) | TCGA-A2-A0T5-01 | Breast | breast invasive carcinoma | Female | <65 | I/II | Unspecific | Taxotere | SD |
| DLL1 | SNV | Missense_Mutation | novel | c.1484N>G | p.Thr495Ser | p.T495S | O00548 | protein_coding | tolerated(0.06) | probably_damaging(0.999) | TCGA-A2-A3XZ-01 | Breast | breast invasive carcinoma | Female | <65 | I/II | Chemotherapy | carboplatin | CR |
| DLL1 | SNV | Missense_Mutation | novel | c.1036C>A | p.Leu346Ile | p.L346I | O00548 | protein_coding | tolerated(0.12) | benign(0.173) | TCGA-AN-A046-01 | Breast | breast invasive carcinoma | Female | >=65 | I/II | Unknown | Unknown | SD |
| DLL1 | SNV | Missense_Mutation | novel | c.494N>A | p.Ser165Asn | p.S165N | O00548 | protein_coding | tolerated(0.08) | benign(0.428) | TCGA-B6-A400-01 | Breast | breast invasive carcinoma | Female | <65 | III/IV | Unknown | Unknown | SD |
| DLL1 | SNV | Missense_Mutation | c.140N>A | p.Gly47Glu | p.G47E | O00548 | protein_coding | tolerated(0.39) | benign(0.037) | TCGA-D8-A1J8-01 | Breast | breast invasive carcinoma | Female | >=65 | I/II | Hormone Therapy | nolvadex | SD | |
| DLL1 | SNV | Missense_Mutation | rs370005717 | c.1793N>A | p.Arg598His | p.R598H | O00548 | protein_coding | deleterious(0.01) | probably_damaging(0.999) | TCGA-D8-A1JG-01 | Breast | breast invasive carcinoma | Female | <65 | I/II | Chemotherapy | doxorubicin | SD |
| DLL1 | SNV | Missense_Mutation | c.1792N>A | p.Arg598Ser | p.R598S | O00548 | protein_coding | deleterious(0.01) | probably_damaging(0.999) | TCGA-E2-A15D-01 | Breast | breast invasive carcinoma | Female | <65 | I/II | Hormone Therapy | tamoxiphen | SD | |
| DLL1 | insertion | In_Frame_Ins | novel | c.2151_2152insACAAACACTGCCTTTATTGTCCTTTTTGATACGAAGATG | p.Cys717_Val718insThrAsnThrAlaPheIleValLeuPheAspThrLysMet | p.C717_V718insTNTAFIVLFDTKM | O00548 | protein_coding | TCGA-A2-A0CT-01 | Breast | breast invasive carcinoma | Female | >=65 | I/II | Chemotherapy | cytoxan | SD | ||
| DLL1 | insertion | Frame_Shift_Ins | novel | c.2096_2097insCCAGGATGGAAAGAGGGCGACCG | p.Lys700GlnfsTer28 | p.K700Qfs*28 | O00548 | protein_coding | TCGA-BH-A0DS-01 | Breast | breast invasive carcinoma | Female | >=65 | III/IV | Chemotherapy | cyclophosphamide | SD |
| Page: 1 2 3 4 5 6 7 8 9 10 11 |
Top |
Related drugs of malignant transformation related genes |
| Identification of chemicals and drugs interact with genes involved in malignant transfromation |
| (DGIdb 4.0) |
| Entrez ID | Symbol | Category | Interaction Types | Drug Claim Name | Drug Name | PMIDs |
| Page: 1 |

Copyright 2023-Present -The University of Texas Health Science Center at Houston |