| Tissue | Expression Dynamics | Abbreviation |
| Cervix |  | CC: Cervix cancer |
| HSIL_HPV: HPV-infected high-grade squamous intraepithelial lesions |
| N_HPV: HPV-infected normal cervix |
| Colorectum (GSE201348) |  | FAP: Familial adenomatous polyposis |
| CRC: Colorectal cancer |
| Colorectum (HTA11) |  | AD: Adenomas |
| SER: Sessile serrated lesions |
| MSI-H: Microsatellite-high colorectal cancer |
| MSS: Microsatellite stable colorectal cancer |
| Endometrium |  | AEH: Atypical endometrial hyperplasia |
| EEC: Endometrioid Cancer |
| Esophagus |  | ESCC: Esophageal squamous cell carcinoma |
| HGIN: High-grade intraepithelial neoplasias |
| LGIN: Low-grade intraepithelial neoplasias |
| GC |  | CAG: Chronic atrophic gastritis |
| CAG with IM: Chronic atrophic gastritis with intestinal metaplasia |
| CSG: Chronic superficial gastritis |
| GC: Gastric cancer |
| SIM: Severe intestinal metaplasia |
| WIM: Wild intestinal metaplasia |
| Liver |  | HCC: Hepatocellular carcinoma |
| NAFLD: Non-alcoholic fatty liver disease |
| Lung | 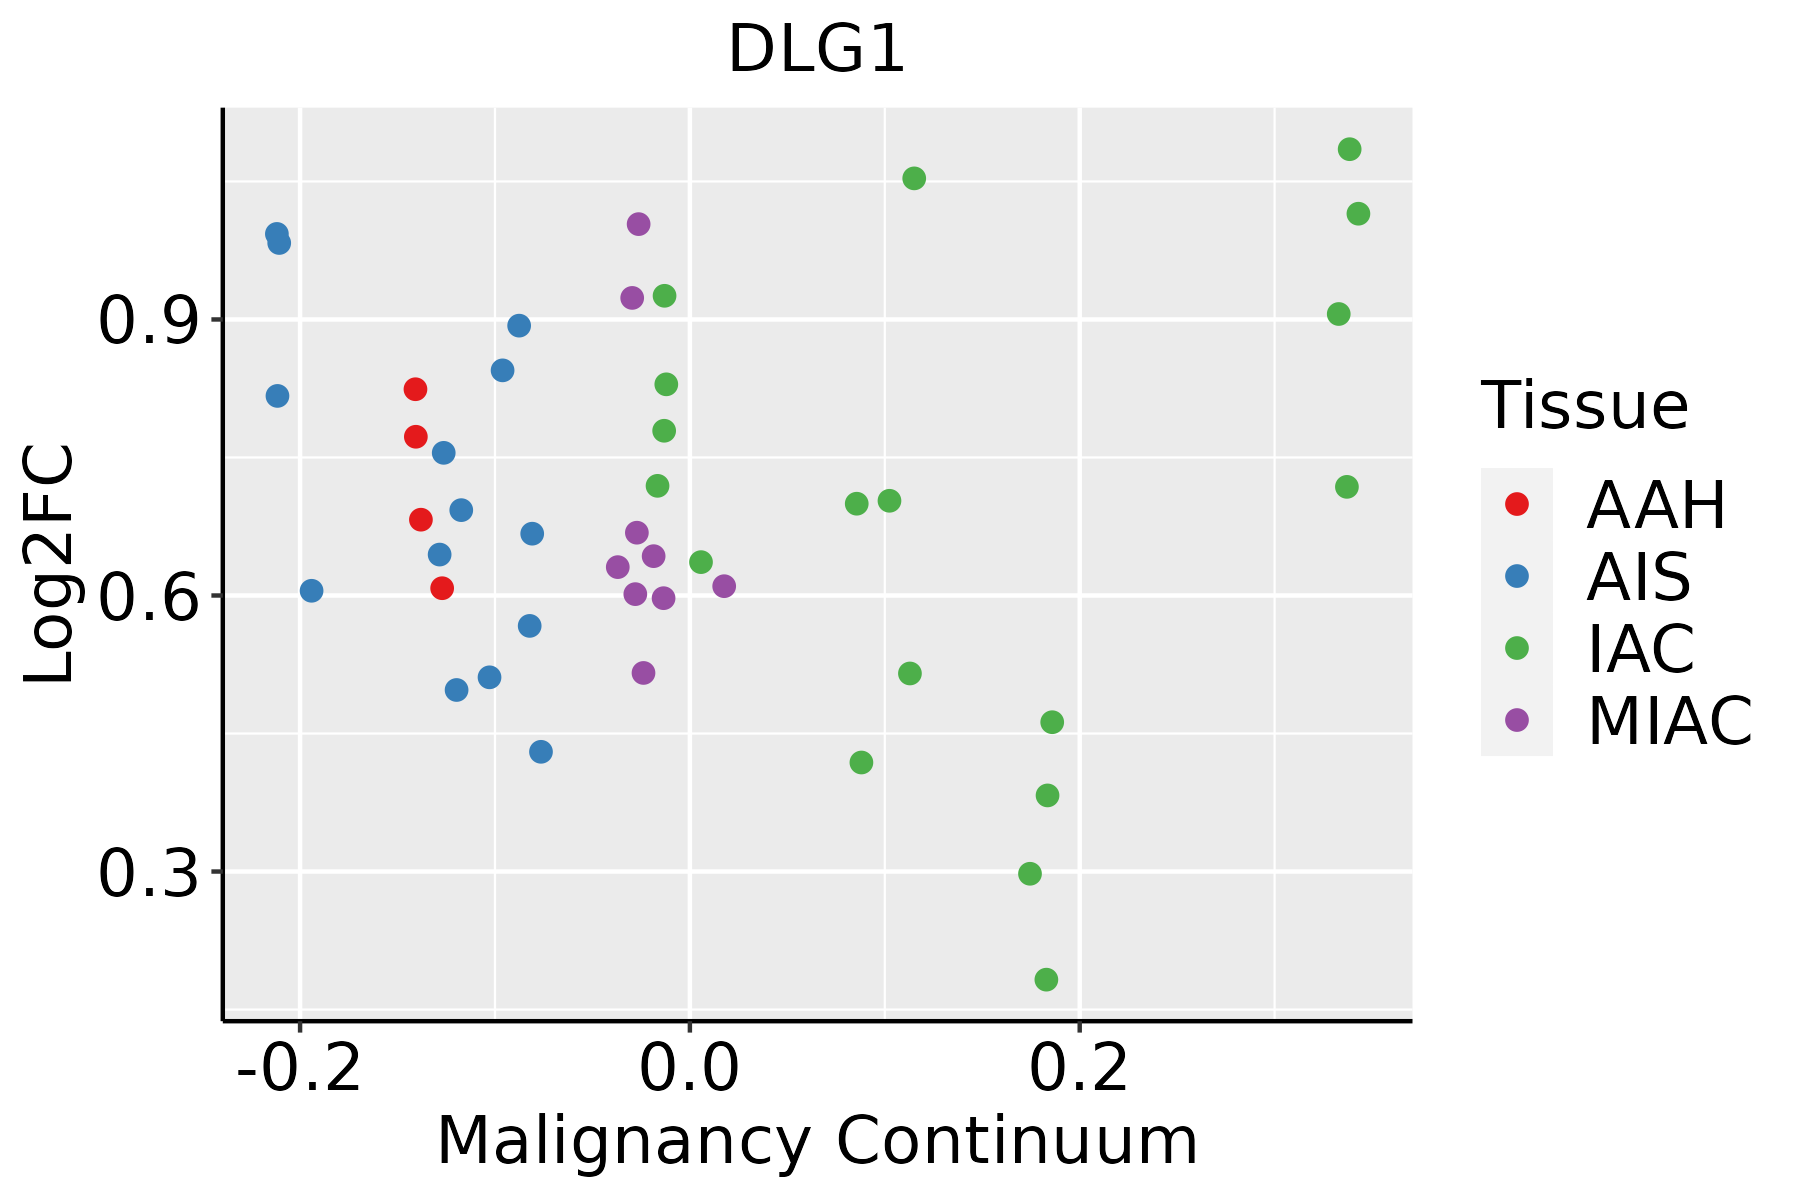 | AAH: Atypical adenomatous hyperplasia |
| AIS: Adenocarcinoma in situ |
| IAC: Invasive lung adenocarcinoma |
| MIA: Minimally invasive adenocarcinoma |
| Oral Cavity | 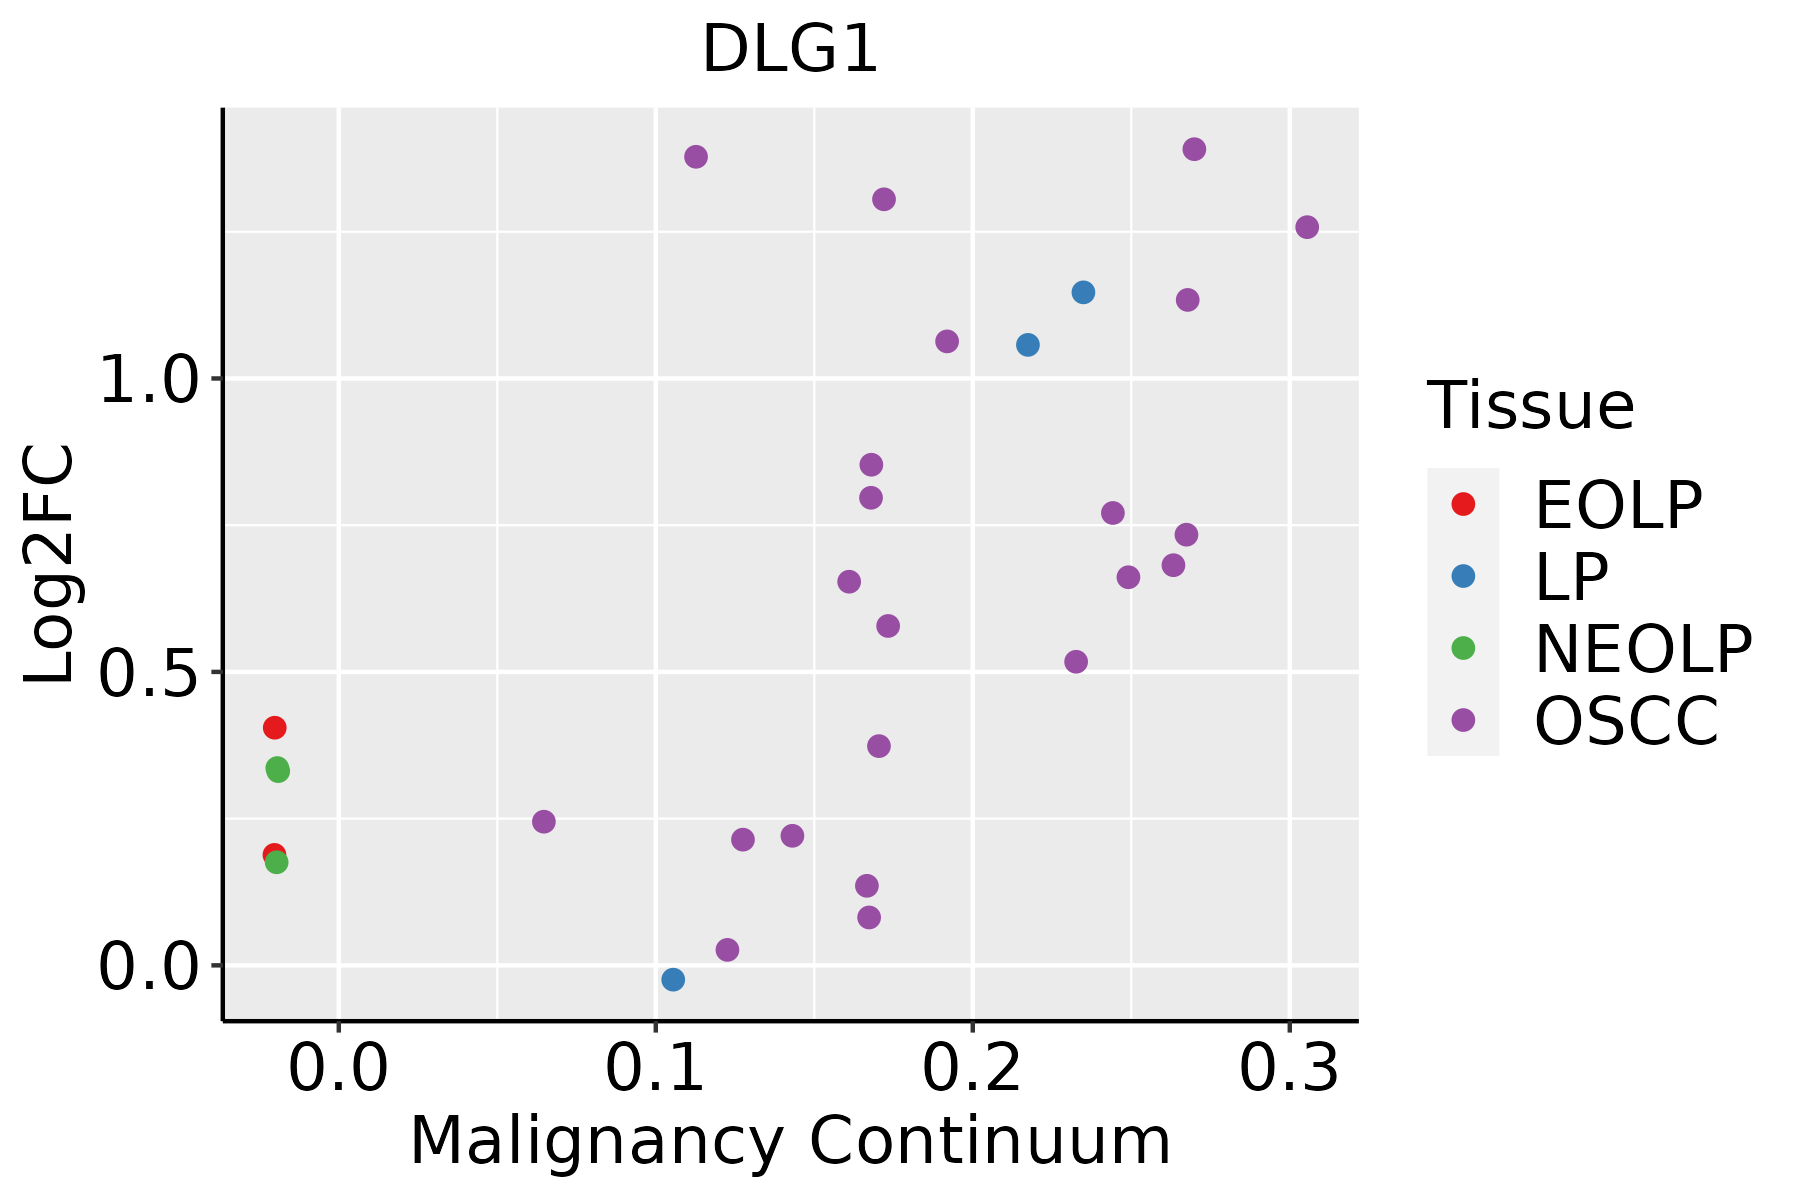 | EOLP: Erosive Oral lichen planus |
| LP: leukoplakia |
| NEOLP: Non-erosive oral lichen planus |
| OSCC: Oral squamous cell carcinoma |
| Prostate | 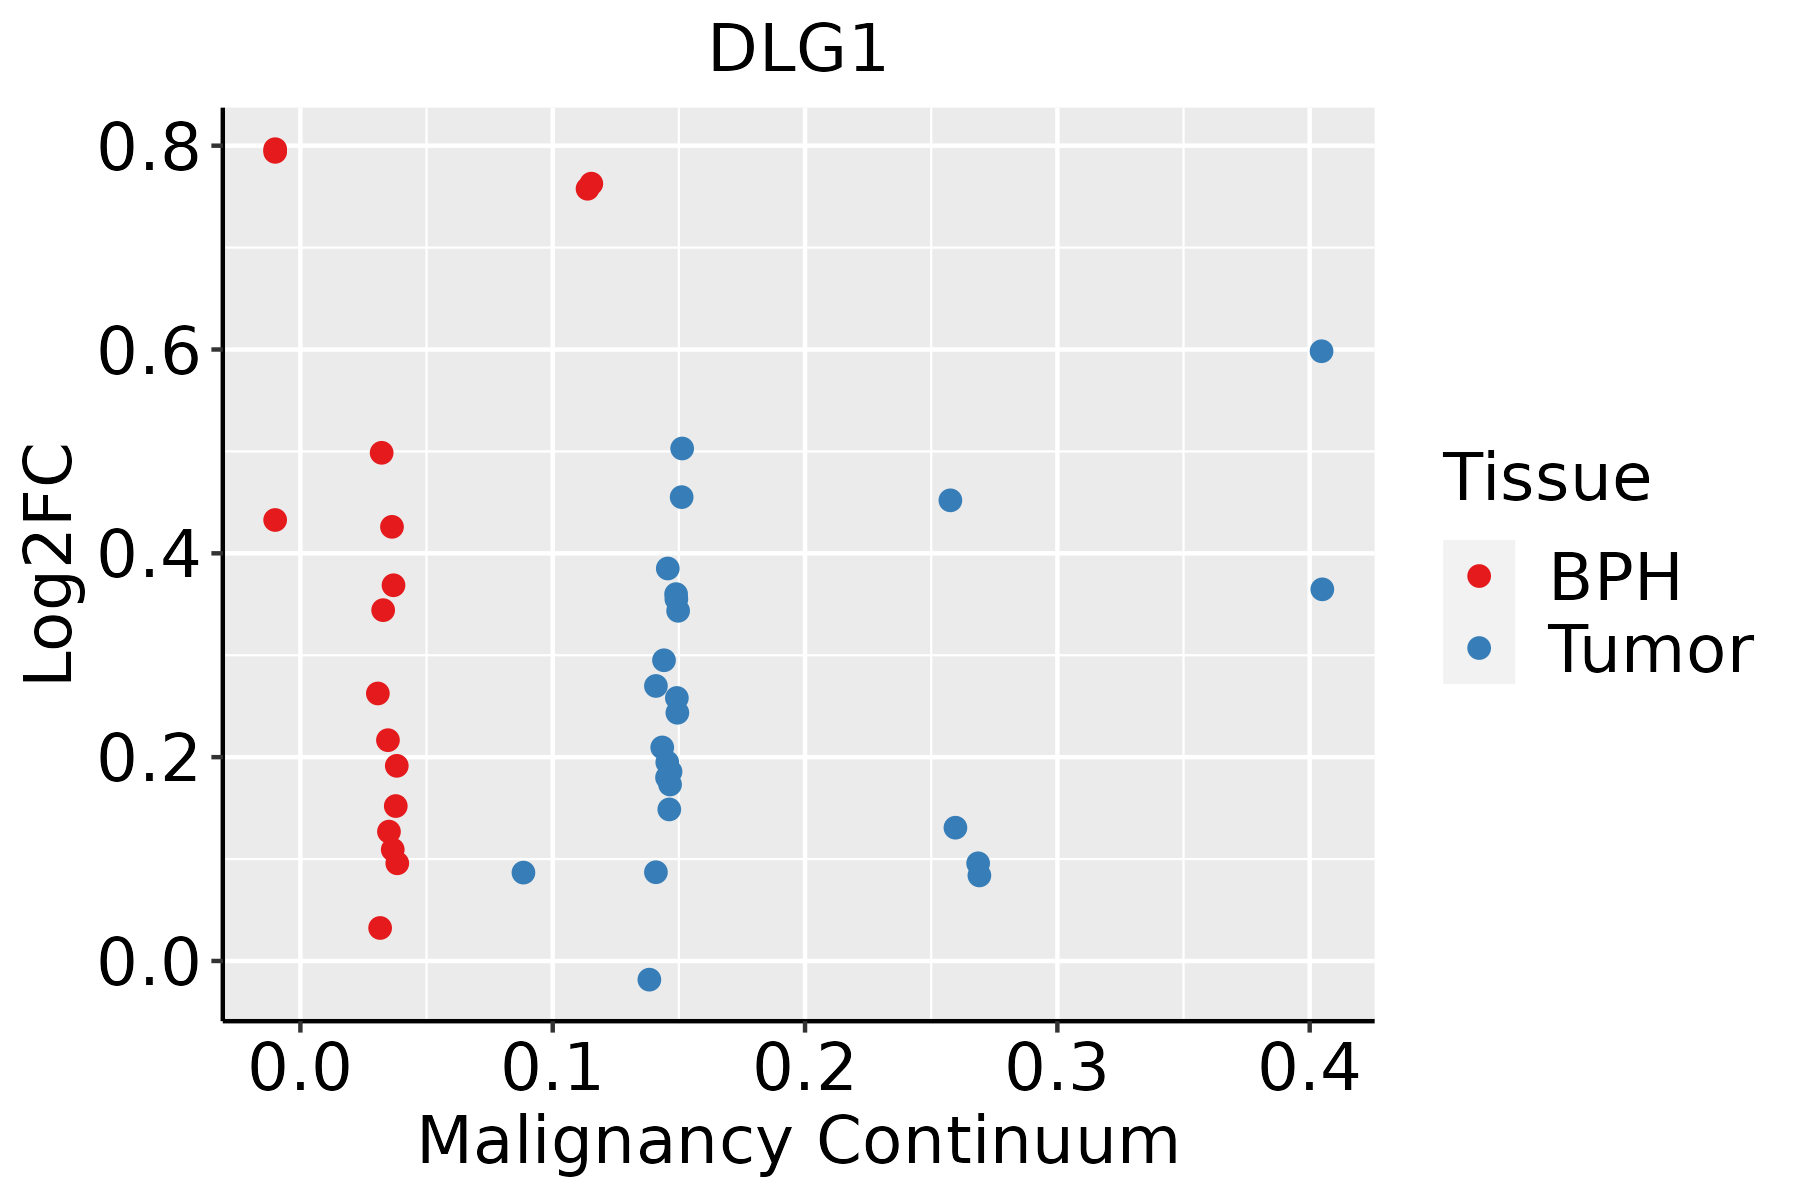 | BPH: Benign Prostatic Hyperplasia |
| Skin | 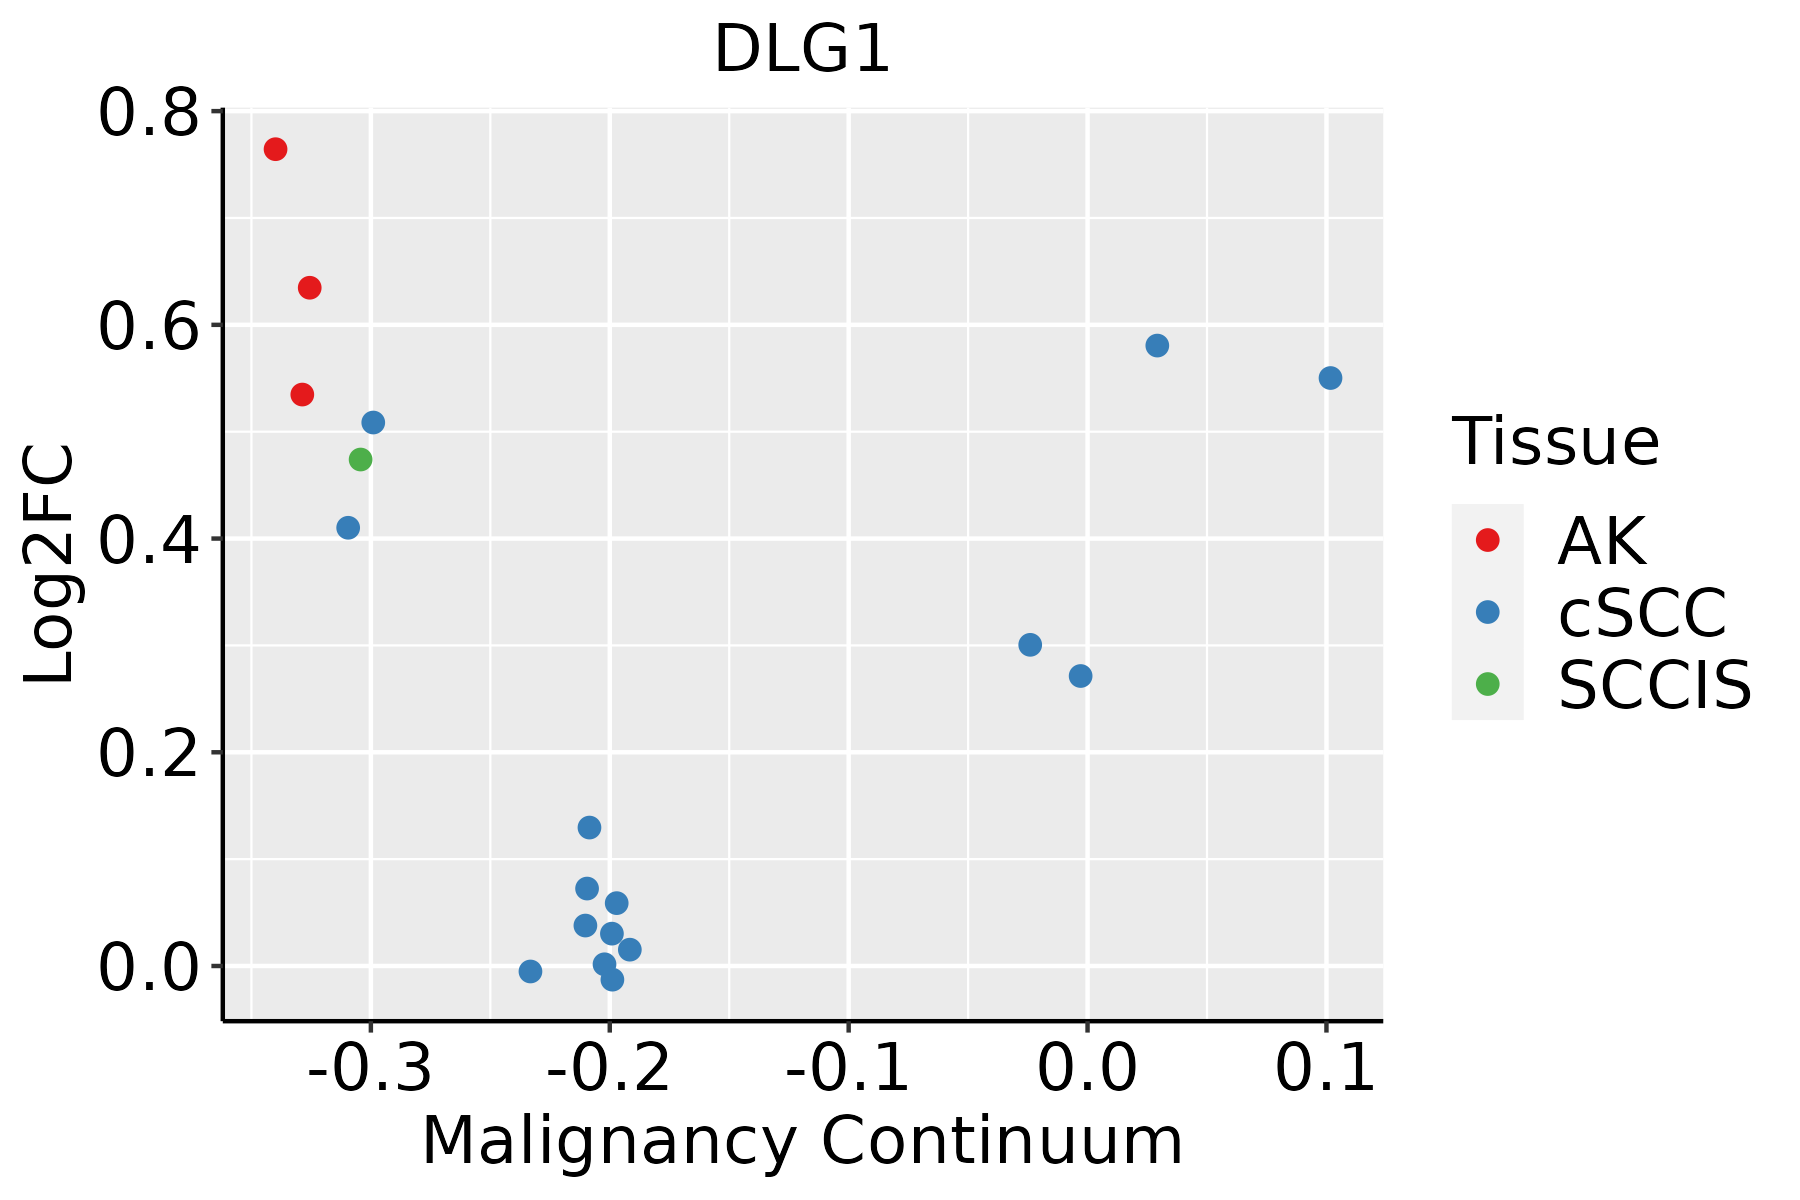 | AK: Actinic keratosis |
| cSCC: Cutaneous squamous cell carcinoma |
| SCCIS:squamous cell carcinoma in situ |
| Thyroid |  | ATC: Anaplastic thyroid cancer |
| HT: Hashimoto's thyroiditis |
| PTC: Papillary thyroid cancer |
| GO ID | Tissue | Disease Stage | Description | Gene Ratio | Bg Ratio | pvalue | p.adjust | Count |
| GO:00516567 | Cervix | CC | establishment of organelle localization | 76/2311 | 390/18723 | 3.17e-05 | 5.21e-04 | 76 |
| GO:0002695 | Cervix | CC | negative regulation of leukocyte activation | 43/2311 | 187/18723 | 3.47e-05 | 5.60e-04 | 43 |
| GO:00308339 | Cervix | CC | regulation of actin filament polymerization | 40/2311 | 172/18723 | 4.90e-05 | 7.40e-04 | 40 |
| GO:00466516 | Cervix | CC | lymphocyte proliferation | 59/2311 | 288/18723 | 5.53e-05 | 8.10e-04 | 59 |
| GO:0050868 | Cervix | CC | negative regulation of T cell activation | 31/2311 | 122/18723 | 5.81e-05 | 8.46e-04 | 31 |
| GO:00329435 | Cervix | CC | mononuclear cell proliferation | 59/2311 | 291/18723 | 7.51e-05 | 1.03e-03 | 59 |
| GO:00080649 | Cervix | CC | regulation of actin polymerization or depolymerization | 42/2311 | 188/18723 | 8.60e-05 | 1.15e-03 | 42 |
| GO:00308657 | Cervix | CC | cortical cytoskeleton organization | 19/2311 | 61/18723 | 8.72e-05 | 1.16e-03 | 19 |
| GO:00605375 | Cervix | CC | muscle tissue development | 76/2311 | 403/18723 | 9.76e-05 | 1.27e-03 | 76 |
| GO:00308328 | Cervix | CC | regulation of actin filament length | 42/2311 | 189/18723 | 9.76e-05 | 1.27e-03 | 42 |
| GO:19019873 | Cervix | CC | regulation of cell cycle phase transition | 74/2311 | 390/18723 | 9.80e-05 | 1.27e-03 | 74 |
| GO:19030768 | Cervix | CC | regulation of protein localization to plasma membrane | 27/2311 | 104/18723 | 1.15e-04 | 1.44e-03 | 27 |
| GO:003227310 | Cervix | CC | positive regulation of protein polymerization | 33/2311 | 138/18723 | 1.23e-04 | 1.53e-03 | 33 |
| GO:01201927 | Cervix | CC | tight junction assembly | 21/2311 | 74/18723 | 1.69e-04 | 2.00e-03 | 21 |
| GO:1903038 | Cervix | CC | negative regulation of leukocyte cell-cell adhesion | 33/2311 | 141/18723 | 1.90e-04 | 2.21e-03 | 33 |
| GO:01201937 | Cervix | CC | tight junction organization | 22/2311 | 80/18723 | 1.97e-04 | 2.26e-03 | 22 |
| GO:00380664 | Cervix | CC | p38MAPK cascade | 17/2311 | 55/18723 | 2.25e-04 | 2.54e-03 | 17 |
| GO:19043758 | Cervix | CC | regulation of protein localization to cell periphery | 30/2311 | 125/18723 | 2.28e-04 | 2.56e-03 | 30 |
| GO:0050866 | Cervix | CC | negative regulation of cell activation | 44/2311 | 210/18723 | 2.76e-04 | 3.02e-03 | 44 |
| GO:19023059 | Cervix | CC | regulation of sodium ion transmembrane transport | 19/2311 | 68/18723 | 4.21e-04 | 4.25e-03 | 19 |
| Pathway ID | Tissue | Disease Stage | Description | Gene Ratio | Bg Ratio | pvalue | p.adjust | qvalue | Count |
| hsa0516620 | Cervix | CC | Human T-cell leukemia virus 1 infection | 61/1267 | 222/8465 | 8.13e-07 | 7.98e-06 | 4.72e-06 | 61 |
| hsa0453020 | Cervix | CC | Tight junction | 49/1267 | 169/8465 | 1.87e-06 | 1.78e-05 | 1.05e-05 | 49 |
| hsa051657 | Cervix | CC | Human papillomavirus infection | 74/1267 | 331/8465 | 1.70e-04 | 1.02e-03 | 6.03e-04 | 74 |
| hsa043908 | Cervix | CC | Hippo signaling pathway | 40/1267 | 157/8465 | 3.64e-04 | 1.82e-03 | 1.07e-03 | 40 |
| hsa046604 | Cervix | CC | T cell receptor signaling pathway | 25/1267 | 104/8465 | 9.52e-03 | 2.94e-02 | 1.74e-02 | 25 |
| hsa05166110 | Cervix | CC | Human T-cell leukemia virus 1 infection | 61/1267 | 222/8465 | 8.13e-07 | 7.98e-06 | 4.72e-06 | 61 |
| hsa04530110 | Cervix | CC | Tight junction | 49/1267 | 169/8465 | 1.87e-06 | 1.78e-05 | 1.05e-05 | 49 |
| hsa0516512 | Cervix | CC | Human papillomavirus infection | 74/1267 | 331/8465 | 1.70e-04 | 1.02e-03 | 6.03e-04 | 74 |
| hsa0439013 | Cervix | CC | Hippo signaling pathway | 40/1267 | 157/8465 | 3.64e-04 | 1.82e-03 | 1.07e-03 | 40 |
| hsa0466011 | Cervix | CC | T cell receptor signaling pathway | 25/1267 | 104/8465 | 9.52e-03 | 2.94e-02 | 1.74e-02 | 25 |
| hsa04530 | Colorectum | AD | Tight junction | 76/2092 | 169/8465 | 5.49e-09 | 9.69e-08 | 6.18e-08 | 76 |
| hsa05166 | Colorectum | AD | Human T-cell leukemia virus 1 infection | 72/2092 | 222/8465 | 5.24e-03 | 2.44e-02 | 1.55e-02 | 72 |
| hsa045301 | Colorectum | AD | Tight junction | 76/2092 | 169/8465 | 5.49e-09 | 9.69e-08 | 6.18e-08 | 76 |
| hsa051661 | Colorectum | AD | Human T-cell leukemia virus 1 infection | 72/2092 | 222/8465 | 5.24e-03 | 2.44e-02 | 1.55e-02 | 72 |
| hsa045302 | Colorectum | SER | Tight junction | 59/1580 | 169/8465 | 3.24e-07 | 5.98e-06 | 4.34e-06 | 59 |
| hsa045303 | Colorectum | SER | Tight junction | 59/1580 | 169/8465 | 3.24e-07 | 5.98e-06 | 4.34e-06 | 59 |
| hsa045304 | Colorectum | MSS | Tight junction | 66/1875 | 169/8465 | 4.10e-07 | 6.25e-06 | 3.83e-06 | 66 |
| hsa051662 | Colorectum | MSS | Human T-cell leukemia virus 1 infection | 68/1875 | 222/8465 | 1.84e-03 | 9.61e-03 | 5.89e-03 | 68 |
| hsa04390 | Colorectum | MSS | Hippo signaling pathway | 48/1875 | 157/8465 | 8.32e-03 | 3.10e-02 | 1.90e-02 | 48 |
| hsa045305 | Colorectum | MSS | Tight junction | 66/1875 | 169/8465 | 4.10e-07 | 6.25e-06 | 3.83e-06 | 66 |
| Hugo Symbol | Variant Class | Variant Classification | dbSNP RS | HGVSc | HGVSp | HGVSp Short | SWISSPROT | BIOTYPE | SIFT | PolyPhen | Tumor Sample Barcode | Tissue | Histology | Sex | Age | Stage | Therapy Types | Drugs | Outcome |
| DLG1 | SNV | Missense_Mutation | novel | c.301N>A | p.Leu101Ile | p.L101I | Q12959 | protein_coding | tolerated_low_confidence(0.17) | possibly_damaging(0.689) | TCGA-A2-A4S1-01 | Breast | breast invasive carcinoma | Female | >=65 | I/II | Unknown | Unknown | SD |
| DLG1 | SNV | Missense_Mutation | | c.731N>C | p.Asn244Thr | p.N244T | Q12959 | protein_coding | deleterious(0.03) | probably_damaging(0.999) | TCGA-A8-A083-01 | Breast | breast invasive carcinoma | Female | >=65 | I/II | Unknown | Unknown | SD |
| DLG1 | SNV | Missense_Mutation | novel | c.1434N>G | p.Phe478Leu | p.F478L | Q12959 | protein_coding | deleterious(0.01) | probably_damaging(0.999) | TCGA-AC-A5XS-01 | Breast | breast invasive carcinoma | Female | >=65 | I/II | Hormone Therapy | femara | SD |
| DLG1 | SNV | Missense_Mutation | | c.16N>G | p.Gln6Glu | p.Q6E | Q12959 | protein_coding | tolerated(0.38) | benign(0) | TCGA-AN-A0FW-01 | Breast | breast invasive carcinoma | Female | >=65 | III/IV | Unknown | Unknown | SD |
| DLG1 | SNV | Missense_Mutation | | c.1186N>T | p.Asp396Tyr | p.D396Y | Q12959 | protein_coding | deleterious(0) | probably_damaging(0.987) | TCGA-BH-A0AZ-01 | Breast | breast invasive carcinoma | Female | <65 | III/IV | Chemotherapy | doxorubicin | CR |
| DLG1 | SNV | Missense_Mutation | novel | c.2516N>C | p.Arg839Thr | p.R839T | Q12959 | protein_coding | deleterious(0) | probably_damaging(0.999) | TCGA-BH-A209-01 | Breast | breast invasive carcinoma | Female | >=65 | I/II | Unknown | Unknown | SD |
| DLG1 | SNV | Missense_Mutation | | c.2251G>T | p.Asp751Tyr | p.D751Y | Q12959 | protein_coding | deleterious(0) | probably_damaging(0.978) | TCGA-C8-A26Y-01 | Breast | breast invasive carcinoma | Female | >=65 | I/II | Unknown | Unknown | SD |
| DLG1 | SNV | Missense_Mutation | | c.1692G>A | p.Met564Ile | p.M564I | Q12959 | protein_coding | tolerated(0.07) | benign(0.406) | TCGA-D8-A1JJ-01 | Breast | breast invasive carcinoma | Female | <65 | I/II | Chemotherapy | doxorubicine | SD |
| DLG1 | SNV | Missense_Mutation | novel | c.2013N>A | p.Phe671Leu | p.F671L | Q12959 | protein_coding | tolerated(0.92) | benign(0) | TCGA-E2-A1LG-01 | Breast | breast invasive carcinoma | Female | <65 | I/II | Chemotherapy | doxorubicin | SD |
| DLG1 | SNV | Missense_Mutation | novel | c.2432N>G | p.Tyr811Cys | p.Y811C | Q12959 | protein_coding | deleterious(0) | probably_damaging(1) | TCGA-LL-A740-01 | Breast | breast invasive carcinoma | Female | <65 | I/II | Chemotherapy | adriamycin | CR |


