
|
|||||
|
 | |
| |
| |
| |
| |
| |
|
Gene: CYRIB |
Gene summary for CYRIB |
| Gene information | Species | Human | Gene symbol | CYRIB | Gene ID | 51571 |
| Gene name | CYFIP related Rac1 interactor B | |
| Gene Alias | BM-009 | |
| Cytomap | 8q24.21 | |
| Gene Type | protein-coding | GO ID | GO:0000266 | UniProtAcc | A0A024R9G4 |
Top |
Malignant transformation analysis |
| Identification of the aberrant gene expression in precancerous and cancerous lesions by comparing the gene expression of stem-like cells in diseased tissues with normal stem cells |
| Entrez ID | Symbol | Replicates | Species | Organ | Tissue | Adj P-value | Log2FC | Malignancy |
| 51571 | CYRIB | CA_HPV_1 | Human | Cervix | CC | 2.84e-03 | 1.84e-01 | 0.0264 |
| 51571 | CYRIB | N_HPV_2 | Human | Cervix | N_HPV | 3.16e-03 | 1.85e-01 | -0.0131 |
| 51571 | CYRIB | CCI_1 | Human | Cervix | CC | 1.93e-06 | -5.20e-01 | 0.528 |
| 51571 | CYRIB | CCI_2 | Human | Cervix | CC | 8.18e-06 | -5.20e-01 | 0.5249 |
| 51571 | CYRIB | CCI_3 | Human | Cervix | CC | 5.72e-09 | -5.20e-01 | 0.516 |
| 51571 | CYRIB | CCII_1 | Human | Cervix | CC | 7.66e-13 | -5.20e-01 | 0.3249 |
| 51571 | CYRIB | Tumor | Human | Cervix | CC | 6.17e-26 | -5.20e-01 | 0.1241 |
| 51571 | CYRIB | sample1 | Human | Cervix | CC | 1.45e-10 | -5.20e-01 | 0.0959 |
| 51571 | CYRIB | sample3 | Human | Cervix | CC | 2.98e-28 | -5.20e-01 | 0.1387 |
| 51571 | CYRIB | H2 | Human | Cervix | HSIL_HPV | 2.98e-28 | -5.20e-01 | 0.0632 |
| 51571 | CYRIB | L1 | Human | Cervix | CC | 3.46e-14 | -5.20e-01 | 0.0802 |
| 51571 | CYRIB | T1 | Human | Cervix | CC | 5.04e-24 | -5.20e-01 | 0.0918 |
| 51571 | CYRIB | T2 | Human | Cervix | CC | 1.97e-05 | -5.20e-01 | 0.0709 |
| 51571 | CYRIB | T3 | Human | Cervix | CC | 4.34e-27 | -5.20e-01 | 0.1389 |
| 51571 | CYRIB | HTA11_3410_2000001011 | Human | Colorectum | AD | 8.85e-17 | 3.24e-01 | 0.0155 |
| 51571 | CYRIB | HTA11_2487_2000001011 | Human | Colorectum | SER | 2.28e-26 | 6.02e-01 | -0.1808 |
| 51571 | CYRIB | HTA11_2951_2000001011 | Human | Colorectum | AD | 3.22e-05 | 3.08e-01 | 0.0216 |
| 51571 | CYRIB | HTA11_1938_2000001011 | Human | Colorectum | AD | 7.66e-36 | 8.32e-01 | -0.0811 |
| 51571 | CYRIB | HTA11_78_2000001011 | Human | Colorectum | AD | 2.21e-33 | 8.00e-01 | -0.1088 |
| 51571 | CYRIB | HTA11_347_2000001011 | Human | Colorectum | AD | 1.60e-53 | 8.72e-01 | -0.1954 |
| Page: 1 2 3 |
| Tissue | Expression Dynamics | Abbreviation |
| Cervix | 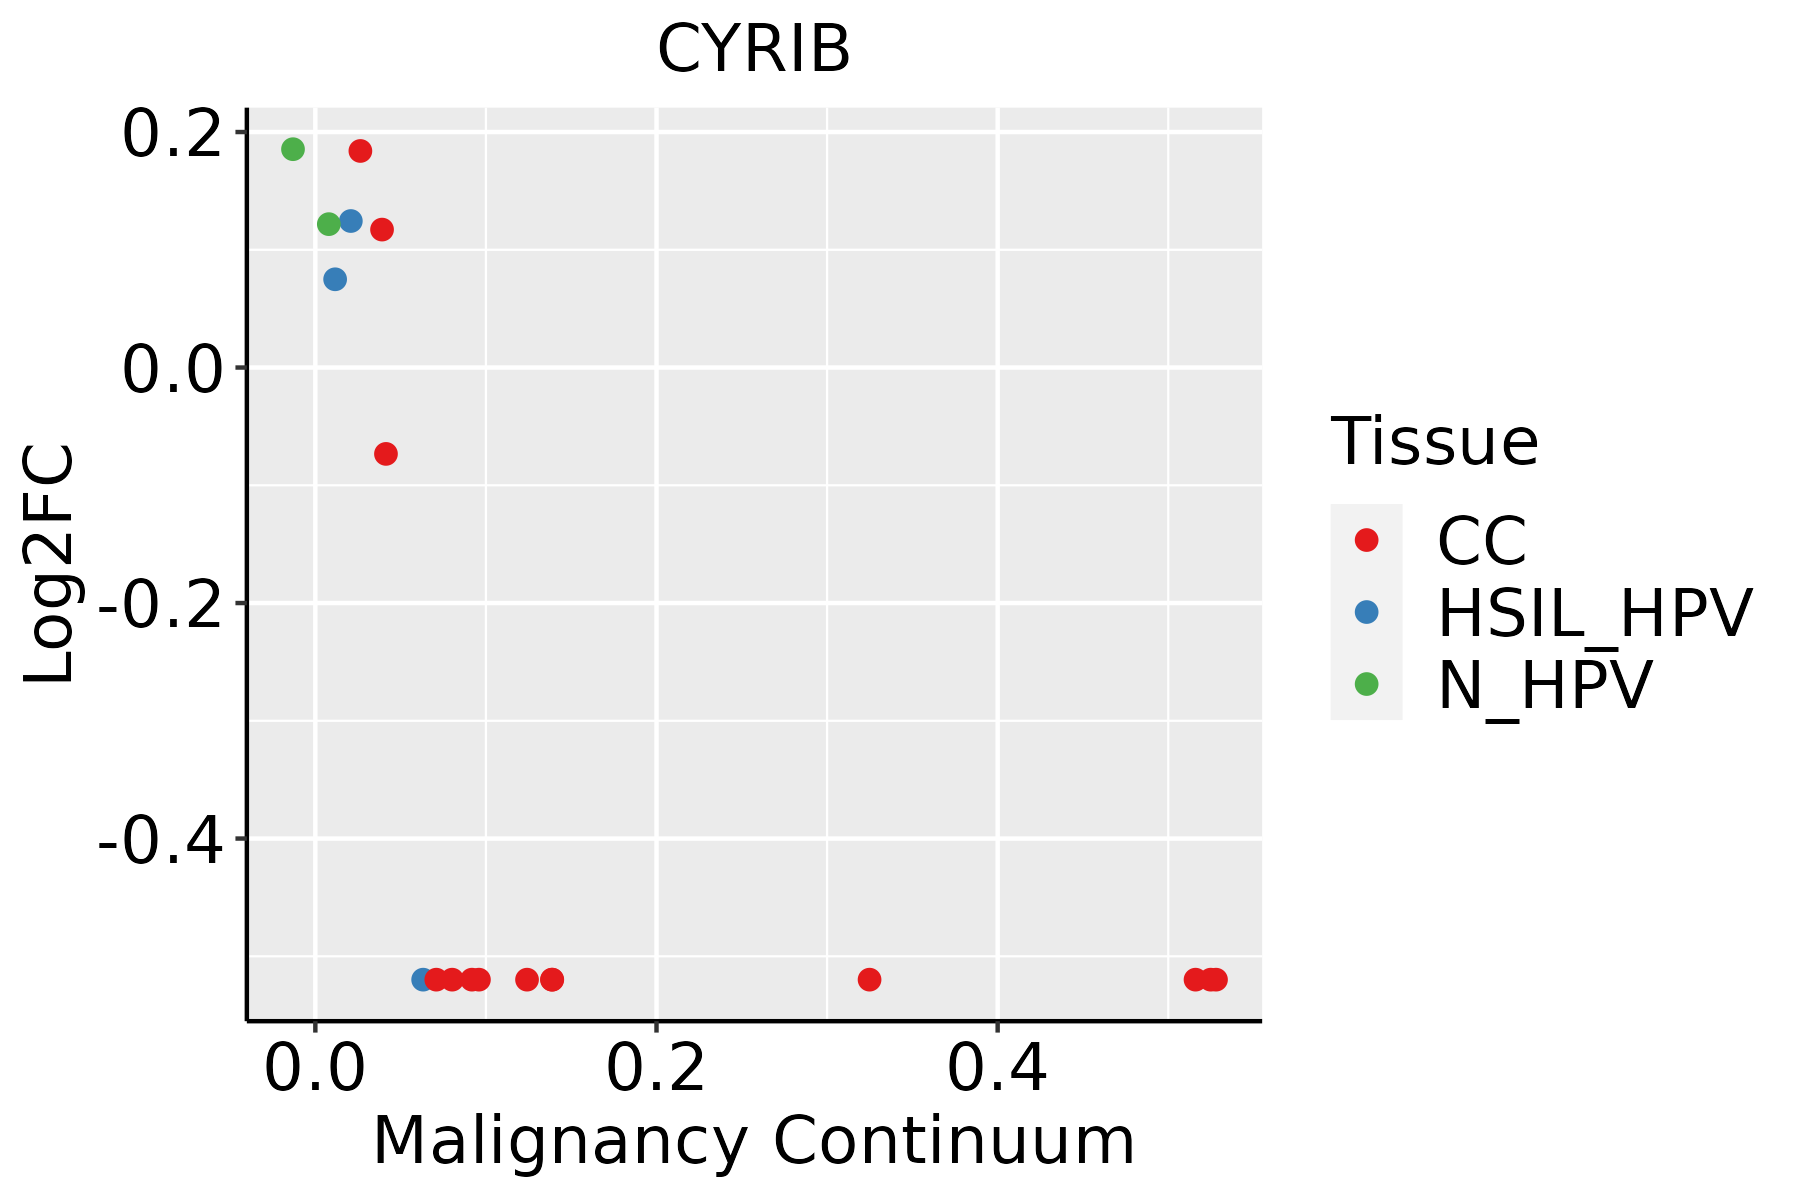 | CC: Cervix cancer |
| HSIL_HPV: HPV-infected high-grade squamous intraepithelial lesions | ||
| N_HPV: HPV-infected normal cervix | ||
| Colorectum (GSE201348) | 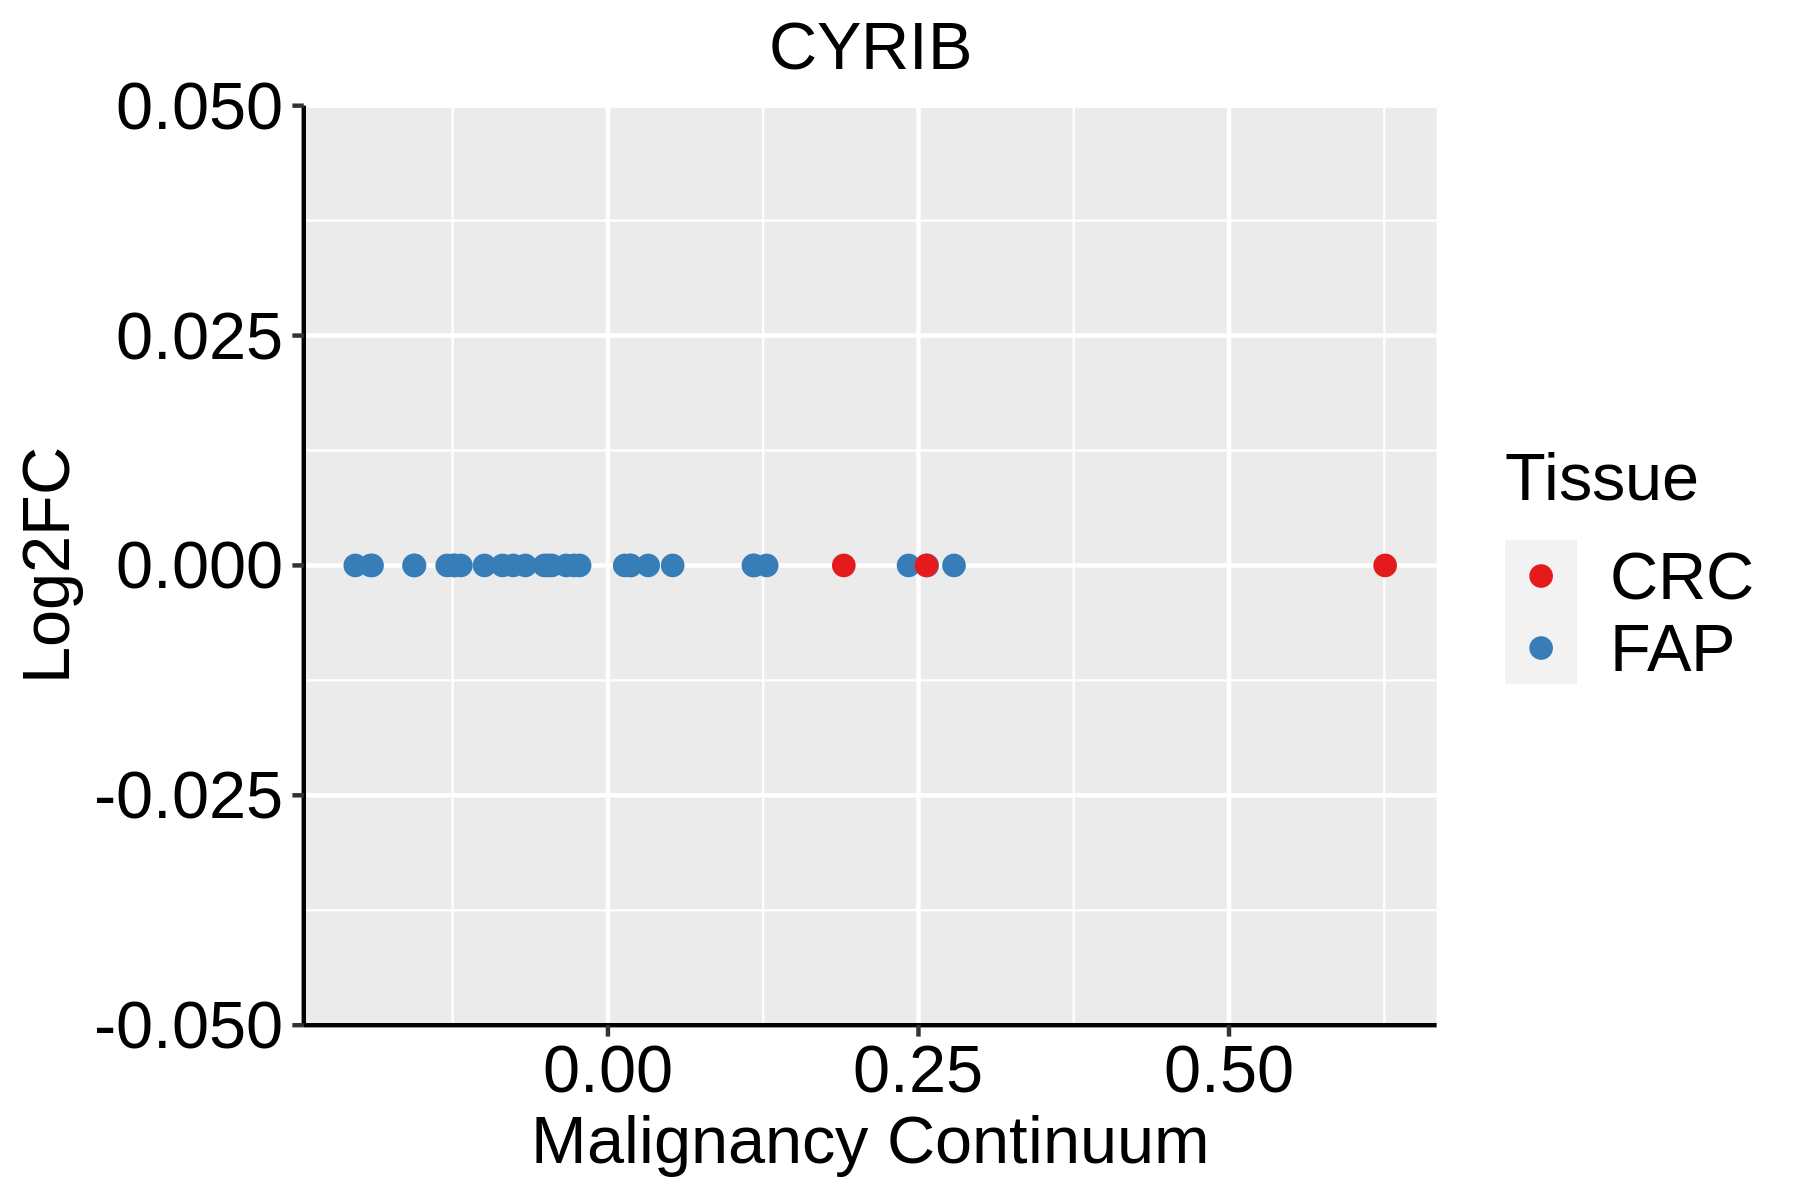 | FAP: Familial adenomatous polyposis |
| CRC: Colorectal cancer | ||
| Colorectum (HTA11) |  | AD: Adenomas |
| SER: Sessile serrated lesions | ||
| MSI-H: Microsatellite-high colorectal cancer | ||
| MSS: Microsatellite stable colorectal cancer |
| ∗log2FC in expression of this searched gene in stem-like cells from each diseased tissue sample relative to stem-like cells in normal samples in each tissue plotted against the malignancy continuum. Samples are colored based on if they are from different disease stage. |
Top |
Malignant transformation related pathway analysis |
| Find out the enriched GO biological processes and KEGG pathways involved in transition from healthy to precancer to cancer |
| Tissue | Disease Stage | Enriched GO biological Processes |
| Colorectum | AD |  |
| Colorectum | SER |  |
| Colorectum | MSS |  |
| Colorectum | MSI-H |  |
| Colorectum | FAP |  |
| ∗Top 15 enriched GO BP terms are showed in the bar plot of each disease state in each tissue. Each row represents a significant GO biological process which is colored according to the -log10(p.adjust). |
| Page: 1 2 3 4 5 6 7 8 9 |
| GO ID | Tissue | Disease Stage | Description | Gene Ratio | Bg Ratio | pvalue | p.adjust | Count |
| GO:000269611 | Cervix | HSIL_HPV | positive regulation of leukocyte activation | 44/737 | 409/18723 | 1.58e-09 | 3.04e-07 | 44 |
| GO:005086711 | Cervix | HSIL_HPV | positive regulation of cell activation | 44/737 | 420/18723 | 3.59e-09 | 5.76e-07 | 44 |
| GO:005125112 | Cervix | HSIL_HPV | positive regulation of lymphocyte activation | 40/737 | 362/18723 | 4.11e-09 | 6.38e-07 | 40 |
| GO:004211013 | Cervix | HSIL_HPV | T cell activation | 48/737 | 487/18723 | 5.12e-09 | 7.61e-07 | 48 |
| GO:190303712 | Cervix | HSIL_HPV | regulation of leukocyte cell-cell adhesion | 38/737 | 336/18723 | 5.31e-09 | 7.61e-07 | 38 |
| GO:190303912 | Cervix | HSIL_HPV | positive regulation of leukocyte cell-cell adhesion | 31/737 | 239/18723 | 5.53e-09 | 7.61e-07 | 31 |
| GO:002240913 | Cervix | HSIL_HPV | positive regulation of cell-cell adhesion | 34/737 | 284/18723 | 8.14e-09 | 1.03e-06 | 34 |
| GO:005086312 | Cervix | HSIL_HPV | regulation of T cell activation | 37/737 | 329/18723 | 9.84e-09 | 1.19e-06 | 37 |
| GO:005087012 | Cervix | HSIL_HPV | positive regulation of T cell activation | 28/737 | 216/18723 | 3.07e-08 | 2.59e-06 | 28 |
| GO:000701515 | Cervix | HSIL_HPV | actin filament organization | 43/737 | 442/18723 | 4.77e-08 | 3.59e-06 | 43 |
| GO:000246011 | Cervix | HSIL_HPV | adaptive immune response based on somatic recombination of immune receptors built from immunoglobulin superfamily domains | 37/737 | 356/18723 | 7.84e-08 | 5.32e-06 | 37 |
| GO:00024431 | Cervix | HSIL_HPV | leukocyte mediated immunity | 41/737 | 440/18723 | 3.14e-07 | 1.76e-05 | 41 |
| GO:000223713 | Cervix | HSIL_HPV | response to molecule of bacterial origin | 36/737 | 363/18723 | 3.74e-07 | 2.06e-05 | 36 |
| GO:00024493 | Cervix | HSIL_HPV | lymphocyte mediated immunity | 35/737 | 350/18723 | 4.45e-07 | 2.36e-05 | 35 |
| GO:000190611 | Cervix | HSIL_HPV | cell killing | 23/737 | 188/18723 | 1.45e-06 | 6.47e-05 | 23 |
| GO:000181912 | Cervix | HSIL_HPV | positive regulation of cytokine production | 41/737 | 467/18723 | 1.48e-06 | 6.52e-05 | 41 |
| GO:003295615 | Cervix | HSIL_HPV | regulation of actin cytoskeleton organization | 33/737 | 358/18723 | 5.61e-06 | 2.09e-04 | 33 |
| GO:003297015 | Cervix | HSIL_HPV | regulation of actin filament-based process | 35/737 | 397/18723 | 7.87e-06 | 2.81e-04 | 35 |
| GO:190290315 | Cervix | HSIL_HPV | regulation of supramolecular fiber organization | 34/737 | 383/18723 | 9.14e-06 | 3.19e-04 | 34 |
| GO:000269711 | Cervix | HSIL_HPV | regulation of immune effector process | 29/737 | 339/18723 | 7.97e-05 | 1.79e-03 | 29 |
| Page: 1 2 3 4 5 6 7 8 9 10 11 |
| Pathway ID | Tissue | Disease Stage | Description | Gene Ratio | Bg Ratio | pvalue | p.adjust | qvalue | Count |
| Page: 1 |
Top |
Cell-cell communication analysis |
| Identification of potential cell-cell interactions between two cell types and their ligand-receptor pairs for different disease states |
| Ligand | Receptor | LRpair | Pathway | Tissue | Disease Stage |
| Page: 1 |
Top |
Single-cell gene regulatory network inference analysis |
| Find out the significant the regulons (TFs) and the target genes of each regulon across cell types for different disease states |
| TF | Cell Type | Tissue | Disease Stage | Target Gene | RSS | Regulon Activity |
| ∗The dot plots of a searched regulon are shown for all cell subpopulations in each disease state of each tissue based on the regulon specific score inferred using pySCENIC and by calculating the average expression. |
| Page: 1 |
Top |
Somatic mutation of malignant transformation related genes |
| Annotation of somatic variants for genes involved in malignant transformation |
| Hugo Symbol | Variant Class | Variant Classification | dbSNP RS | HGVSc | HGVSp | HGVSp Short | SWISSPROT | BIOTYPE | SIFT | PolyPhen | Tumor Sample Barcode | Tissue | Histology | Sex | Age | Stage | Therapy Types | Drugs | Outcome |
| Page: 1 |
Top |
Related drugs of malignant transformation related genes |
| Identification of chemicals and drugs interact with genes involved in malignant transfromation |
| (DGIdb 4.0) |
| Entrez ID | Symbol | Category | Interaction Types | Drug Claim Name | Drug Name | PMIDs |
| Page: 1 |

Copyright 2023-Present -The University of Texas Health Science Center at Houston |