
|
|||||
|
 | |
| |
| |
| |
| |
| |
|
Gene: CXCL13 |
Gene summary for CXCL13 |
| Gene information | Species | Human | Gene symbol | CXCL13 | Gene ID | 10563 |
| Gene name | C-X-C motif chemokine ligand 13 | |
| Gene Alias | ANGIE | |
| Cytomap | 4q21.1 | |
| Gene Type | protein-coding | GO ID | GO:0001525 | UniProtAcc | O43927 |
Top |
Malignant transformation analysis |
| Identification of the aberrant gene expression in precancerous and cancerous lesions by comparing the gene expression of stem-like cells in diseased tissues with normal stem cells |
| Entrez ID | Symbol | Replicates | Species | Organ | Tissue | Adj P-value | Log2FC | Malignancy |
| 10563 | CXCL13 | GSM4909281 | Human | Breast | IDC | 1.65e-06 | -4.39e-01 | 0.21 |
| 10563 | CXCL13 | GSM4909282 | Human | Breast | IDC | 8.04e-10 | -4.71e-01 | -0.0288 |
| 10563 | CXCL13 | GSM4909285 | Human | Breast | IDC | 1.12e-08 | -4.53e-01 | 0.21 |
| 10563 | CXCL13 | GSM4909286 | Human | Breast | IDC | 3.52e-11 | -4.71e-01 | 0.1081 |
| 10563 | CXCL13 | GSM4909287 | Human | Breast | IDC | 3.91e-02 | -3.87e-01 | 0.2057 |
| 10563 | CXCL13 | GSM4909291 | Human | Breast | IDC | 1.25e-03 | -4.71e-01 | 0.1753 |
| 10563 | CXCL13 | GSM4909293 | Human | Breast | IDC | 3.65e-03 | -2.90e-01 | 0.1581 |
| 10563 | CXCL13 | GSM4909294 | Human | Breast | IDC | 8.37e-04 | -3.83e-01 | 0.2022 |
| 10563 | CXCL13 | GSM4909296 | Human | Breast | IDC | 2.44e-08 | 7.25e-01 | 0.1524 |
| 10563 | CXCL13 | GSM4909298 | Human | Breast | IDC | 4.45e-06 | -4.42e-01 | 0.1551 |
| 10563 | CXCL13 | GSM4909299 | Human | Breast | IDC | 3.52e-11 | -4.67e-01 | 0.035 |
| 10563 | CXCL13 | GSM4909301 | Human | Breast | IDC | 7.71e-11 | -4.71e-01 | 0.1577 |
| 10563 | CXCL13 | GSM4909302 | Human | Breast | IDC | 1.95e-41 | 1.10e+00 | 0.1545 |
| 10563 | CXCL13 | GSM4909304 | Human | Breast | IDC | 9.41e-121 | 1.74e+00 | 0.1636 |
| 10563 | CXCL13 | GSM4909305 | Human | Breast | IDC | 3.46e-03 | -4.65e-01 | 0.0436 |
| 10563 | CXCL13 | GSM4909306 | Human | Breast | IDC | 2.83e-08 | -4.67e-01 | 0.1564 |
| 10563 | CXCL13 | GSM4909307 | Human | Breast | IDC | 3.52e-11 | -4.71e-01 | 0.1569 |
| 10563 | CXCL13 | GSM4909308 | Human | Breast | IDC | 1.54e-06 | -4.71e-01 | 0.158 |
| 10563 | CXCL13 | GSM4909311 | Human | Breast | IDC | 3.52e-11 | -4.71e-01 | 0.1534 |
| 10563 | CXCL13 | GSM4909312 | Human | Breast | IDC | 7.71e-11 | -4.71e-01 | 0.1552 |
| Page: 1 2 |
| Tissue | Expression Dynamics | Abbreviation |
| Breast | 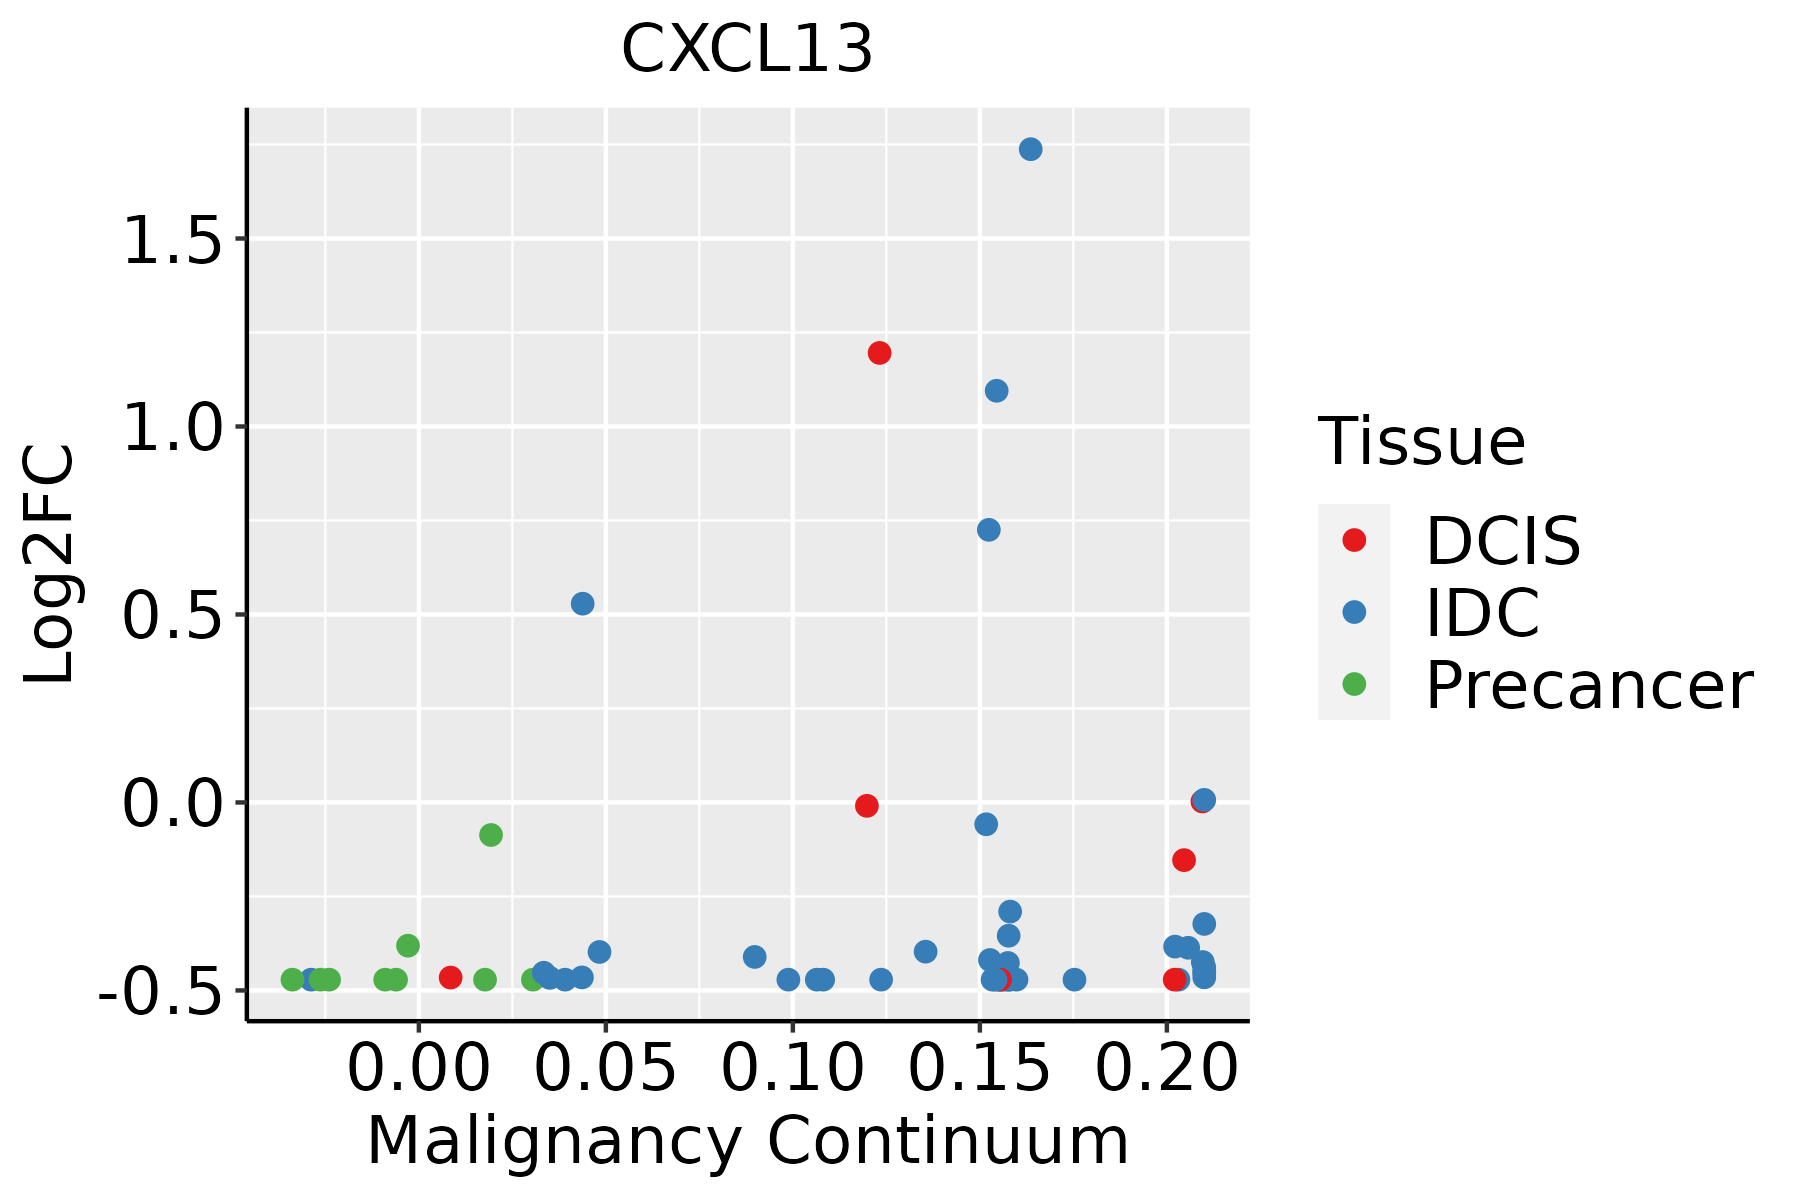 | IDC: Invasive ductal carcinoma |
| DCIS: Ductal carcinoma in situ | ||
| Precancer(BRCA1-mut): Precancerous lesion from BRCA1 mutation carriers | ||
| Esophagus | 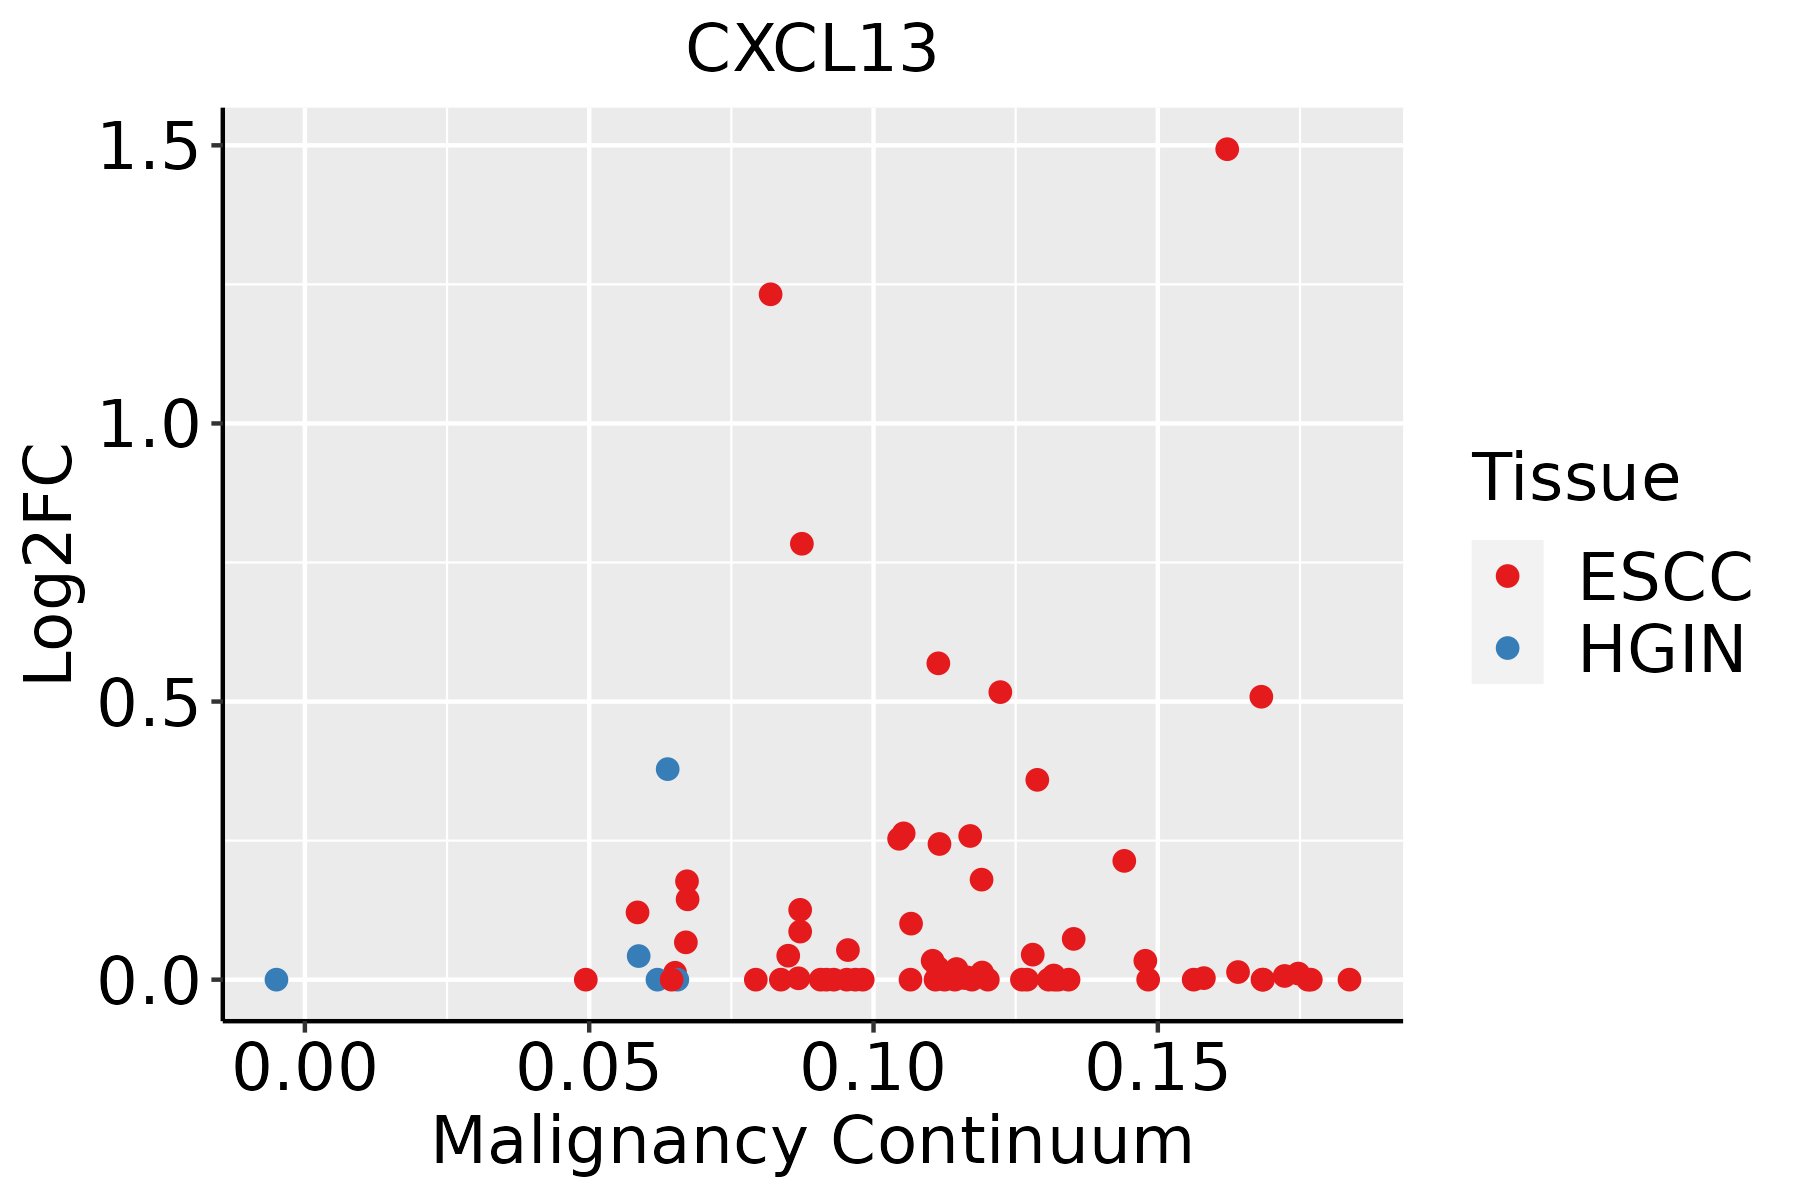 | ESCC: Esophageal squamous cell carcinoma |
| HGIN: High-grade intraepithelial neoplasias | ||
| LGIN: Low-grade intraepithelial neoplasias | ||
| Oral Cavity | 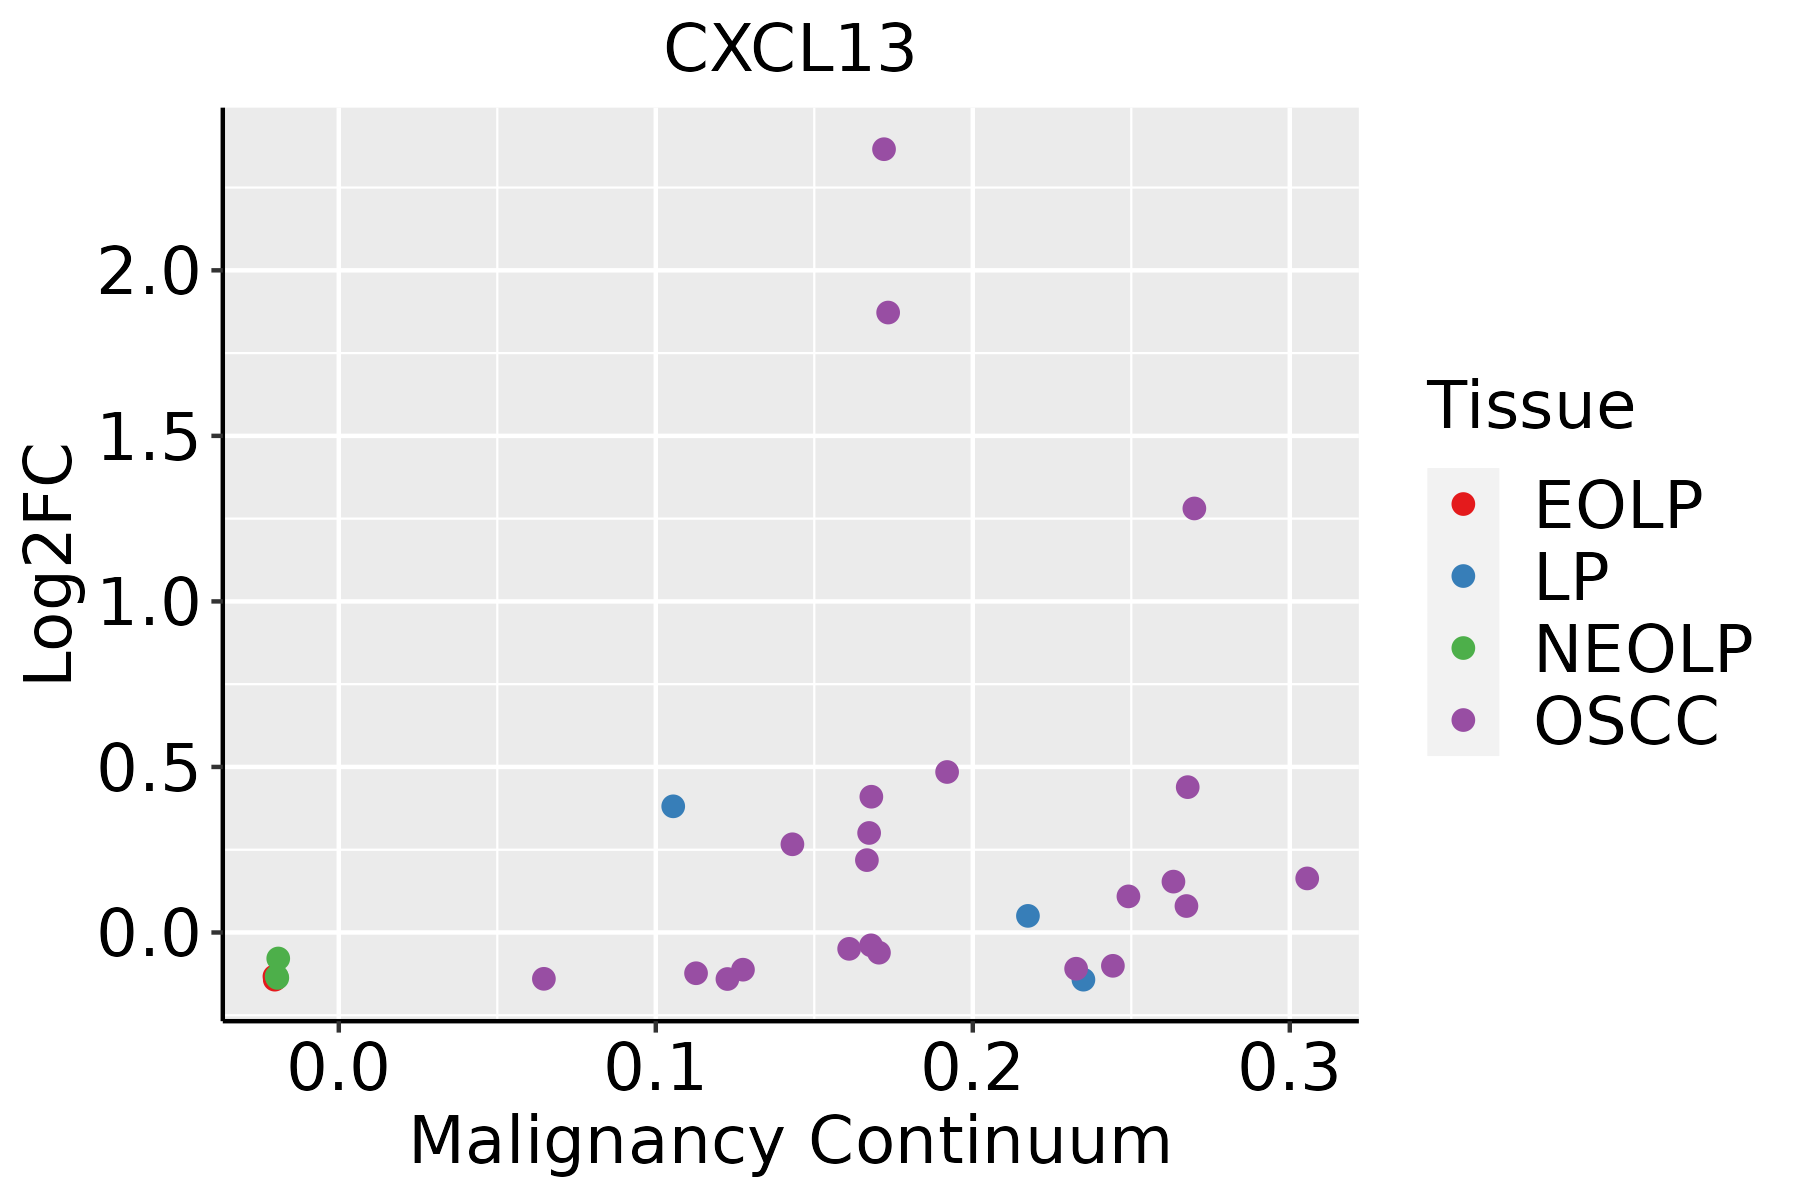 | EOLP: Erosive Oral lichen planus |
| LP: leukoplakia | ||
| NEOLP: Non-erosive oral lichen planus | ||
| OSCC: Oral squamous cell carcinoma | ||
| Thyroid | 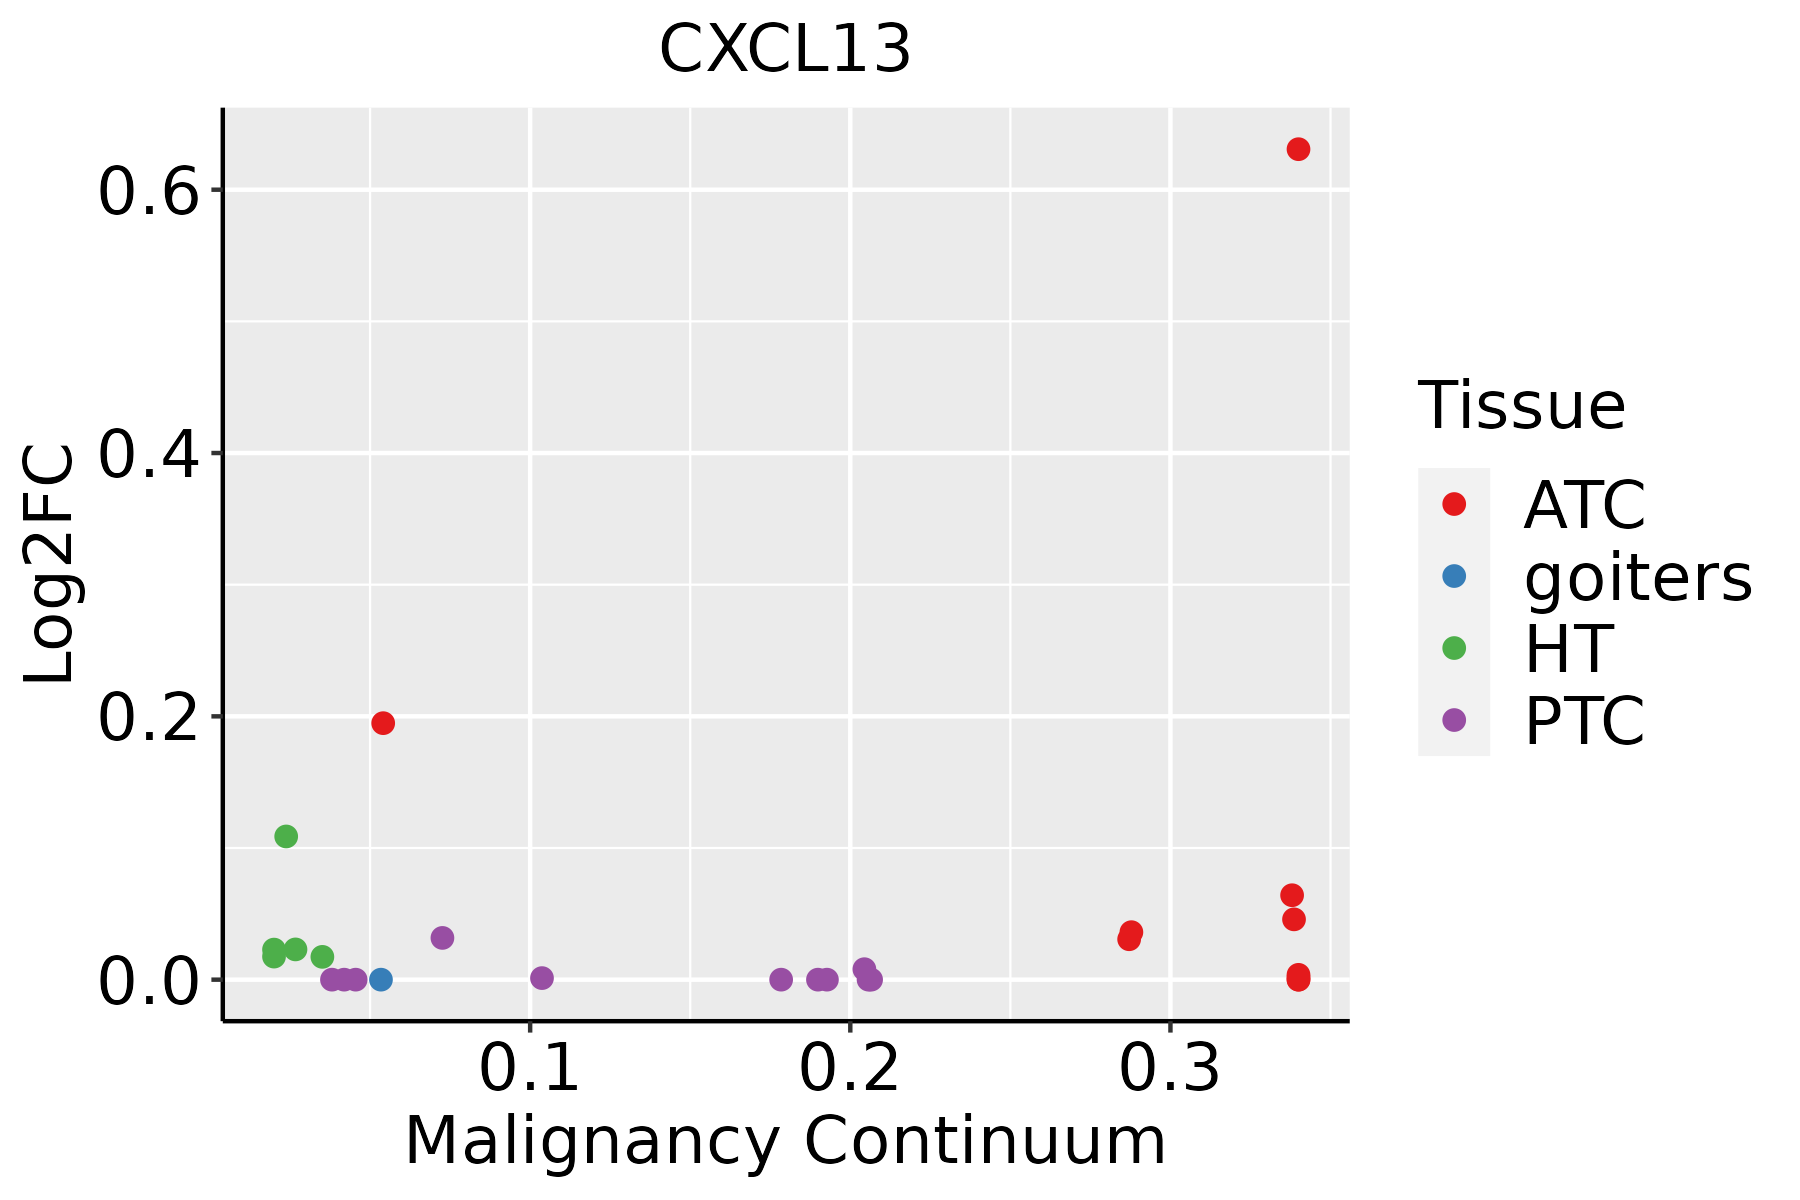 | ATC: Anaplastic thyroid cancer |
| HT: Hashimoto's thyroiditis | ||
| PTC: Papillary thyroid cancer |
| ∗log2FC in expression of this searched gene in stem-like cells from each diseased tissue sample relative to stem-like cells in normal samples in each tissue plotted against the malignancy continuum. Samples are colored based on if they are from different disease stage. |
Top |
Malignant transformation related pathway analysis |
| Find out the enriched GO biological processes and KEGG pathways involved in transition from healthy to precancer to cancer |
| Tissue | Disease Stage | Enriched GO biological Processes |
| Colorectum | AD |  |
| Colorectum | SER |  |
| Colorectum | MSS |  |
| Colorectum | MSI-H |  |
| Colorectum | FAP |  |
| ∗Top 15 enriched GO BP terms are showed in the bar plot of each disease state in each tissue. Each row represents a significant GO biological process which is colored according to the -log10(p.adjust). |
| Page: 1 2 3 4 5 6 7 8 9 |
| GO ID | Tissue | Disease Stage | Description | Gene Ratio | Bg Ratio | pvalue | p.adjust | Count |
| GO:000268511 | Breast | IDC | regulation of leukocyte migration | 33/1434 | 210/18723 | 6.10e-05 | 1.27e-03 | 33 |
| GO:003249612 | Breast | IDC | response to lipopolysaccharide | 47/1434 | 343/18723 | 7.13e-05 | 1.43e-03 | 47 |
| GO:000223712 | Breast | IDC | response to molecule of bacterial origin | 49/1434 | 363/18723 | 7.40e-05 | 1.47e-03 | 49 |
| GO:004354211 | Breast | IDC | endothelial cell migration | 40/1434 | 279/18723 | 8.97e-05 | 1.74e-03 | 40 |
| GO:003210311 | Breast | IDC | positive regulation of response to external stimulus | 54/1434 | 427/18723 | 1.85e-04 | 3.07e-03 | 54 |
| GO:00512712 | Breast | IDC | negative regulation of cellular component movement | 48/1434 | 367/18723 | 1.88e-04 | 3.12e-03 | 48 |
| GO:00457651 | Breast | IDC | regulation of angiogenesis | 45/1434 | 342/18723 | 2.57e-04 | 3.98e-03 | 45 |
| GO:006184411 | Breast | IDC | antimicrobial humoral immune response mediated by antimicrobial peptide | 16/1434 | 79/18723 | 2.75e-04 | 4.24e-03 | 16 |
| GO:007167711 | Breast | IDC | positive regulation of mononuclear cell migration | 14/1434 | 65/18723 | 3.35e-04 | 4.98e-03 | 14 |
| GO:002240712 | Breast | IDC | regulation of cell-cell adhesion | 55/1434 | 448/18723 | 3.43e-04 | 5.07e-03 | 55 |
| GO:19013421 | Breast | IDC | regulation of vasculature development | 45/1434 | 348/18723 | 3.78e-04 | 5.38e-03 | 45 |
| GO:20001462 | Breast | IDC | negative regulation of cell motility | 46/1434 | 359/18723 | 4.01e-04 | 5.60e-03 | 46 |
| GO:00105941 | Breast | IDC | regulation of endothelial cell migration | 33/1434 | 232/18723 | 4.12e-04 | 5.66e-03 | 33 |
| GO:007167511 | Breast | IDC | regulation of mononuclear cell migration | 20/1434 | 115/18723 | 4.35e-04 | 5.90e-03 | 20 |
| GO:007167411 | Breast | IDC | mononuclear cell migration | 29/1434 | 196/18723 | 4.68e-04 | 6.26e-03 | 29 |
| GO:002240912 | Breast | IDC | positive regulation of cell-cell adhesion | 38/1434 | 284/18723 | 5.40e-04 | 6.96e-03 | 38 |
| GO:000268811 | Breast | IDC | regulation of leukocyte chemotaxis | 20/1434 | 122/18723 | 9.46e-04 | 1.08e-02 | 20 |
| GO:00303362 | Breast | IDC | negative regulation of cell migration | 43/1434 | 344/18723 | 1.01e-03 | 1.13e-02 | 43 |
| GO:00069596 | Breast | IDC | humoral immune response | 40/1434 | 317/18723 | 1.25e-03 | 1.33e-02 | 40 |
| GO:00400132 | Breast | IDC | negative regulation of locomotion | 47/1434 | 391/18723 | 1.39e-03 | 1.43e-02 | 47 |
| Page: 1 2 3 4 5 6 7 8 9 10 11 |
| Pathway ID | Tissue | Disease Stage | Description | Gene Ratio | Bg Ratio | pvalue | p.adjust | qvalue | Count |
| Page: 1 |
Top |
Cell-cell communication analysis |
| Identification of potential cell-cell interactions between two cell types and their ligand-receptor pairs for different disease states |
| Ligand | Receptor | LRpair | Pathway | Tissue | Disease Stage |
| CXCL13 | ACKR1 | CXCL13_ACKR1 | CXCL | Breast | DCIS |
| CXCL13 | CXCR3 | CXCL13_CXCR3 | CXCL | Breast | DCIS |
| CXCL13 | ACKR1 | CXCL13_ACKR1 | CXCL | Breast | IDC |
| CXCL13 | CXCR3 | CXCL13_CXCR3 | CXCL | Breast | IDC |
| CXCL13 | ACKR1 | CXCL13_ACKR1 | CXCL | Cervix | ADJ |
| CXCL13 | CXCR3 | CXCL13_CXCR3 | CXCL | Cervix | ADJ |
| CXCL13 | CXCR5 | CXCL13_CXCR5 | CXCL | Cervix | ADJ |
| CXCL13 | ACKR1 | CXCL13_ACKR1 | CXCL | Cervix | CC |
| CXCL13 | CXCR3 | CXCL13_CXCR3 | CXCL | Cervix | CC |
| CXCL13 | ACKR1 | CXCL13_ACKR1 | CXCL | CRC | MSI-H |
| CXCL13 | ACKR1 | CXCL13_ACKR1 | CXCL | CRC | MSS |
| CXCL13 | ACKR1 | CXCL13_ACKR1 | CXCL | Endometrium | AEH |
| CXCL13 | CXCR3 | CXCL13_CXCR3 | CXCL | Endometrium | AEH |
| CXCL13 | CXCR5 | CXCL13_CXCR5 | CXCL | Endometrium | AEH |
| CXCL13 | ACKR1 | CXCL13_ACKR1 | CXCL | Endometrium | EEC |
| CXCL13 | ACKR1 | CXCL13_ACKR1 | CXCL | Esophagus | ESCC |
| CXCL13 | CXCR5 | CXCL13_CXCR5 | CXCL | Esophagus | ESCC |
| CXCL13 | ACKR1 | CXCL13_ACKR1 | CXCL | HNSCC | Healthy |
| CXCL13 | CXCR3 | CXCL13_CXCR3 | CXCL | HNSCC | Healthy |
| CXCL13 | ACKR1 | CXCL13_ACKR1 | CXCL | HNSCC | Precancer |
| Page: 1 2 |
Top |
Single-cell gene regulatory network inference analysis |
| Find out the significant the regulons (TFs) and the target genes of each regulon across cell types for different disease states |
| TF | Cell Type | Tissue | Disease Stage | Target Gene | RSS | Regulon Activity |
| ∗The dot plots of a searched regulon are shown for all cell subpopulations in each disease state of each tissue based on the regulon specific score inferred using pySCENIC and by calculating the average expression. |
| Page: 1 |
Top |
Somatic mutation of malignant transformation related genes |
| Annotation of somatic variants for genes involved in malignant transformation |
| Hugo Symbol | Variant Class | Variant Classification | dbSNP RS | HGVSc | HGVSp | HGVSp Short | SWISSPROT | BIOTYPE | SIFT | PolyPhen | Tumor Sample Barcode | Tissue | Histology | Sex | Age | Stage | Therapy Types | Drugs | Outcome |
| CXCL13 | SNV | Missense_Mutation | rs746262587 | c.14N>T | p.Ser5Leu | p.S5L | O43927 | protein_coding | tolerated(0.27) | benign(0) | TCGA-AX-A05Z-01 | Endometrium | uterine corpus endometrioid carcinoma | Female | <65 | III/IV | Chemotherapy | adriamycin | SD |
| CXCL13 | SNV | Missense_Mutation | c.185G>T | p.Arg62Ile | p.R62I | O43927 | protein_coding | tolerated(0.09) | possibly_damaging(0.892) | TCGA-D1-A17Q-01 | Endometrium | uterine corpus endometrioid carcinoma | Female | <65 | I/II | Unknown | Unknown | SD | |
| CXCL13 | SNV | Missense_Mutation | c.185G>T | p.Arg62Ile | p.R62I | O43927 | protein_coding | tolerated(0.09) | possibly_damaging(0.892) | TCGA-E6-A1LX-01 | Endometrium | uterine corpus endometrioid carcinoma | Female | <65 | I/II | Unknown | Unknown | SD | |
| CXCL13 | SNV | Missense_Mutation | novel | c.194N>C | p.Ile65Thr | p.I65T | O43927 | protein_coding | deleterious(0) | probably_damaging(0.978) | TCGA-5R-AA1C-01 | Liver | liver hepatocellular carcinoma | Male | <65 | I/II | Unknown | Unknown | SD |
| CXCL13 | SNV | Missense_Mutation | novel | c.109N>A | p.Gln37Lys | p.Q37K | O43927 | protein_coding | tolerated(0.87) | benign(0.066) | TCGA-CR-7388-01 | Oral cavity | head & neck squamous cell carcinoma | Female | >=65 | I/II | Chemotherapy | carboplatin | PD |
| CXCL13 | SNV | Missense_Mutation | rs150188610 | c.166C>A | p.Arg56Ser | p.R56S | O43927 | protein_coding | tolerated(0.06) | benign(0.236) | TCGA-CV-7252-01 | Oral cavity | head & neck squamous cell carcinoma | Female | <65 | I/II | Unknown | Unknown | PD |
| CXCL13 | SNV | Missense_Mutation | c.279A>T | p.Lys93Asn | p.K93N | O43927 | protein_coding | tolerated(0.08) | benign(0.293) | TCGA-EM-A2CR-01 | Thyroid | thyroid carcinoma | Female | <65 | I/II | Unknown | Unknown | SD | |
| CXCL13 | insertion | Frame_Shift_Ins | novel | c.95_96insTATTTTCAAAT | p.Arg32SerfsTer39 | p.R32Sfs*39 | O43927 | protein_coding | TCGA-FY-A4B0-01 | Thyroid | thyroid carcinoma | Male | >=65 | I/II | Hormone Therapy | synthroid | SD |
| Page: 1 |
Top |
Related drugs of malignant transformation related genes |
| Identification of chemicals and drugs interact with genes involved in malignant transfromation |
| (DGIdb 4.0) |
| Entrez ID | Symbol | Category | Interaction Types | Drug Claim Name | Drug Name | PMIDs |
| 10563 | CXCL13 | DRUGGABLE GENOME | rituximab | RITUXIMAB | 26384320 |
| Page: 1 |

Copyright 2023-Present -The University of Texas Health Science Center at Houston |