Schematic overview of the cellular and molecular mechanisms involved in the cancer progression, including the proposed cellular and molecular mechanisms in cancer cells trajectory. AT1: alveolar type 1 cells; AT2: alveolar type 2 cells; AAH: atypical adenomatous hyperplasia; AIS: adenocarcinoma in situ; MIA: minimally invasive adenocarcinoma; IA: invasive adenocarcinoma; EMT: epithelial-mesenchymal transition

Home

Download

Statistics

Help

Contact

Center for Computational Systems Medicine
leaf

Gene summary

leaf

Malignant transformation analysis

leaf

Malignant transformation related pathway analysis

leaf

Cell-cell communication analysis

leaf

Single-cell gene regulatory network inference analysis

leaf

Somatic mutation of malignant transformation related genes

leaf

Related drugs of malignant transformation related genes

Gene: CTR9

Gene summary for CTR9

check button Gene summary.

Gene informationSpeciesHuman
Gene symbol

CTR9

Gene ID

9646

Gene nameCTR9 homolog, Paf1/RNA polymerase II complex component
Gene AliasSH2BP1
Cytomap11p15.4
Gene Typeprotein-coding
GO ID

GO:0000122

UniProtAcc

Q6PD62


Top

Malignant transformation analysis

check button Identification of the aberrant gene expression in precancerous and cancerous lesions by comparing the gene expression of stem-like cells in diseased tissues with normal stem cells
check button Malignant transformation involving gene list.
Entrez IDSymbolReplicatesSpeciesOrganTissueAdj P-valueLog2FCMalignancy
9646CTR9LZE4THumanEsophagusESCC3.11e-083.17e-010.0811
9646CTR9LZE7THumanEsophagusESCC2.34e-102.08e-010.0667
9646CTR9LZE8THumanEsophagusESCC1.53e-04-8.57e-020.067
9646CTR9LZE20THumanEsophagusESCC1.17e-024.91e-020.0662
9646CTR9LZE22THumanEsophagusESCC1.05e-022.73e-020.068
9646CTR9LZE24THumanEsophagusESCC1.63e-133.91e-010.0596
9646CTR9LZE21THumanEsophagusESCC3.49e-039.21e-040.0655
9646CTR9P1T-EHumanEsophagusESCC5.18e-071.12e-010.0875
9646CTR9P2T-EHumanEsophagusESCC3.63e-184.19e-010.1177
9646CTR9P4T-EHumanEsophagusESCC7.03e-183.32e-010.1323
9646CTR9P5T-EHumanEsophagusESCC5.15e-085.54e-020.1327
9646CTR9P8T-EHumanEsophagusESCC1.34e-214.24e-020.0889
9646CTR9P9T-EHumanEsophagusESCC1.19e-192.79e-010.1131
9646CTR9P10T-EHumanEsophagusESCC2.05e-162.87e-010.116
9646CTR9P11T-EHumanEsophagusESCC3.35e-117.81e-010.1426
9646CTR9P12T-EHumanEsophagusESCC5.41e-174.99e-020.1122
9646CTR9P15T-EHumanEsophagusESCC2.29e-225.11e-010.1149
9646CTR9P16T-EHumanEsophagusESCC1.81e-162.88e-010.1153
9646CTR9P17T-EHumanEsophagusESCC9.99e-061.90e-010.1278
9646CTR9P20T-EHumanEsophagusESCC1.17e-152.89e-010.1124
Page: 1 2 3 4 5 6 

check button Transcriptomic changes along malignancy continuum.
TissueExpression DynamicsAbbreviation
EsophagusThe image shows the transcriptomic changes along malignancy continuum.log2FC in expression of this searched gene in stem-like cells from each diseased tissue sample relative to stem-like cells in normal samples in each tissue plotted against the malignancy continuum. Samples are colored based on if they are from different disease stage.
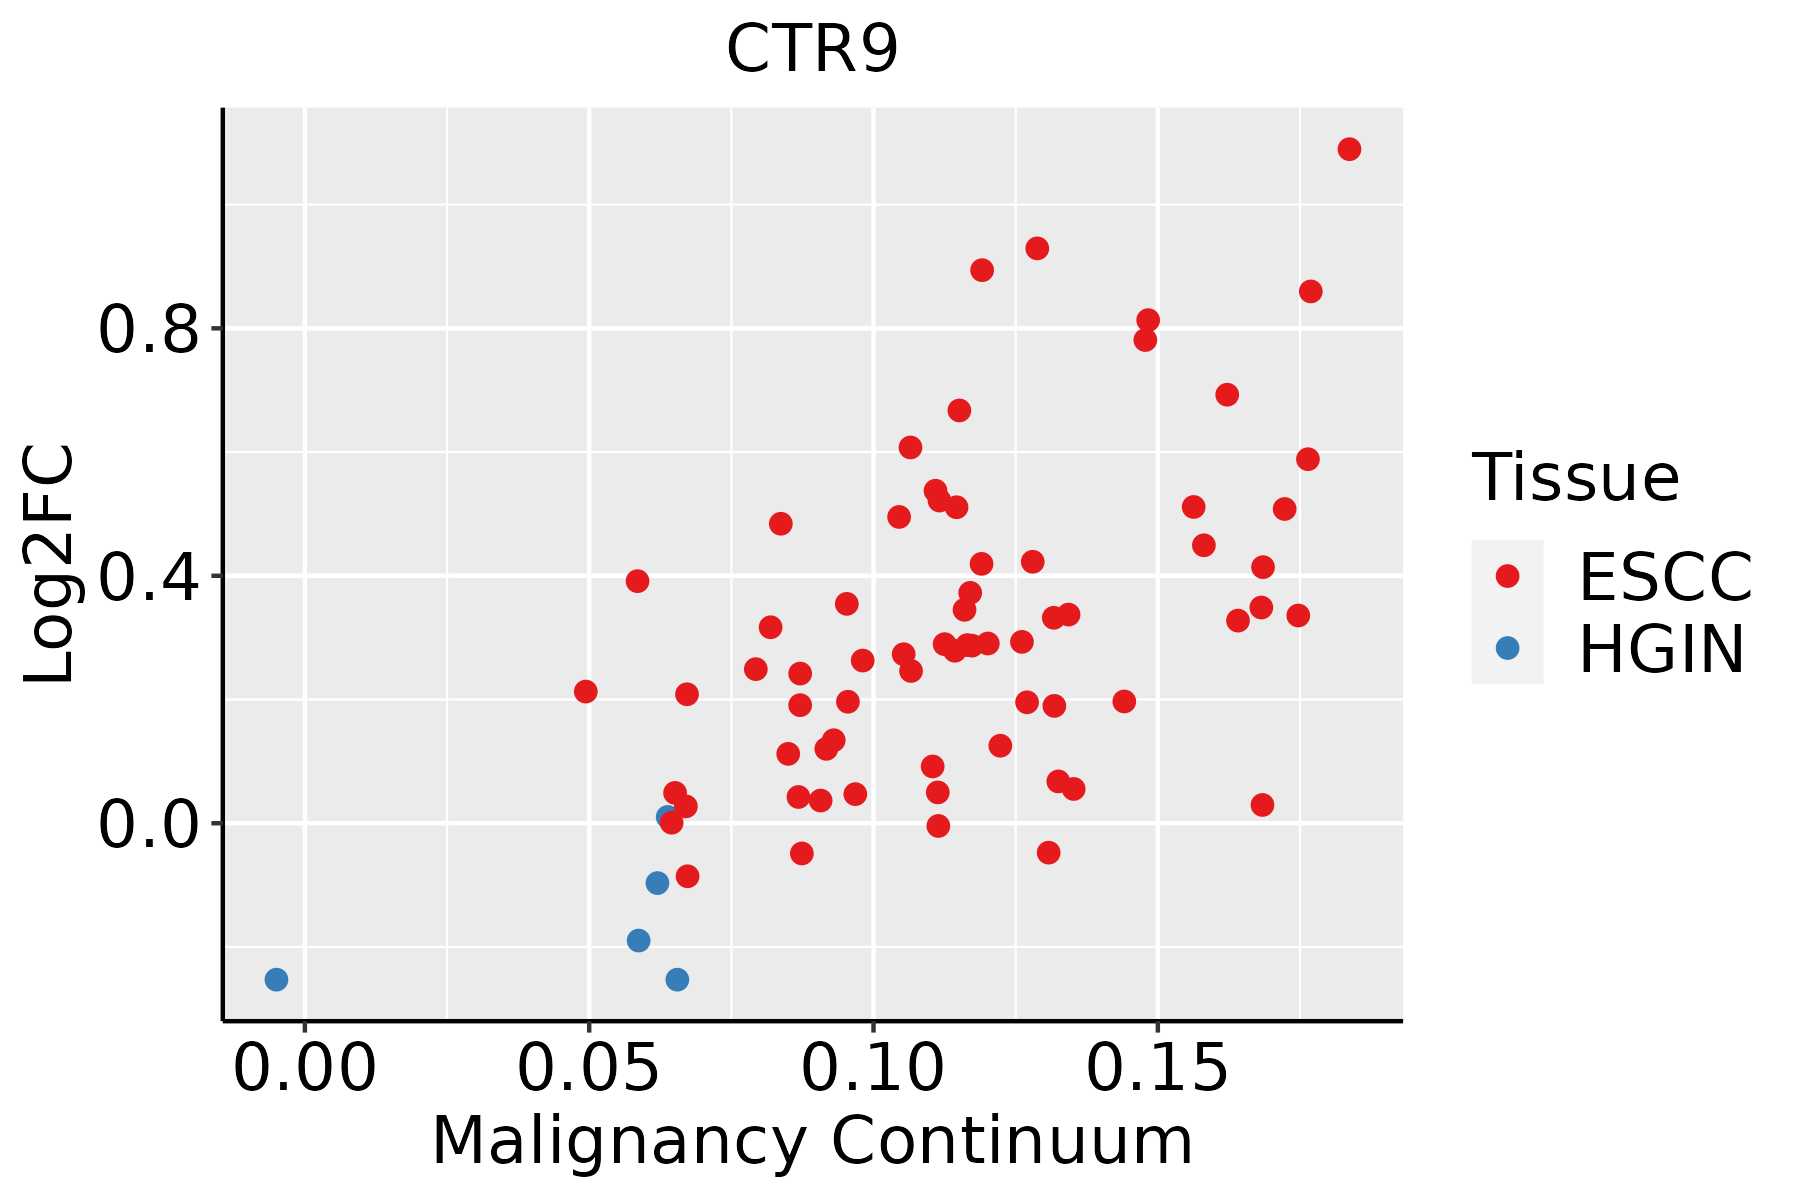
ESCC: Esophageal squamous cell carcinoma
HGIN: High-grade intraepithelial neoplasias
LGIN: Low-grade intraepithelial neoplasias
LiverThe image shows the transcriptomic changes along malignancy continuum.log2FC in expression of this searched gene in stem-like cells from each diseased tissue sample relative to stem-like cells in normal samples in each tissue plotted against the malignancy continuum. Samples are colored based on if they are from different disease stage.
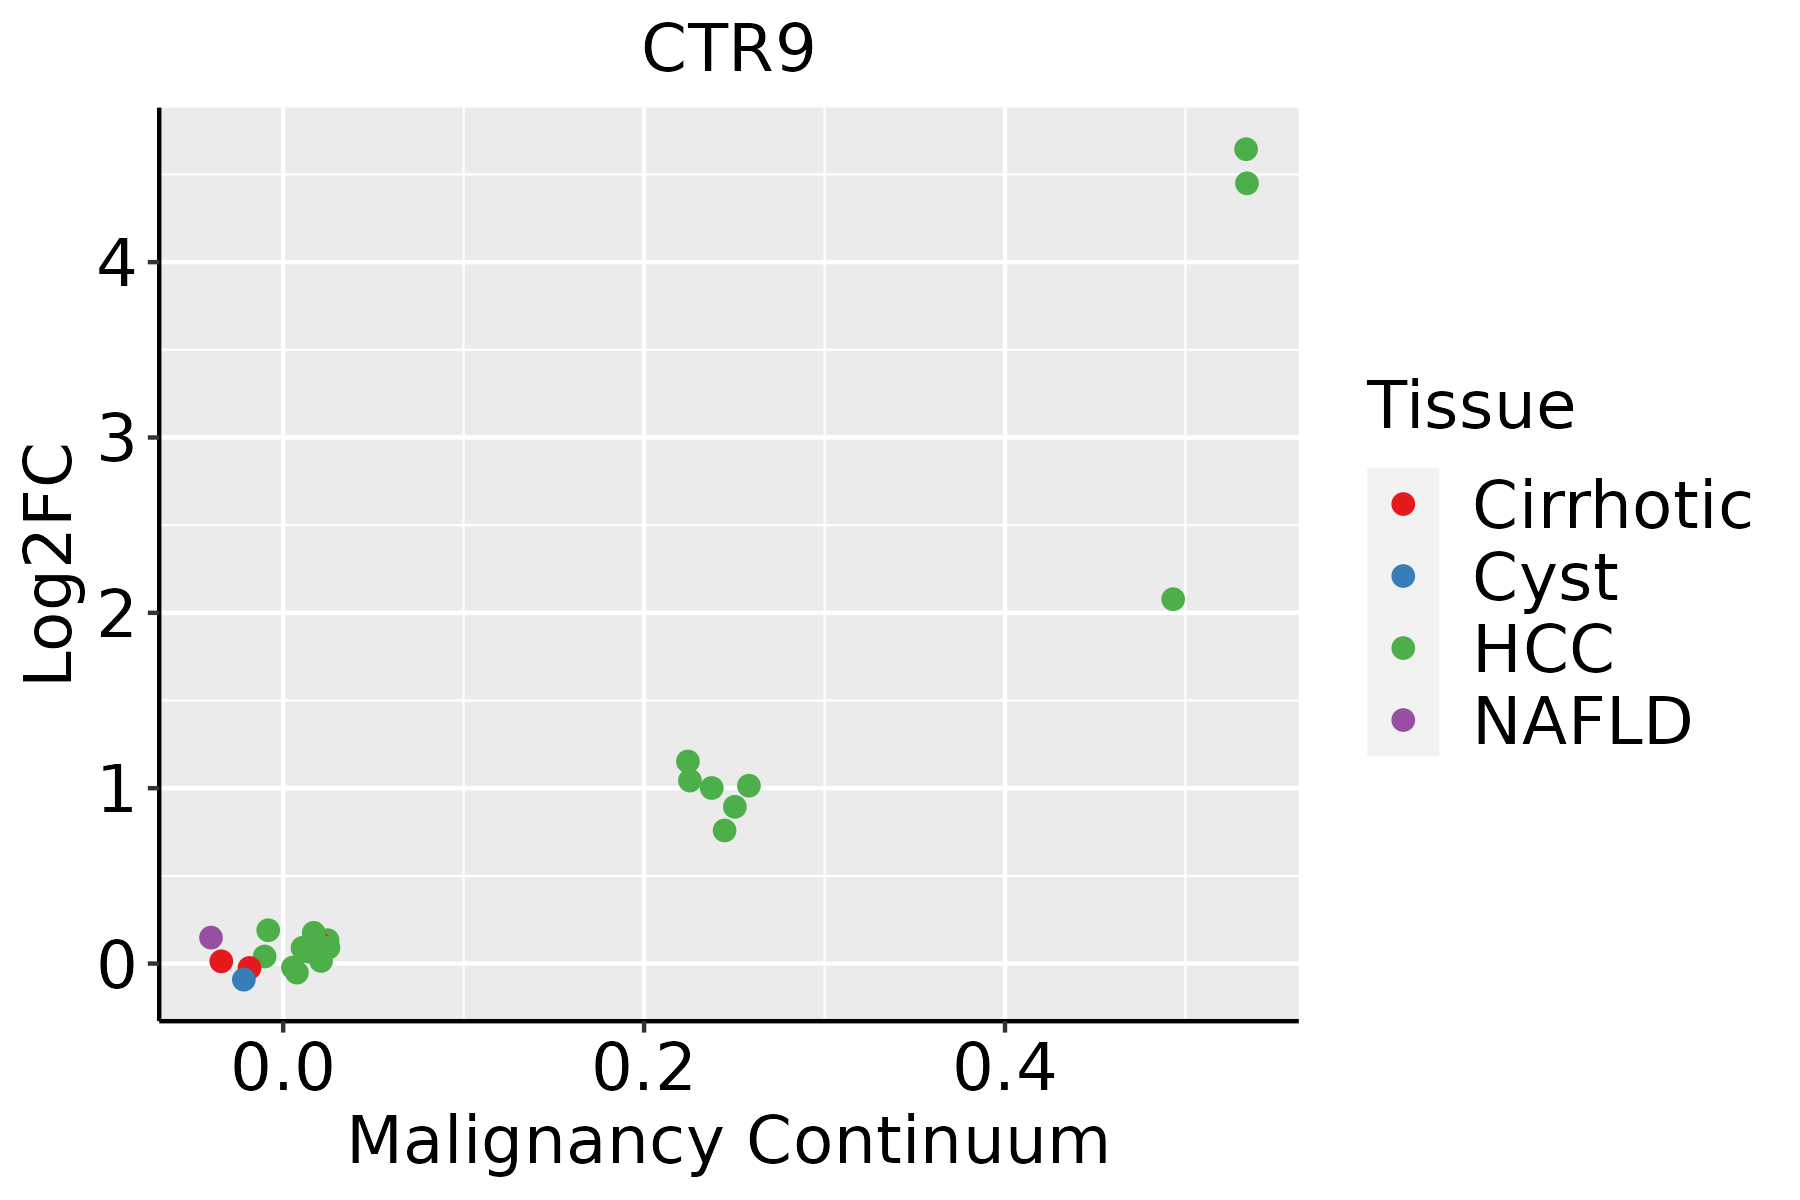
HCC: Hepatocellular carcinoma
NAFLD: Non-alcoholic fatty liver disease
Oral CavityThe image shows the transcriptomic changes along malignancy continuum.log2FC in expression of this searched gene in stem-like cells from each diseased tissue sample relative to stem-like cells in normal samples in each tissue plotted against the malignancy continuum. Samples are colored based on if they are from different disease stage.
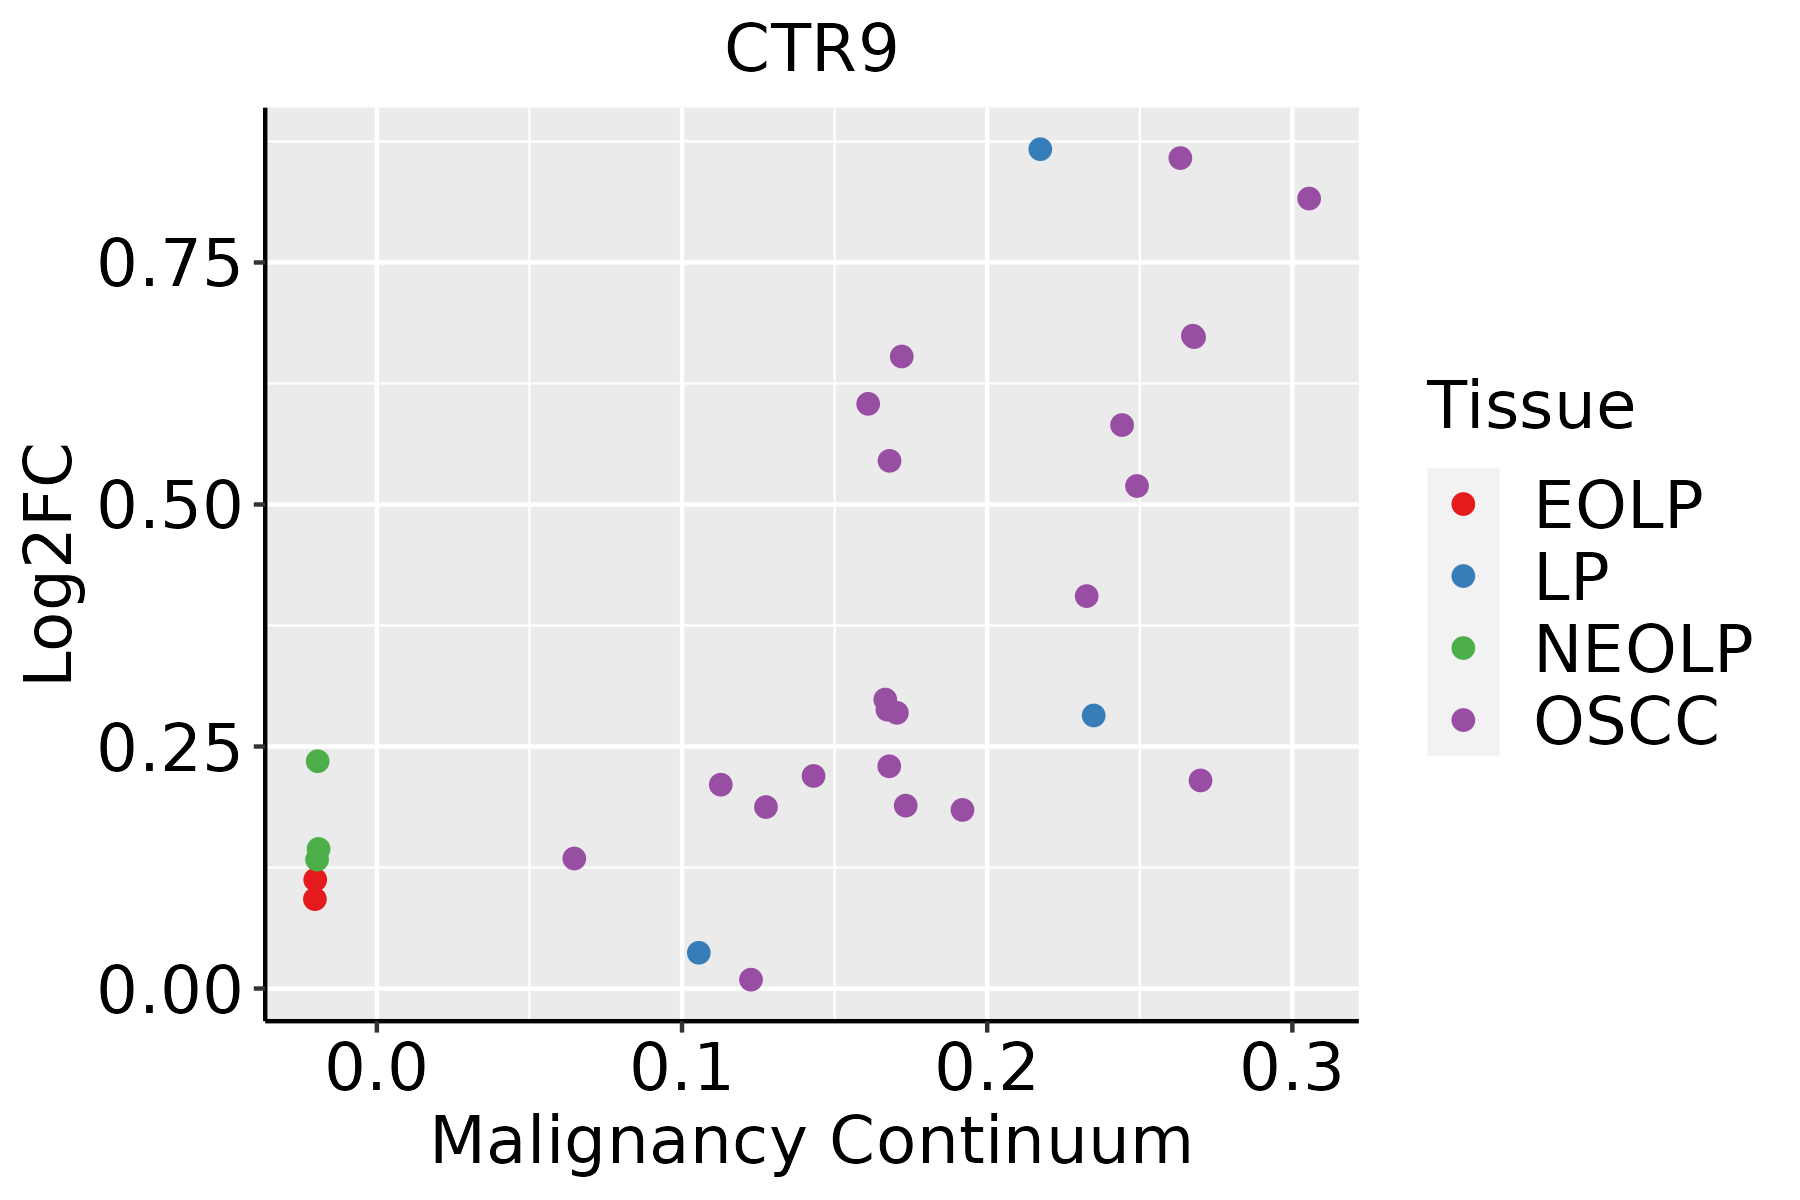
EOLP: Erosive Oral lichen planus
LP: leukoplakia
NEOLP: Non-erosive oral lichen planus
OSCC: Oral squamous cell carcinoma
ProstateThe image shows the transcriptomic changes along malignancy continuum.log2FC in expression of this searched gene in stem-like cells from each diseased tissue sample relative to stem-like cells in normal samples in each tissue plotted against the malignancy continuum. Samples are colored based on if they are from different disease stage.
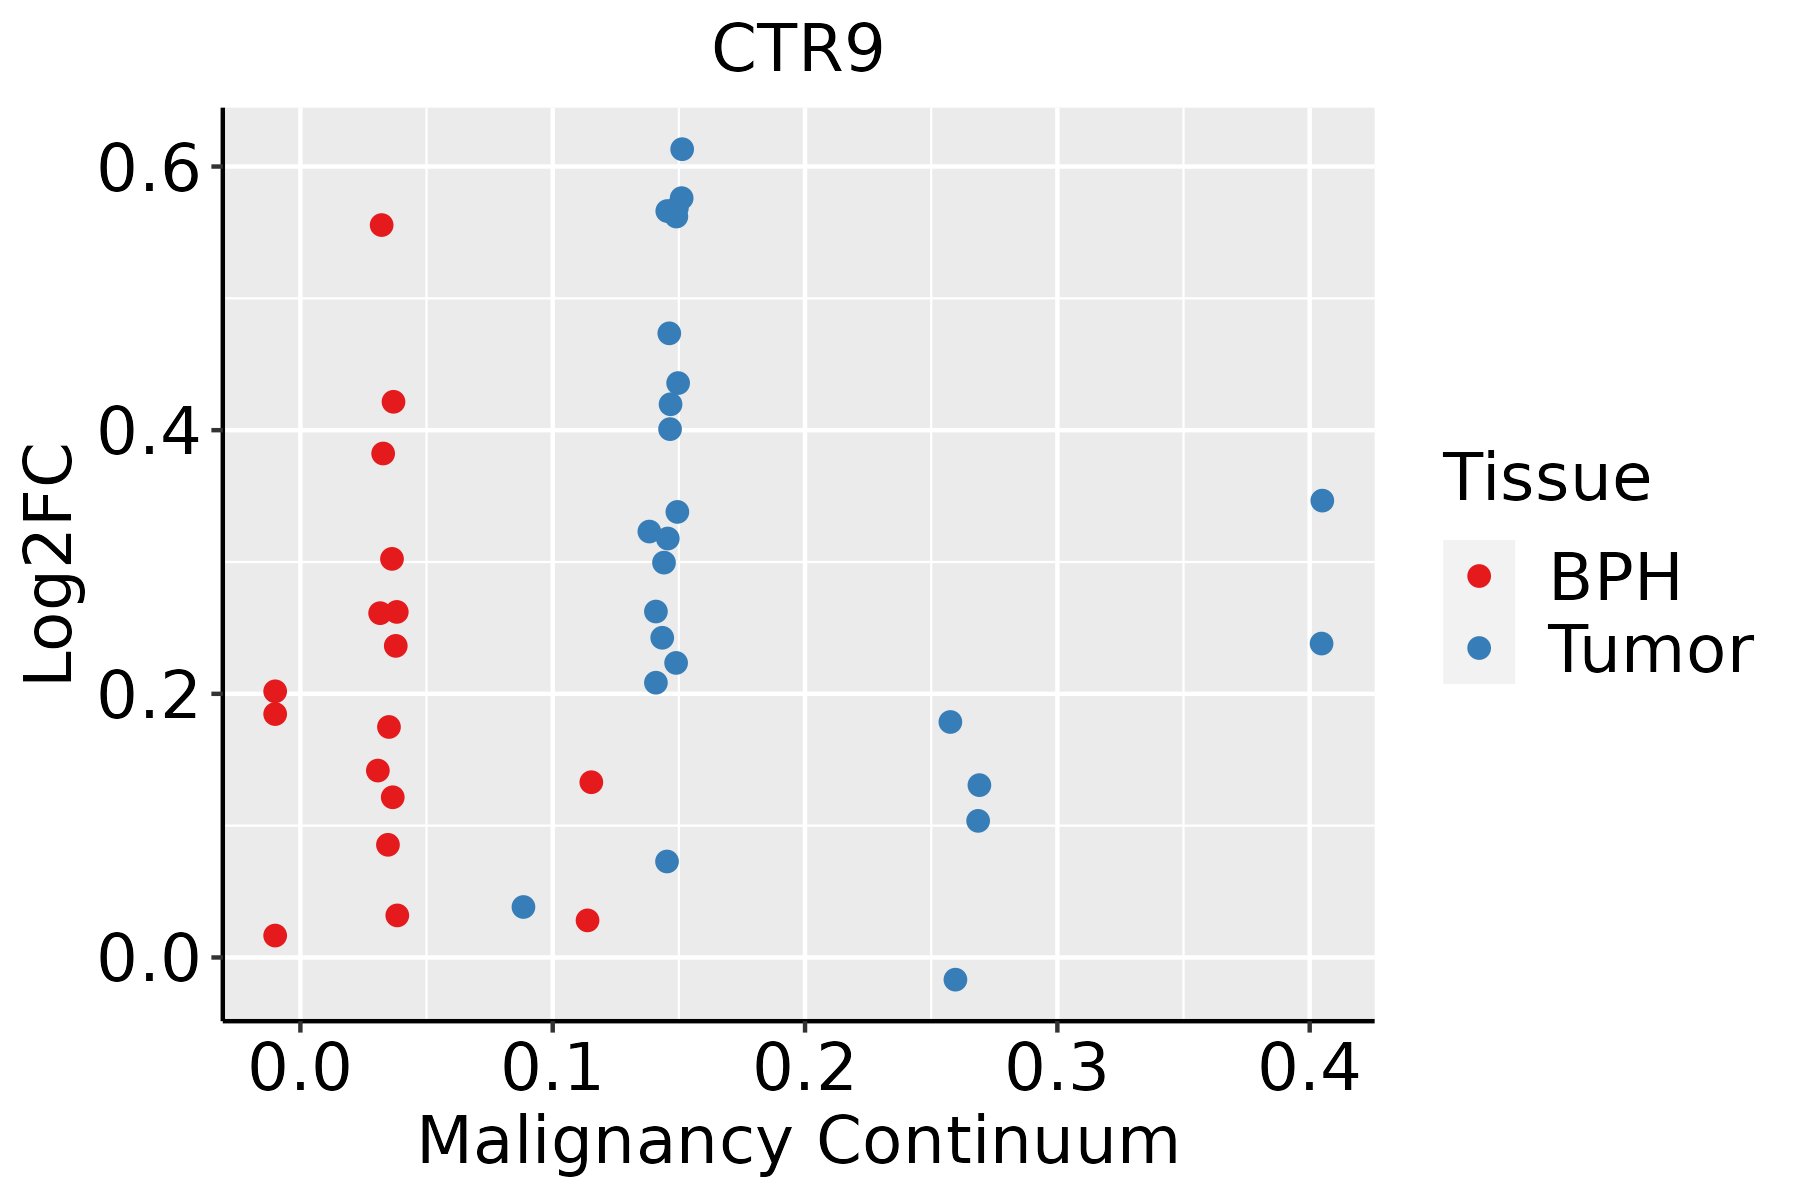
BPH: Benign Prostatic Hyperplasia
SkinThe image shows the transcriptomic changes along malignancy continuum.log2FC in expression of this searched gene in stem-like cells from each diseased tissue sample relative to stem-like cells in normal samples in each tissue plotted against the malignancy continuum. Samples are colored based on if they are from different disease stage.
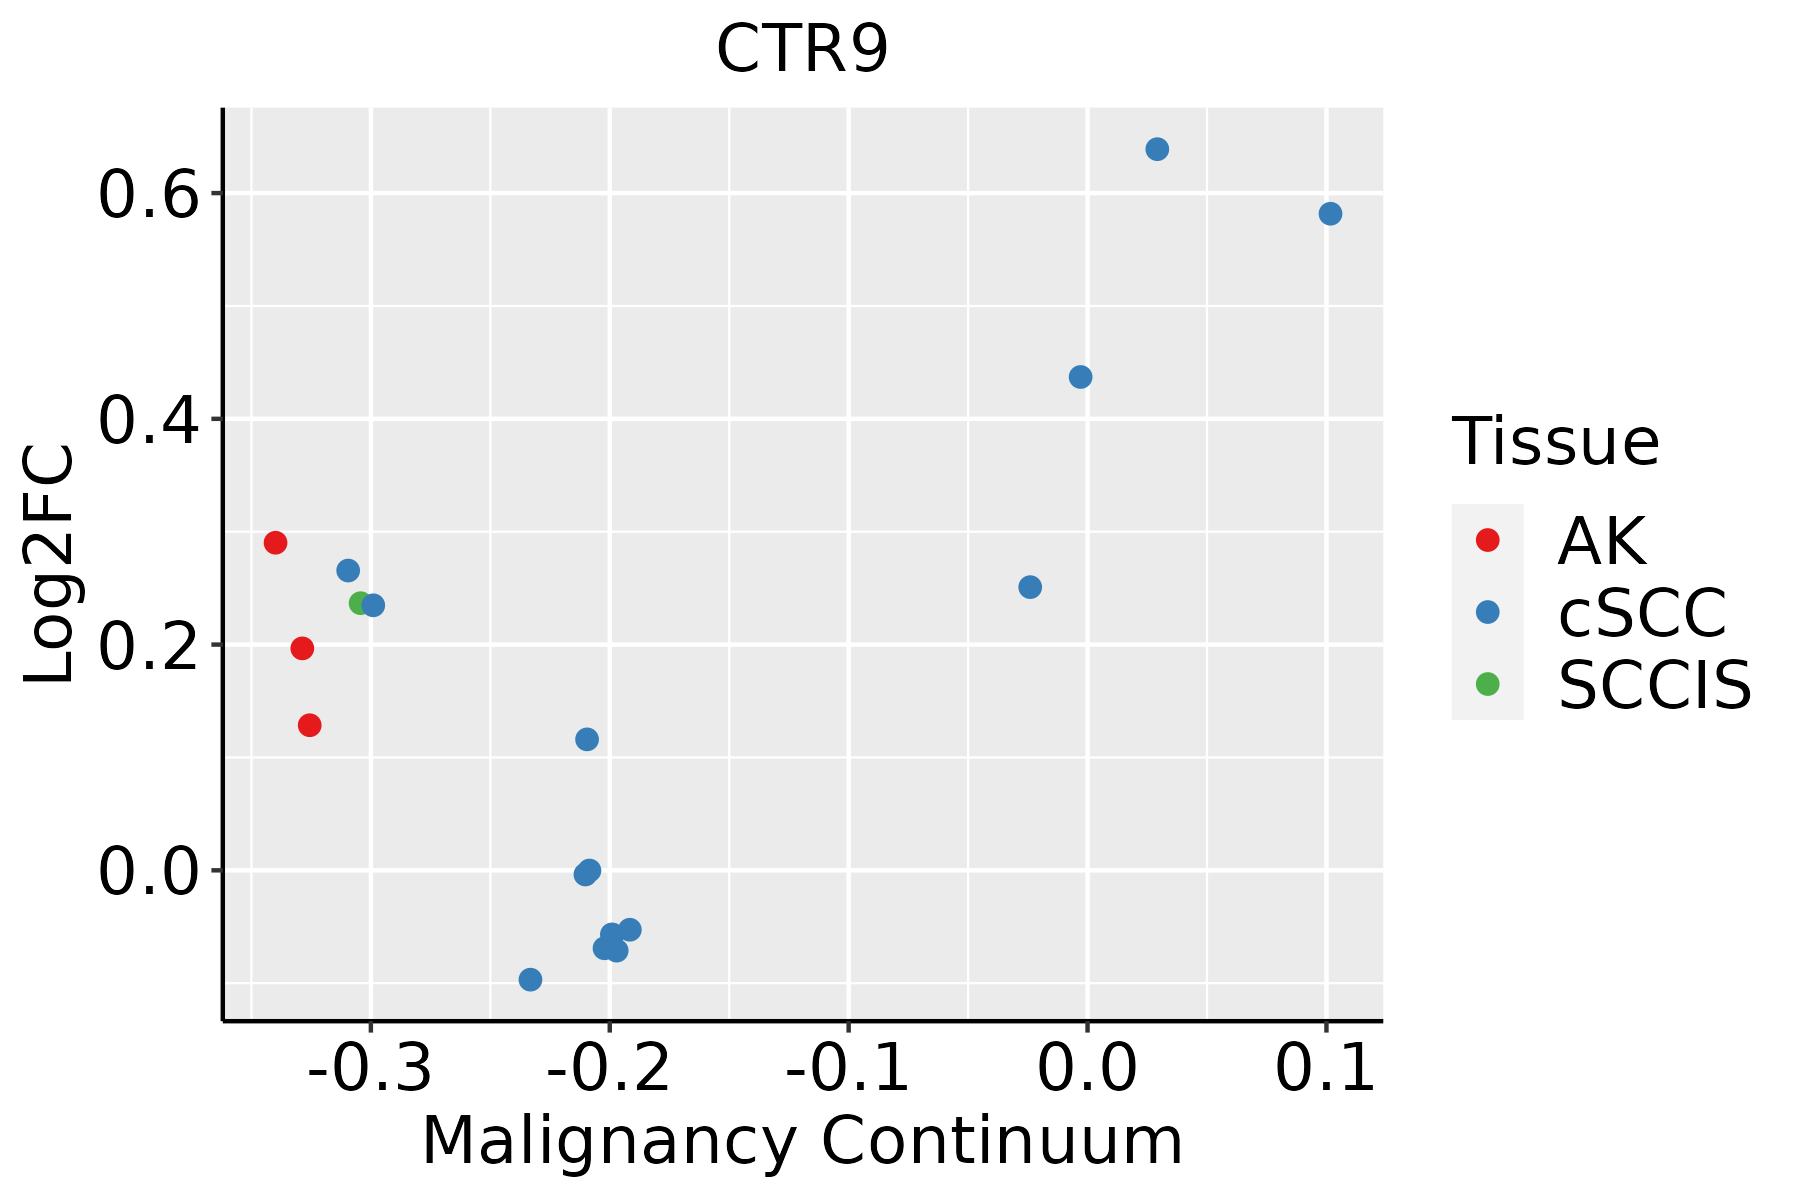
AK: Actinic keratosis
cSCC: Cutaneous squamous cell carcinoma
SCCIS:squamous cell carcinoma in situ
∗log2FC in expression of this searched gene in stem-like cells from each diseased tissue sample relative to stem-like cells in normal samples in each tissue plotted against the malignancy continuum. Samples are colored based on if they are from different disease stage.

Top

Malignant transformation related pathway analysis

check buttonFind out the enriched GO biological processes and KEGG pathways involved in transition from healthy to precancer to cancer
check button Figure of enriched GO biological processes.
TissueDisease StageEnriched GO biological Processes
ColorectumADGO analysis - Figure of enriched GO biological processes: Top 15 enriched GO BP terms are showed in the bar plot of each disease state in each tissue. Each row represents a significant GO biological process which is colored according to the -log10(p.adjust).
ColorectumSERGO analysis - Figure of enriched GO biological processes: Top 15 enriched GO BP terms are showed in the bar plot of each disease state in each tissue. Each row represents a significant GO biological process which is colored according to the -log10(p.adjust).
ColorectumMSSGO analysis - Figure of enriched GO biological processes: Top 15 enriched GO BP terms are showed in the bar plot of each disease state in each tissue. Each row represents a significant GO biological process which is colored according to the -log10(p.adjust).
ColorectumMSI-HGO analysis - Figure of enriched GO biological processes: Top 15 enriched GO BP terms are showed in the bar plot of each disease state in each tissue. Each row represents a significant GO biological process which is colored according to the -log10(p.adjust).
ColorectumFAPGO analysis - Figure of enriched GO biological processes: Top 15 enriched GO BP terms are showed in the bar plot of each disease state in each tissue. Each row represents a significant GO biological process which is colored according to the -log10(p.adjust).
∗Top 15 enriched GO BP terms are showed in the bar plot of each disease state in each tissue. Each row represents a significant GO biological process which is colored according to the -log10(p.adjust).
Page: 1 2 3 4 5 6 7 8 9 

check button Enriched GO biological processes.
GO IDTissueDisease StageDescriptionGene RatioBg Ratiopvaluep.adjustCount
GO:00017015LiverCirrhoticin utero embryonic development134/4634367/187232.78e-076.86e-06134
GO:00182051LiverCirrhoticpeptidyl-lysine modification134/4634376/187231.29e-062.59e-05134
GO:003009912LiverCirrhoticmyeloid cell differentiation135/4634381/187231.69e-063.22e-05135
GO:00506863LiverCirrhoticnegative regulation of mRNA processing19/463429/187234.10e-066.90e-0519
GO:001605511LiverCirrhoticWnt signaling pathway150/4634444/187239.75e-061.42e-04150
GO:190331212LiverCirrhoticnegative regulation of mRNA metabolic process42/463492/187239.99e-061.45e-0442
GO:019873811LiverCirrhoticcell-cell signaling by wnt150/4634446/187231.28e-051.80e-04150
GO:001657011LiverCirrhotichistone modification154/4634463/187231.92e-052.57e-04154
GO:003105611LiverCirrhoticregulation of histone modification59/4634152/187238.28e-059.02e-0459
GO:19033222LiverCirrhoticpositive regulation of protein modification by small protein conjugation or removal52/4634138/187234.91e-043.94e-0352
GO:00324966LiverCirrhoticresponse to lipopolysaccharide111/4634343/187238.15e-045.95e-03111
GO:001982711LiverCirrhoticstem cell population maintenance48/4634131/187231.58e-031.03e-0248
GO:0031398LiverCirrhoticpositive regulation of protein ubiquitination44/4634119/187231.98e-031.23e-0244
GO:001657411LiverCirrhotichistone ubiquitination21/463447/187232.24e-031.36e-0221
GO:00063544LiverCirrhoticDNA-templated transcription, elongation35/463491/187232.56e-031.53e-0235
GO:00063683LiverCirrhotictranscription elongation from RNA polymerase II promoter28/463469/187232.70e-031.58e-0228
GO:009872711LiverCirrhoticmaintenance of cell number48/4634134/187232.70e-031.58e-0248
GO:00022376LiverCirrhoticresponse to molecule of bacterial origin113/4634363/187233.23e-031.81e-02113
GO:0031440LiverCirrhoticregulation of mRNA 3'-end processing14/463428/187233.40e-031.89e-0214
GO:0031123LiverCirrhoticRNA 3'-end processing42/4634116/187233.85e-032.10e-0242
Page: 1 2 3 4 5 6 7 8 9 10 11 12 13 14 15 16 17 18 19 

check button Enriched KEGG pathways.
Pathway IDTissueDisease StageDescriptionGene RatioBg Ratiopvaluep.adjustqvalueCount
Page: 1 

Top

Cell-cell communication analysis

check buttonIdentification of potential cell-cell interactions between two cell types and their ligand-receptor pairs for different disease states
LigandReceptorLRpairPathwayTissueDisease Stage
Page: 1 

Top

Single-cell gene regulatory network inference analysis

check buttonFind out the significant the regulons (TFs) and the target genes of each regulon across cell types for different disease states
TFCell TypeTissueDisease StageTarget GeneRSSRegulon Activity
∗The dot plots of a searched regulon are shown for all cell subpopulations in each disease state of each tissue based on the regulon specific score inferred using pySCENIC and by calculating the average expression.
Page: 1 

Top

Somatic mutation of malignant transformation related genes

check buttonAnnotation of somatic variants for genes involved in malignant transformation
Hugo SymbolVariant ClassVariant ClassificationdbSNP RSHGVScHGVSpHGVSp ShortSWISSPROTBIOTYPESIFTPolyPhenTumor Sample BarcodeTissueHistologySexAgeStageTherapy TypesDrugsOutcome
CTR9SNVMissense_Mutationc.2140C>Gp.His714Aspp.H714DQ6PD62protein_codingdeleterious(0.02)benign(0.003)TCGA-A8-A06O-01Breastbreast invasive carcinomaFemale<65I/IIHormone TherapyletrozoleSD
CTR9SNVMissense_Mutationc.493N>Ap.Ala165Thrp.A165TQ6PD62protein_codingdeleterious(0.01)probably_damaging(0.943)TCGA-AR-A0TZ-01Breastbreast invasive carcinomaFemale<65III/IVUnspecificDoxorubicinPD
CTR9SNVMissense_Mutationc.2311N>Ap.Asp771Asnp.D771NQ6PD62protein_codingtolerated(0.15)benign(0.012)TCGA-AR-A256-01Breastbreast invasive carcinomaFemale<65I/IIChemotherapydoxorubicinPD
CTR9SNVMissense_Mutationrs777109871c.1555N>Gp.Leu519Valp.L519VQ6PD62protein_codingdeleterious(0.03)benign(0.376)TCGA-B6-A0IJ-01Breastbreast invasive carcinomaFemale<65I/IIUnknownUnknownSD
CTR9SNVMissense_Mutationc.2239N>Ap.Ala747Thrp.A747TQ6PD62protein_codingdeleterious(0.01)benign(0.122)TCGA-BH-A0HF-01Breastbreast invasive carcinomaFemale>=65I/IIHormone TherapyarimidexSD
CTR9insertionFrame_Shift_Insnovelc.783_784insACCTTTGp.Tyr262ThrfsTer6p.Y262Tfs*6Q6PD62protein_codingTCGA-AR-A0TU-01Breastbreast invasive carcinomaFemale<65I/IIUnspecificDoxorubicinSD
CTR9insertionNonsense_Mutationnovelc.1373_1374insATAAAAGAGATp.Ala459Terp.A459*Q6PD62protein_codingTCGA-AR-A0U2-01Breastbreast invasive carcinomaFemale<65III/IVHormone TherapytamoxiphenPD
CTR9SNVMissense_Mutationrs760130762c.1427N>Tp.Ala476Valp.A476VQ6PD62protein_codingtolerated(0.28)benign(0.083)TCGA-2W-A8YY-01Cervixcervical & endocervical cancerFemale<65I/IIChemotherapycisplatinCR
CTR9SNVMissense_Mutationc.2732N>Gp.Ser911Cysp.S911CQ6PD62protein_codingdeleterious(0.03)probably_damaging(0.971)TCGA-DR-A0ZM-01Cervixcervical & endocervical cancerFemale<65III/IVUnspecificCisplatinSD
CTR9SNVMissense_Mutationnovelc.2680G>Ap.Glu894Lysp.E894KQ6PD62protein_codingtolerated(0.86)benign(0.05)TCGA-EA-A3HU-01Cervixcervical & endocervical cancerFemale<65I/IIUnknownUnknownSD
Page: 1 2 3 4 5 6 7 8 9 10 11 12 13 

Top

Related drugs of malignant transformation related genes

check buttonIdentification of chemicals and drugs interact with genes involved in malignant transfromation
(DGIdb 4.0)
Entrez IDSymbolCategoryInteraction TypesDrug Claim NameDrug NamePMIDs
Page: 1