
|
|||||
|
 | |
| |
| |
| |
| |
| |
|
Gene: CLNS1A |
Gene summary for CLNS1A |
| Gene information | Species | Human | Gene symbol | CLNS1A | Gene ID | 1207 |
| Gene name | chloride nucleotide-sensitive channel 1A | |
| Gene Alias | CLCI | |
| Cytomap | 11q14.1 | |
| Gene Type | protein-coding | GO ID | GO:0000375 | UniProtAcc | P54105 |
Top |
Malignant transformation analysis |
| Identification of the aberrant gene expression in precancerous and cancerous lesions by comparing the gene expression of stem-like cells in diseased tissues with normal stem cells |
| Entrez ID | Symbol | Replicates | Species | Organ | Tissue | Adj P-value | Log2FC | Malignancy |
| 1207 | CLNS1A | GSM4909281 | Human | Breast | IDC | 6.03e-04 | 3.23e-01 | 0.21 |
| 1207 | CLNS1A | GSM4909282 | Human | Breast | IDC | 4.84e-05 | 2.90e-01 | -0.0288 |
| 1207 | CLNS1A | GSM4909285 | Human | Breast | IDC | 2.83e-02 | 1.90e-01 | 0.21 |
| 1207 | CLNS1A | GSM4909286 | Human | Breast | IDC | 6.08e-10 | 2.97e-01 | 0.1081 |
| 1207 | CLNS1A | GSM4909297 | Human | Breast | IDC | 1.12e-14 | 4.17e-01 | 0.1517 |
| 1207 | CLNS1A | GSM4909298 | Human | Breast | IDC | 1.58e-90 | 1.18e+00 | 0.1551 |
| 1207 | CLNS1A | GSM4909304 | Human | Breast | IDC | 5.62e-10 | 3.98e-01 | 0.1636 |
| 1207 | CLNS1A | GSM4909308 | Human | Breast | IDC | 1.41e-06 | 3.64e-01 | 0.158 |
| 1207 | CLNS1A | GSM4909311 | Human | Breast | IDC | 3.72e-17 | -1.88e-01 | 0.1534 |
| 1207 | CLNS1A | GSM4909312 | Human | Breast | IDC | 3.36e-07 | 1.57e-01 | 0.1552 |
| 1207 | CLNS1A | GSM4909319 | Human | Breast | IDC | 9.64e-25 | -2.02e-01 | 0.1563 |
| 1207 | CLNS1A | GSM4909320 | Human | Breast | IDC | 2.55e-02 | -2.44e-01 | 0.1575 |
| 1207 | CLNS1A | GSM4909321 | Human | Breast | IDC | 7.19e-08 | -7.52e-02 | 0.1559 |
| 1207 | CLNS1A | brca3 | Human | Breast | Precancer | 1.07e-03 | 3.45e-01 | -0.0263 |
| 1207 | CLNS1A | M2 | Human | Breast | IDC | 1.91e-02 | 2.99e-01 | 0.21 |
| 1207 | CLNS1A | M5 | Human | Breast | IDC | 3.49e-17 | 9.60e-01 | 0.1598 |
| 1207 | CLNS1A | NCCBC14 | Human | Breast | DCIS | 3.20e-04 | 1.22e-01 | 0.2021 |
| 1207 | CLNS1A | NCCBC5 | Human | Breast | DCIS | 2.48e-08 | 8.78e-02 | 0.2046 |
| 1207 | CLNS1A | P1 | Human | Breast | IDC | 9.58e-09 | -2.16e-01 | 0.1527 |
| 1207 | CLNS1A | P3 | Human | Breast | IDC | 5.48e-16 | 8.98e-01 | 0.1542 |
| Page: 1 2 3 4 5 6 7 8 |
| Tissue | Expression Dynamics | Abbreviation |
| Breast | 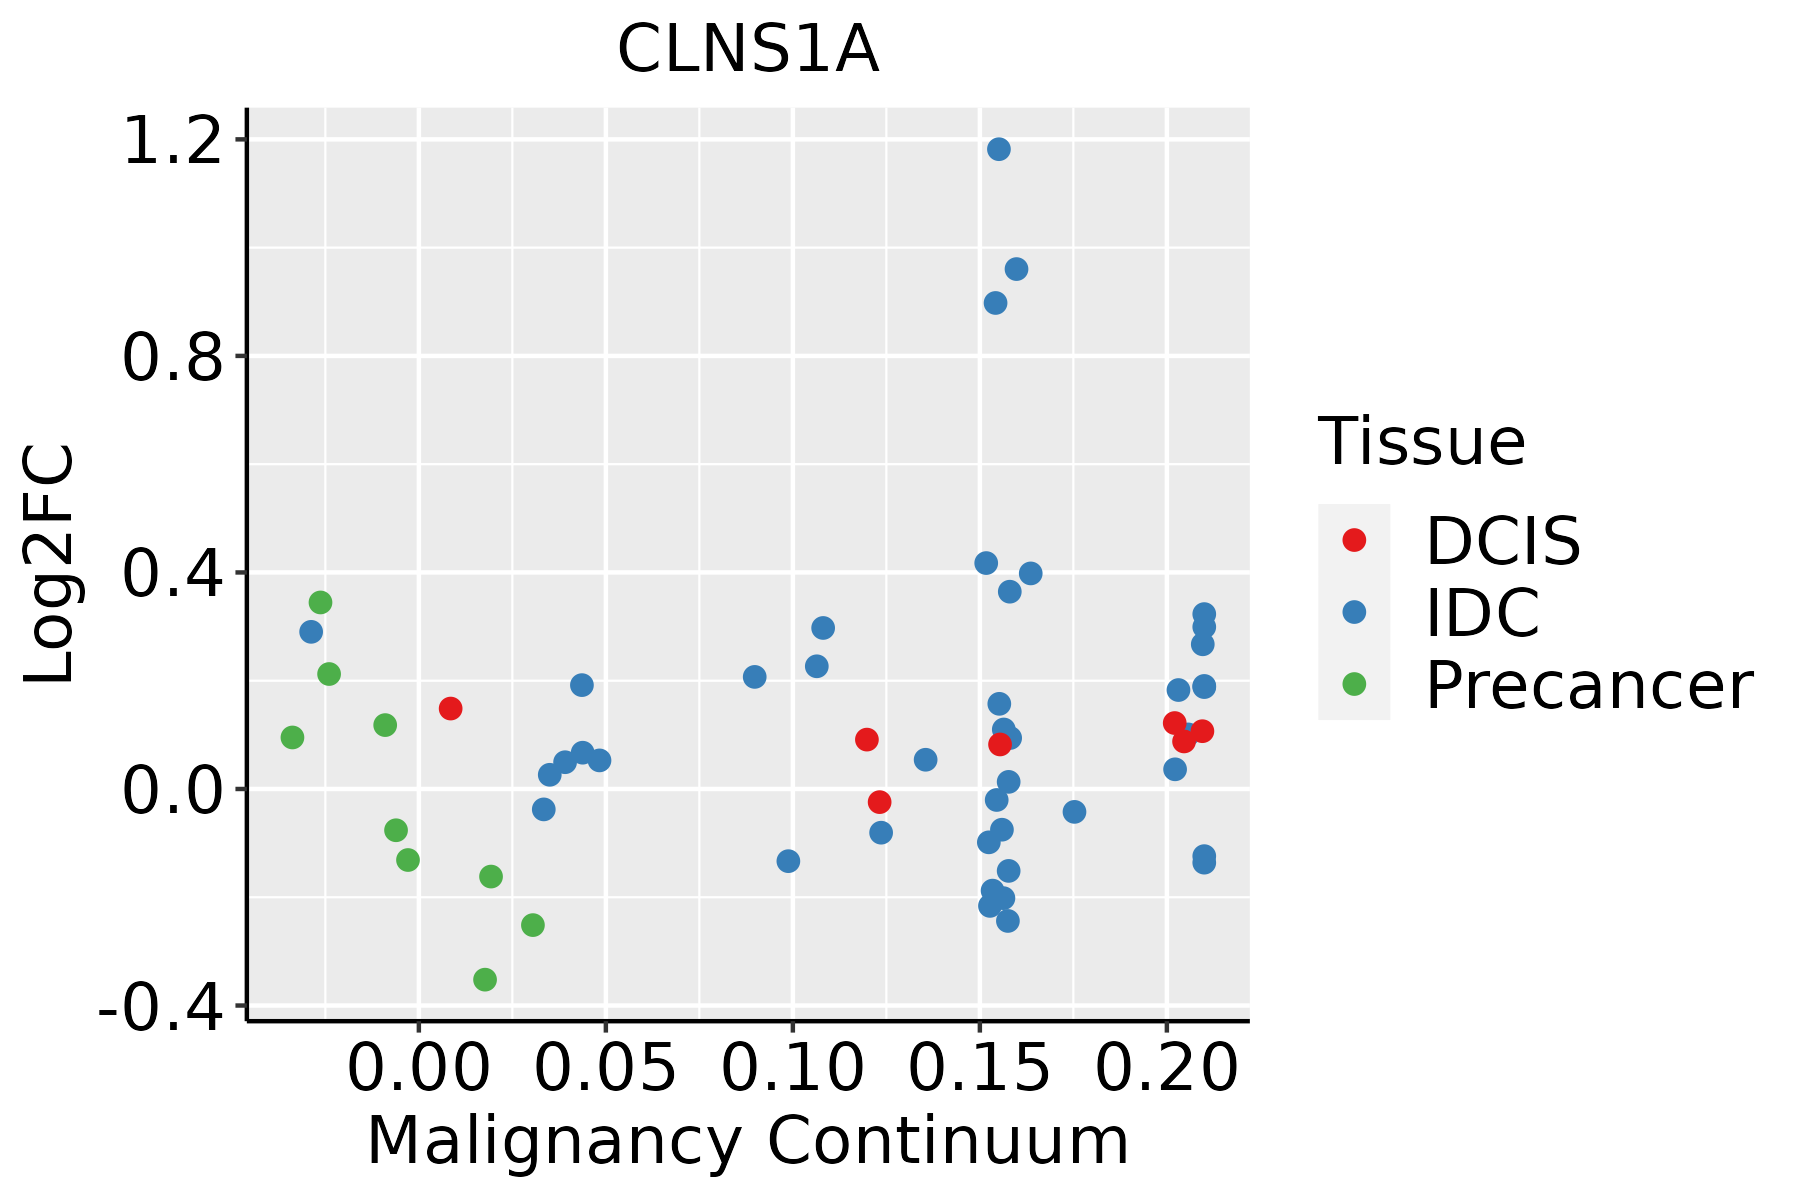 | IDC: Invasive ductal carcinoma |
| DCIS: Ductal carcinoma in situ | ||
| Precancer(BRCA1-mut): Precancerous lesion from BRCA1 mutation carriers | ||
| Esophagus |  | ESCC: Esophageal squamous cell carcinoma |
| HGIN: High-grade intraepithelial neoplasias | ||
| LGIN: Low-grade intraepithelial neoplasias | ||
| Liver | 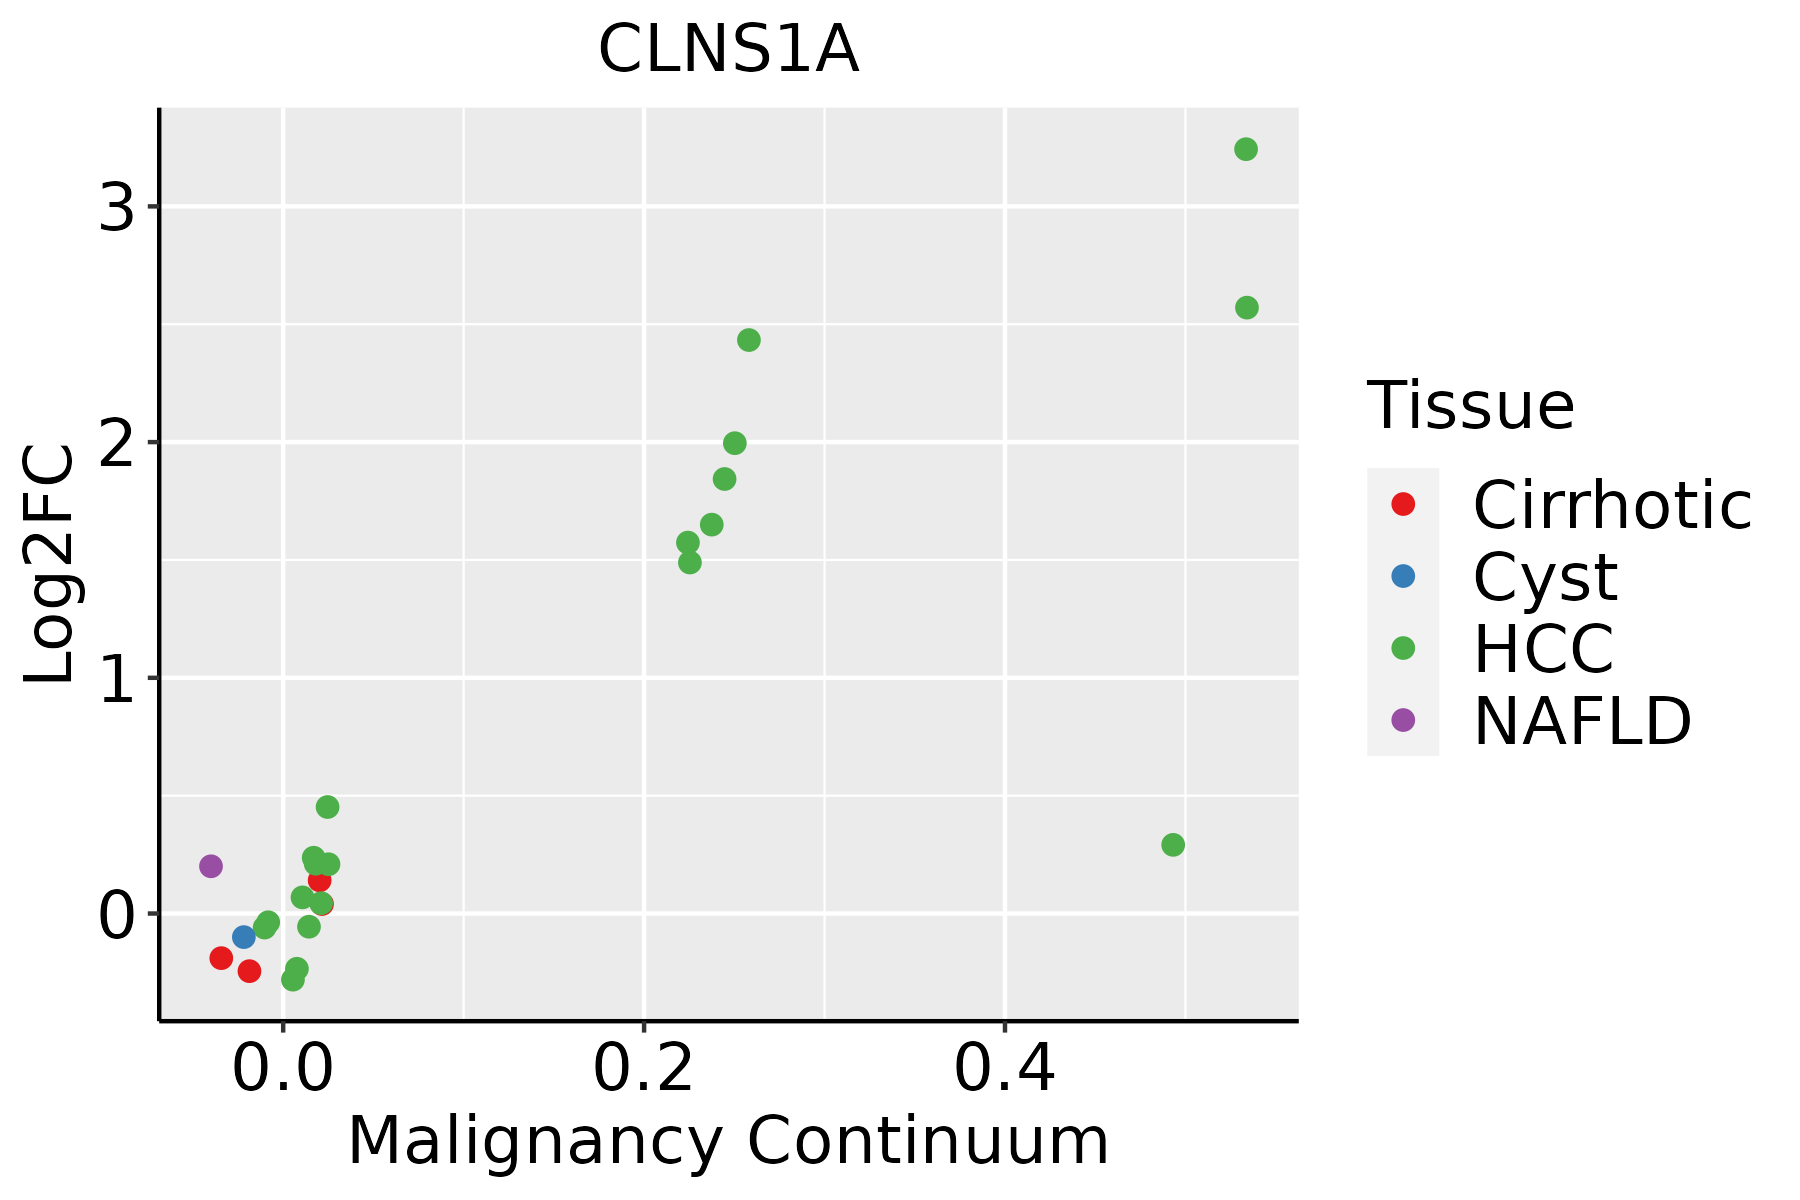 | HCC: Hepatocellular carcinoma |
| NAFLD: Non-alcoholic fatty liver disease | ||
| Oral Cavity | 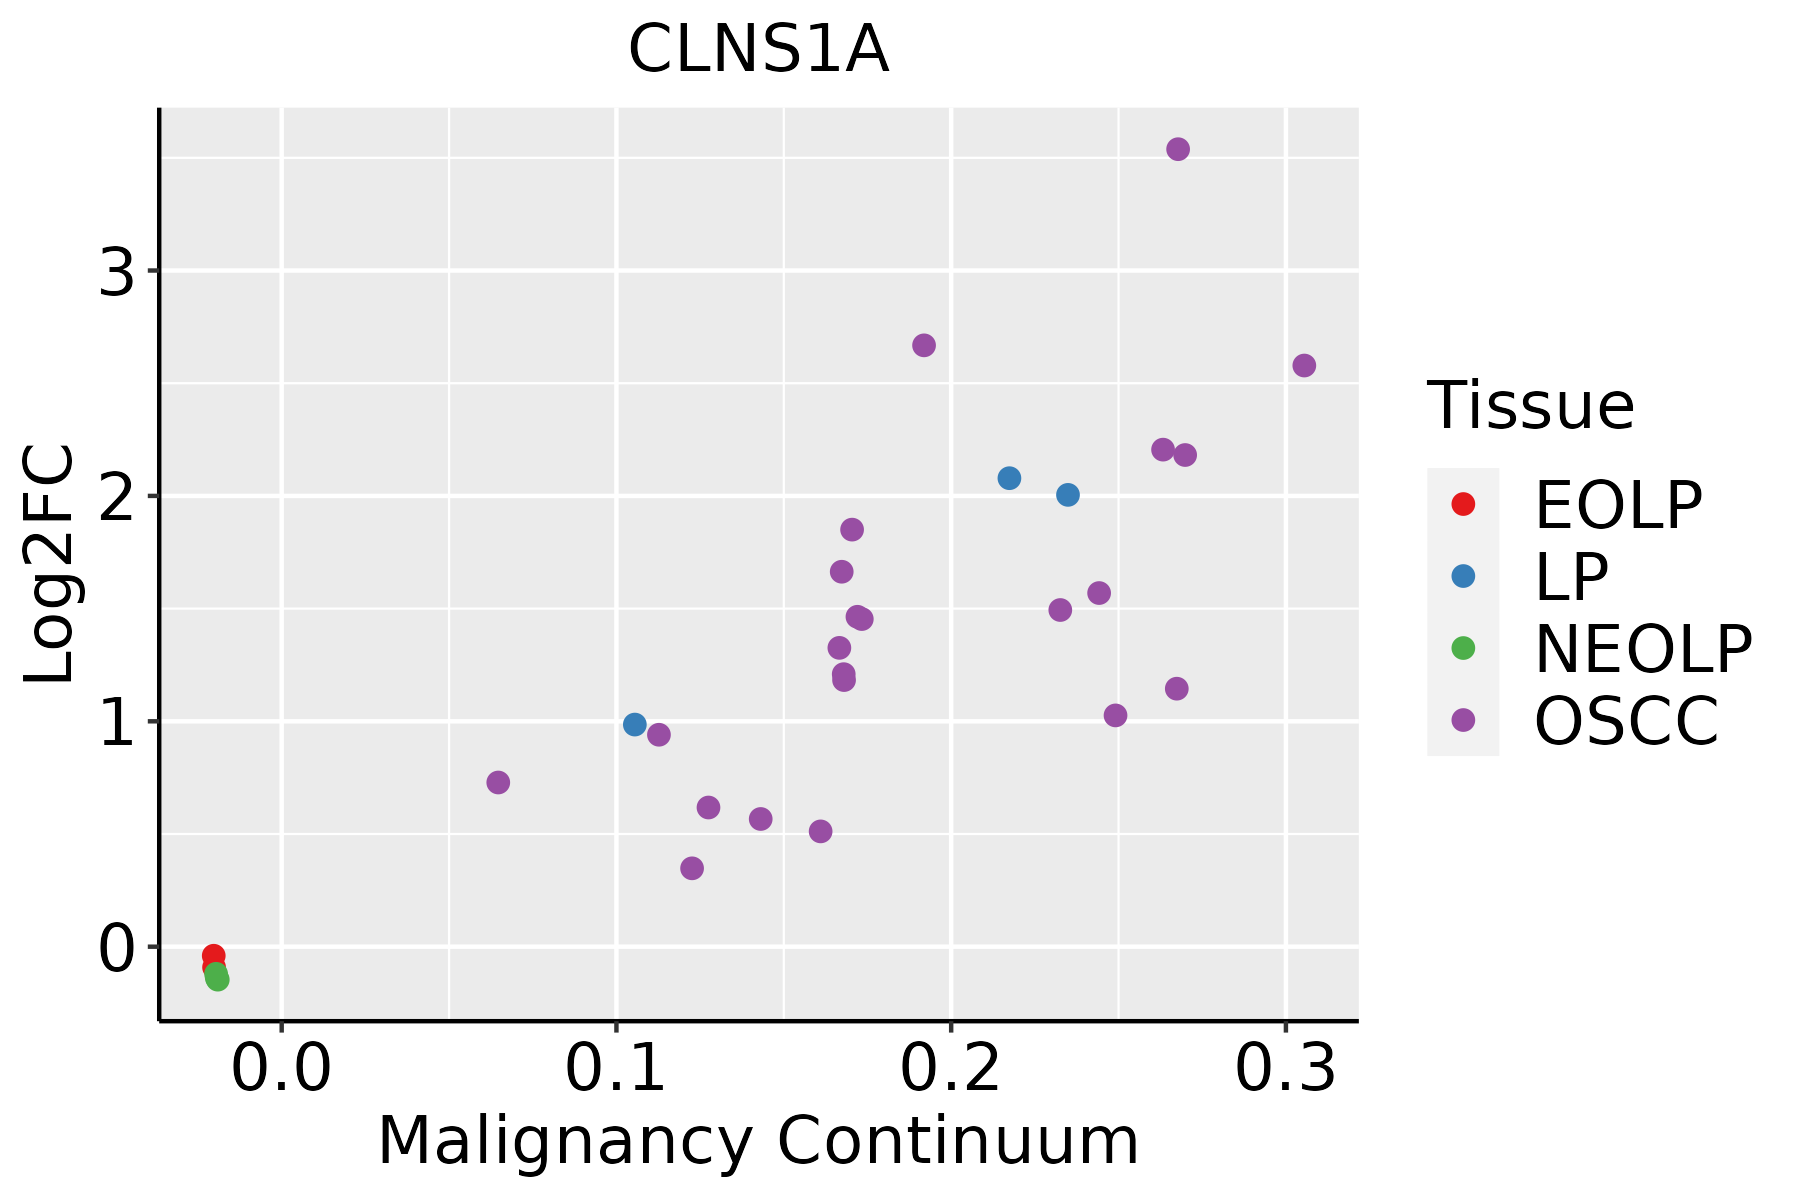 | EOLP: Erosive Oral lichen planus |
| LP: leukoplakia | ||
| NEOLP: Non-erosive oral lichen planus | ||
| OSCC: Oral squamous cell carcinoma | ||
| Skin | 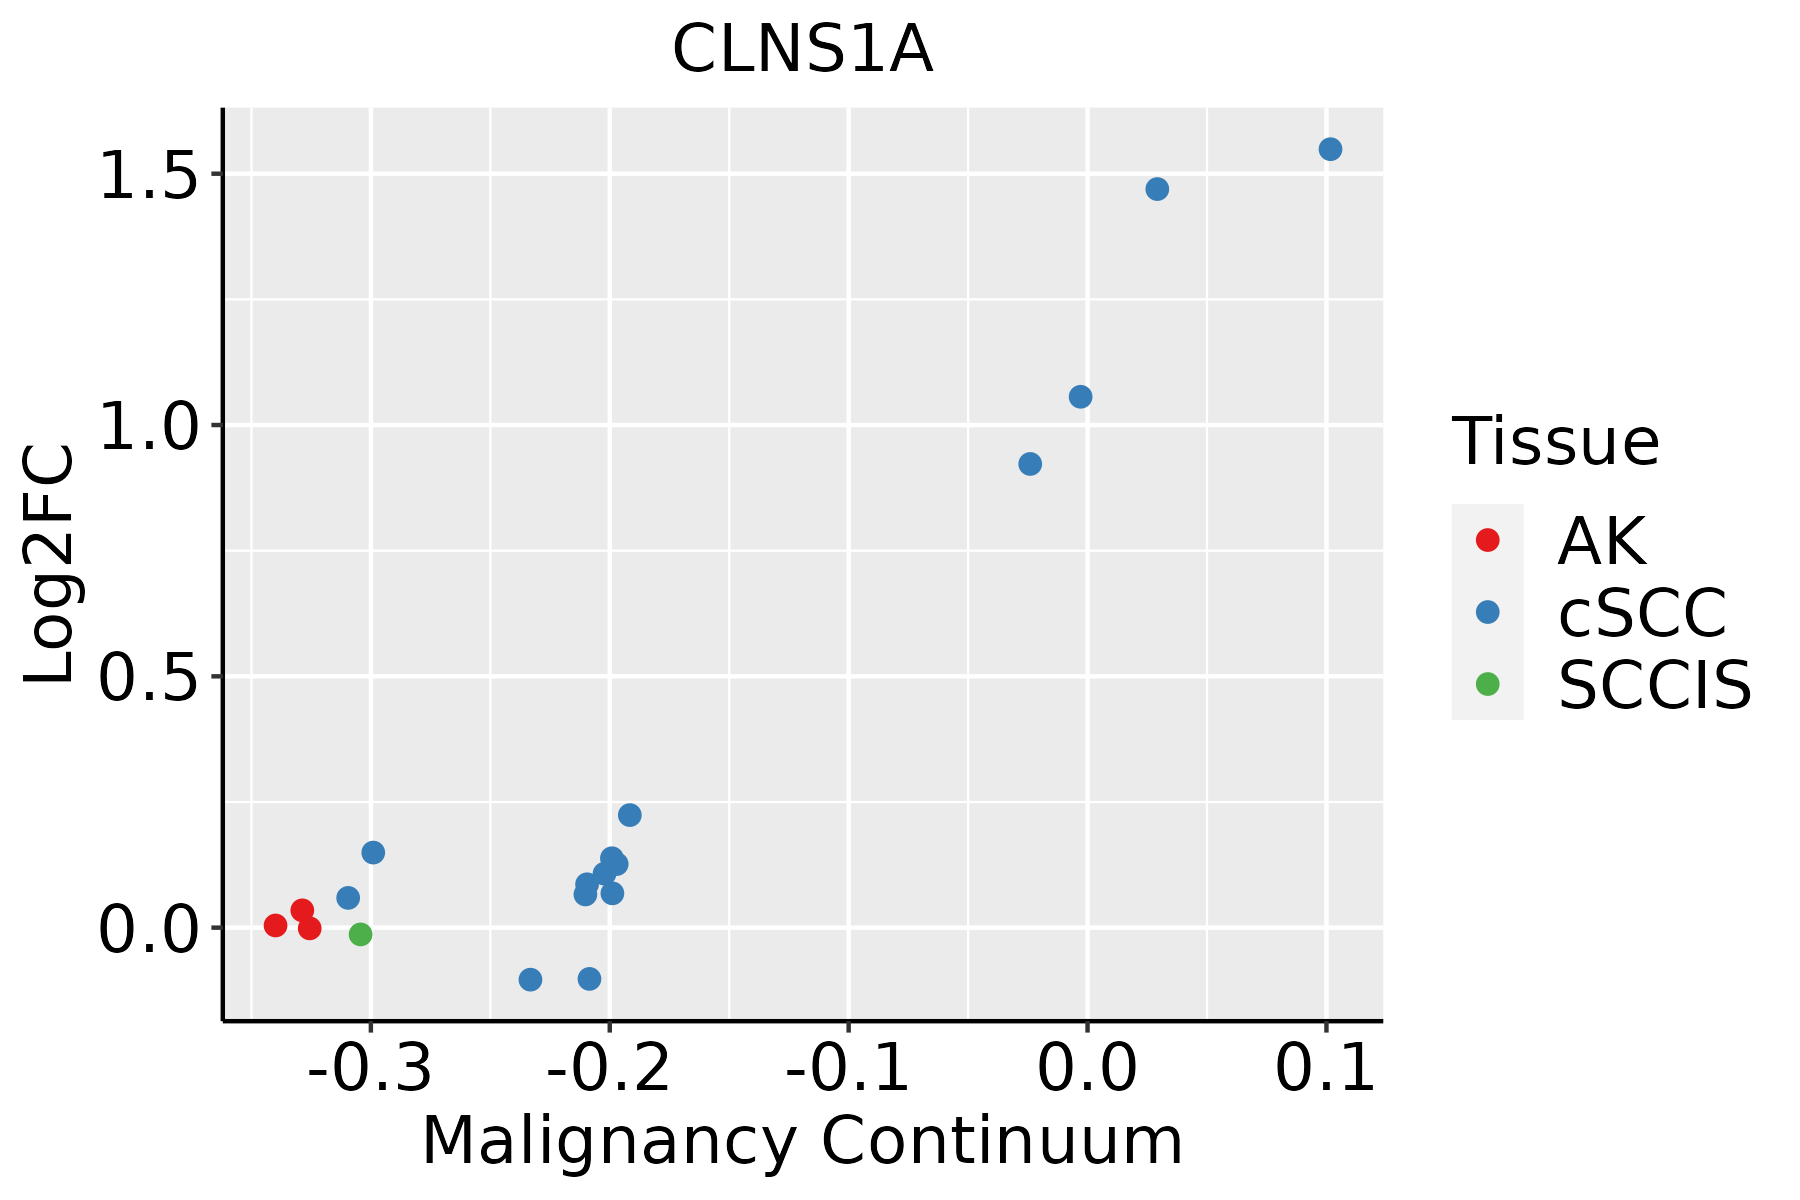 | AK: Actinic keratosis |
| cSCC: Cutaneous squamous cell carcinoma | ||
| SCCIS:squamous cell carcinoma in situ | ||
| Thyroid | 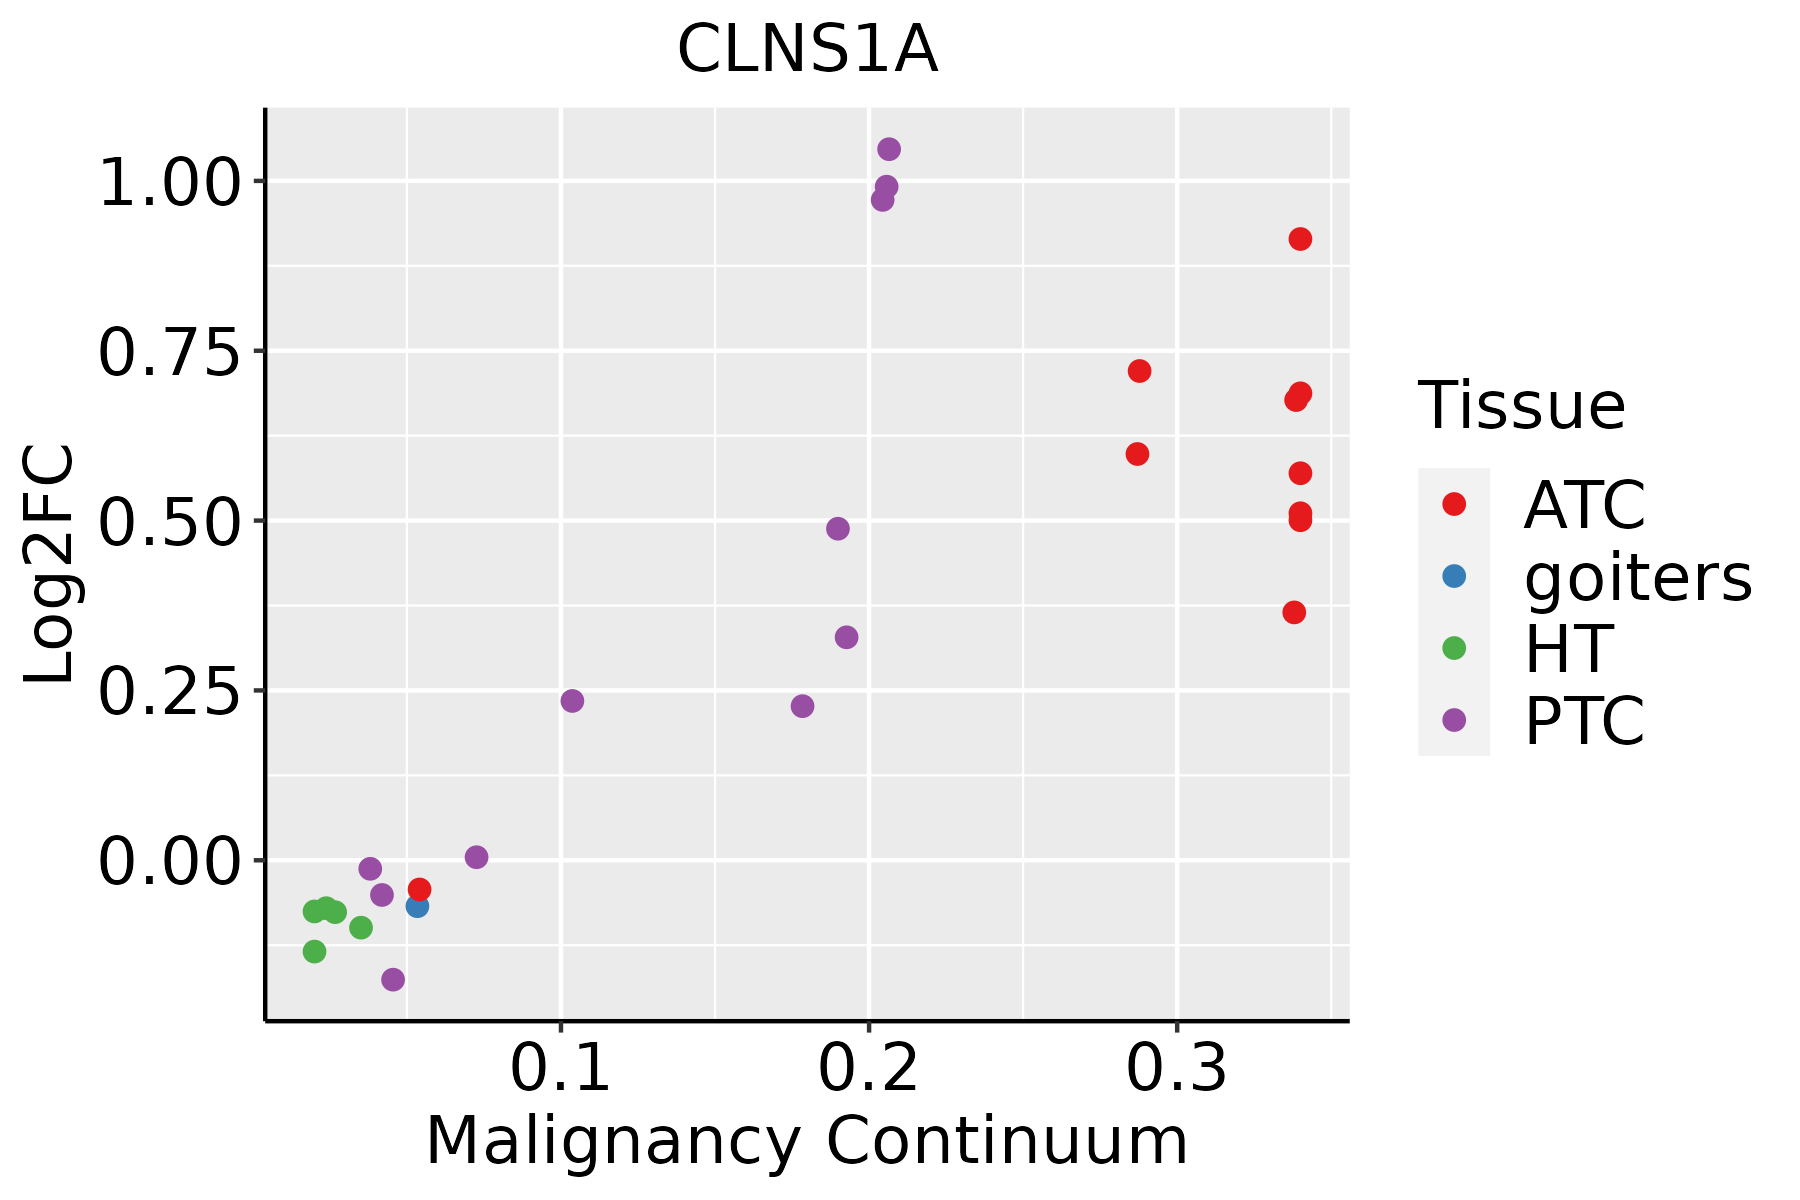 | ATC: Anaplastic thyroid cancer |
| HT: Hashimoto's thyroiditis | ||
| PTC: Papillary thyroid cancer |
| ∗log2FC in expression of this searched gene in stem-like cells from each diseased tissue sample relative to stem-like cells in normal samples in each tissue plotted against the malignancy continuum. Samples are colored based on if they are from different disease stage. |
Top |
Malignant transformation related pathway analysis |
| Find out the enriched GO biological processes and KEGG pathways involved in transition from healthy to precancer to cancer |
| Tissue | Disease Stage | Enriched GO biological Processes |
| Colorectum | AD |  |
| Colorectum | SER |  |
| Colorectum | MSS |  |
| Colorectum | MSI-H |  |
| Colorectum | FAP |  |
| ∗Top 15 enriched GO BP terms are showed in the bar plot of each disease state in each tissue. Each row represents a significant GO biological process which is colored according to the -log10(p.adjust). |
| Page: 1 2 3 4 5 6 7 8 9 |
| GO ID | Tissue | Disease Stage | Description | Gene Ratio | Bg Ratio | pvalue | p.adjust | Count |
| GO:002261820 | Oral cavity | OSCC | ribonucleoprotein complex assembly | 146/7305 | 220/18723 | 1.53e-16 | 1.23e-14 | 146 |
| GO:003253519 | Oral cavity | OSCC | regulation of cellular component size | 201/7305 | 383/18723 | 4.80e-08 | 8.88e-07 | 201 |
| GO:00083618 | Oral cavity | OSCC | regulation of cell size | 92/7305 | 181/18723 | 7.86e-04 | 4.26e-03 | 92 |
| GO:00003874 | Oral cavity | OSCC | spliceosomal snRNP assembly | 28/7305 | 50/18723 | 1.10e-02 | 3.72e-02 | 28 |
| GO:0022613110 | Oral cavity | LP | ribonucleoprotein complex biogenesis | 259/4623 | 463/18723 | 7.20e-48 | 2.25e-44 | 259 |
| GO:0008380110 | Oral cavity | LP | RNA splicing | 237/4623 | 434/18723 | 1.82e-41 | 3.79e-38 | 237 |
| GO:0000375110 | Oral cavity | LP | RNA splicing, via transesterification reactions | 181/4623 | 324/18723 | 1.36e-33 | 1.70e-30 | 181 |
| GO:0000377110 | Oral cavity | LP | RNA splicing, via transesterification reactions with bulged adenosine as nucleophile | 179/4623 | 320/18723 | 2.48e-33 | 2.22e-30 | 179 |
| GO:0000398110 | Oral cavity | LP | mRNA splicing, via spliceosome | 179/4623 | 320/18723 | 2.48e-33 | 2.22e-30 | 179 |
| GO:0071826110 | Oral cavity | LP | ribonucleoprotein complex subunit organization | 130/4623 | 227/18723 | 7.54e-26 | 3.63e-23 | 130 |
| GO:0022618110 | Oral cavity | LP | ribonucleoprotein complex assembly | 125/4623 | 220/18723 | 1.76e-24 | 6.91e-22 | 125 |
| GO:0032535110 | Oral cavity | LP | regulation of cellular component size | 128/4623 | 383/18723 | 6.56e-05 | 8.80e-04 | 128 |
| GO:000038712 | Oral cavity | LP | spliceosomal snRNP assembly | 25/4623 | 50/18723 | 9.66e-05 | 1.20e-03 | 25 |
| GO:002261329 | Skin | cSCC | ribonucleoprotein complex biogenesis | 302/4864 | 463/18723 | 5.13e-72 | 3.22e-68 | 302 |
| GO:0008380112 | Skin | cSCC | RNA splicing | 263/4864 | 434/18723 | 2.45e-53 | 5.13e-50 | 263 |
| GO:0000375112 | Skin | cSCC | RNA splicing, via transesterification reactions | 201/4864 | 324/18723 | 4.07e-43 | 5.10e-40 | 201 |
| GO:0000377112 | Skin | cSCC | RNA splicing, via transesterification reactions with bulged adenosine as nucleophile | 197/4864 | 320/18723 | 1.45e-41 | 1.14e-38 | 197 |
| GO:0000398112 | Skin | cSCC | mRNA splicing, via spliceosome | 197/4864 | 320/18723 | 1.45e-41 | 1.14e-38 | 197 |
| GO:007182629 | Skin | cSCC | ribonucleoprotein complex subunit organization | 140/4864 | 227/18723 | 5.54e-30 | 3.16e-27 | 140 |
| GO:002261829 | Skin | cSCC | ribonucleoprotein complex assembly | 136/4864 | 220/18723 | 2.60e-29 | 1.25e-26 | 136 |
| Page: 1 2 3 4 5 |
| Pathway ID | Tissue | Disease Stage | Description | Gene Ratio | Bg Ratio | pvalue | p.adjust | qvalue | Count |
| Page: 1 |
Top |
Cell-cell communication analysis |
| Identification of potential cell-cell interactions between two cell types and their ligand-receptor pairs for different disease states |
| Ligand | Receptor | LRpair | Pathway | Tissue | Disease Stage |
| Page: 1 |
Top |
Single-cell gene regulatory network inference analysis |
| Find out the significant the regulons (TFs) and the target genes of each regulon across cell types for different disease states |
| TF | Cell Type | Tissue | Disease Stage | Target Gene | RSS | Regulon Activity |
| ∗The dot plots of a searched regulon are shown for all cell subpopulations in each disease state of each tissue based on the regulon specific score inferred using pySCENIC and by calculating the average expression. |
| Page: 1 |
Top |
Somatic mutation of malignant transformation related genes |
| Annotation of somatic variants for genes involved in malignant transformation |
| Hugo Symbol | Variant Class | Variant Classification | dbSNP RS | HGVSc | HGVSp | HGVSp Short | SWISSPROT | BIOTYPE | SIFT | PolyPhen | Tumor Sample Barcode | Tissue | Histology | Sex | Age | Stage | Therapy Types | Drugs | Outcome |
| CLNS1A | SNV | Missense_Mutation | rs144382400 | c.442N>A | p.Asp148Asn | p.D148N | P54105 | protein_coding | tolerated(0.23) | benign(0.011) | TCGA-E2-A1B0-01 | Breast | breast invasive carcinoma | Female | <65 | III/IV | Chemotherapy | cytoxan | SD |
| CLNS1A | deletion | Frame_Shift_Del | novel | c.535delN | p.Ala179GlnfsTer10 | p.A179Qfs*10 | P54105 | protein_coding | TCGA-D8-A27V-01 | Breast | breast invasive carcinoma | Female | <65 | I/II | Hormone Therapy | tamoxiphen | SD | ||
| CLNS1A | SNV | Missense_Mutation | c.192N>A | p.His64Gln | p.H64Q | P54105 | protein_coding | deleterious(0.03) | benign(0.355) | TCGA-EK-A2PM-01 | Cervix | cervical & endocervical cancer | Female | >=65 | I/II | Unknown | Unknown | SD | |
| CLNS1A | SNV | Missense_Mutation | c.232N>G | p.Leu78Val | p.L78V | P54105 | protein_coding | deleterious(0) | probably_damaging(0.992) | TCGA-AA-3510-01 | Colorectum | colon adenocarcinoma | Male | >=65 | I/II | Unknown | Unknown | SD | |
| CLNS1A | SNV | Missense_Mutation | c.677T>C | p.Val226Ala | p.V226A | P54105 | protein_coding | tolerated(0.14) | possibly_damaging(0.611) | TCGA-AA-3811-01 | Colorectum | colon adenocarcinoma | Female | >=65 | III/IV | Unknown | Unknown | PD | |
| CLNS1A | SNV | Missense_Mutation | rs373008022 | c.209G>A | p.Arg70Gln | p.R70Q | P54105 | protein_coding | tolerated(0.51) | benign(0.086) | TCGA-AA-3977-01 | Colorectum | colon adenocarcinoma | Male | >=65 | I/II | Unknown | Unknown | SD |
| CLNS1A | SNV | Missense_Mutation | c.558G>T | p.Glu186Asp | p.E186D | P54105 | protein_coding | tolerated(0.16) | possibly_damaging(0.777) | TCGA-AG-3732-01 | Colorectum | rectum adenocarcinoma | Female | >=65 | I/II | Chemotherapy | capecitabine | SD | |
| CLNS1A | SNV | Missense_Mutation | novel | c.667A>G | p.Thr223Ala | p.T223A | P54105 | protein_coding | tolerated(0.59) | benign(0) | TCGA-A5-A0G1-01 | Endometrium | uterine corpus endometrioid carcinoma | Female | >=65 | I/II | Unknown | Unknown | SD |
| CLNS1A | SNV | Missense_Mutation | c.693N>T | p.Glu231Asp | p.E231D | P54105 | protein_coding | tolerated(0.27) | benign(0.238) | TCGA-AP-A056-01 | Endometrium | uterine corpus endometrioid carcinoma | Female | <65 | I/II | Unknown | Unknown | SD | |
| CLNS1A | SNV | Missense_Mutation | rs779459403 | c.391G>A | p.Glu131Lys | p.E131K | P54105 | protein_coding | tolerated(0.07) | benign(0.029) | TCGA-D1-A103-01 | Endometrium | uterine corpus endometrioid carcinoma | Female | >=65 | I/II | Unknown | Unknown | SD |
| Page: 1 2 |
Top |
Related drugs of malignant transformation related genes |
| Identification of chemicals and drugs interact with genes involved in malignant transfromation |
| (DGIdb 4.0) |
| Entrez ID | Symbol | Category | Interaction Types | Drug Claim Name | Drug Name | PMIDs |
| Page: 1 |

Copyright 2023-Present -The University of Texas Health Science Center at Houston |