
|
|||||
|
 | |
| |
| |
| |
| |
| |
|
Gene: CLK1 |
Gene summary for CLK1 |
| Gene information | Species | Human | Gene symbol | CLK1 | Gene ID | 1195 |
| Gene name | CDC like kinase 1 | |
| Gene Alias | CLK | |
| Cytomap | 2q33.1 | |
| Gene Type | protein-coding | GO ID | GO:0006139 | UniProtAcc | P49759 |
Top |
Malignant transformation analysis |
| Identification of the aberrant gene expression in precancerous and cancerous lesions by comparing the gene expression of stem-like cells in diseased tissues with normal stem cells |
| Entrez ID | Symbol | Replicates | Species | Organ | Tissue | Adj P-value | Log2FC | Malignancy |
| 1195 | CLK1 | GSM4909277 | Human | Breast | Precancer | 5.06e-06 | 7.47e-01 | 0.0177 |
| 1195 | CLK1 | GSM4909280 | Human | Breast | Precancer | 8.53e-04 | 4.80e-01 | 0.0305 |
| 1195 | CLK1 | GSM4909282 | Human | Breast | IDC | 3.40e-08 | -4.20e-01 | -0.0288 |
| 1195 | CLK1 | GSM4909285 | Human | Breast | IDC | 3.35e-09 | -3.99e-01 | 0.21 |
| 1195 | CLK1 | GSM4909286 | Human | Breast | IDC | 2.43e-07 | -3.58e-01 | 0.1081 |
| 1195 | CLK1 | GSM4909290 | Human | Breast | IDC | 1.55e-02 | -3.50e-01 | 0.2096 |
| 1195 | CLK1 | GSM4909294 | Human | Breast | IDC | 2.18e-09 | -4.28e-01 | 0.2022 |
| 1195 | CLK1 | GSM4909296 | Human | Breast | IDC | 7.18e-13 | -4.05e-01 | 0.1524 |
| 1195 | CLK1 | GSM4909297 | Human | Breast | IDC | 5.42e-09 | -1.45e-01 | 0.1517 |
| 1195 | CLK1 | GSM4909298 | Human | Breast | IDC | 3.95e-04 | -2.69e-01 | 0.1551 |
| 1195 | CLK1 | GSM4909302 | Human | Breast | IDC | 6.63e-04 | -3.58e-01 | 0.1545 |
| 1195 | CLK1 | GSM4909306 | Human | Breast | IDC | 2.76e-02 | -3.04e-01 | 0.1564 |
| 1195 | CLK1 | GSM4909308 | Human | Breast | IDC | 2.02e-02 | -2.97e-01 | 0.158 |
| 1195 | CLK1 | GSM4909311 | Human | Breast | IDC | 1.41e-27 | -5.12e-01 | 0.1534 |
| 1195 | CLK1 | GSM4909312 | Human | Breast | IDC | 7.69e-09 | -3.47e-01 | 0.1552 |
| 1195 | CLK1 | GSM4909319 | Human | Breast | IDC | 6.09e-29 | -5.20e-01 | 0.1563 |
| 1195 | CLK1 | GSM4909320 | Human | Breast | IDC | 9.53e-07 | -5.39e-01 | 0.1575 |
| 1195 | CLK1 | GSM4909321 | Human | Breast | IDC | 3.89e-15 | -4.40e-01 | 0.1559 |
| 1195 | CLK1 | ctrl6 | Human | Breast | Precancer | 9.59e-10 | 5.83e-01 | -0.0061 |
| 1195 | CLK1 | brca1 | Human | Breast | Precancer | 1.21e-06 | -3.69e-01 | -0.0338 |
| Page: 1 2 3 4 5 6 7 8 9 10 |
| Tissue | Expression Dynamics | Abbreviation |
| Breast | 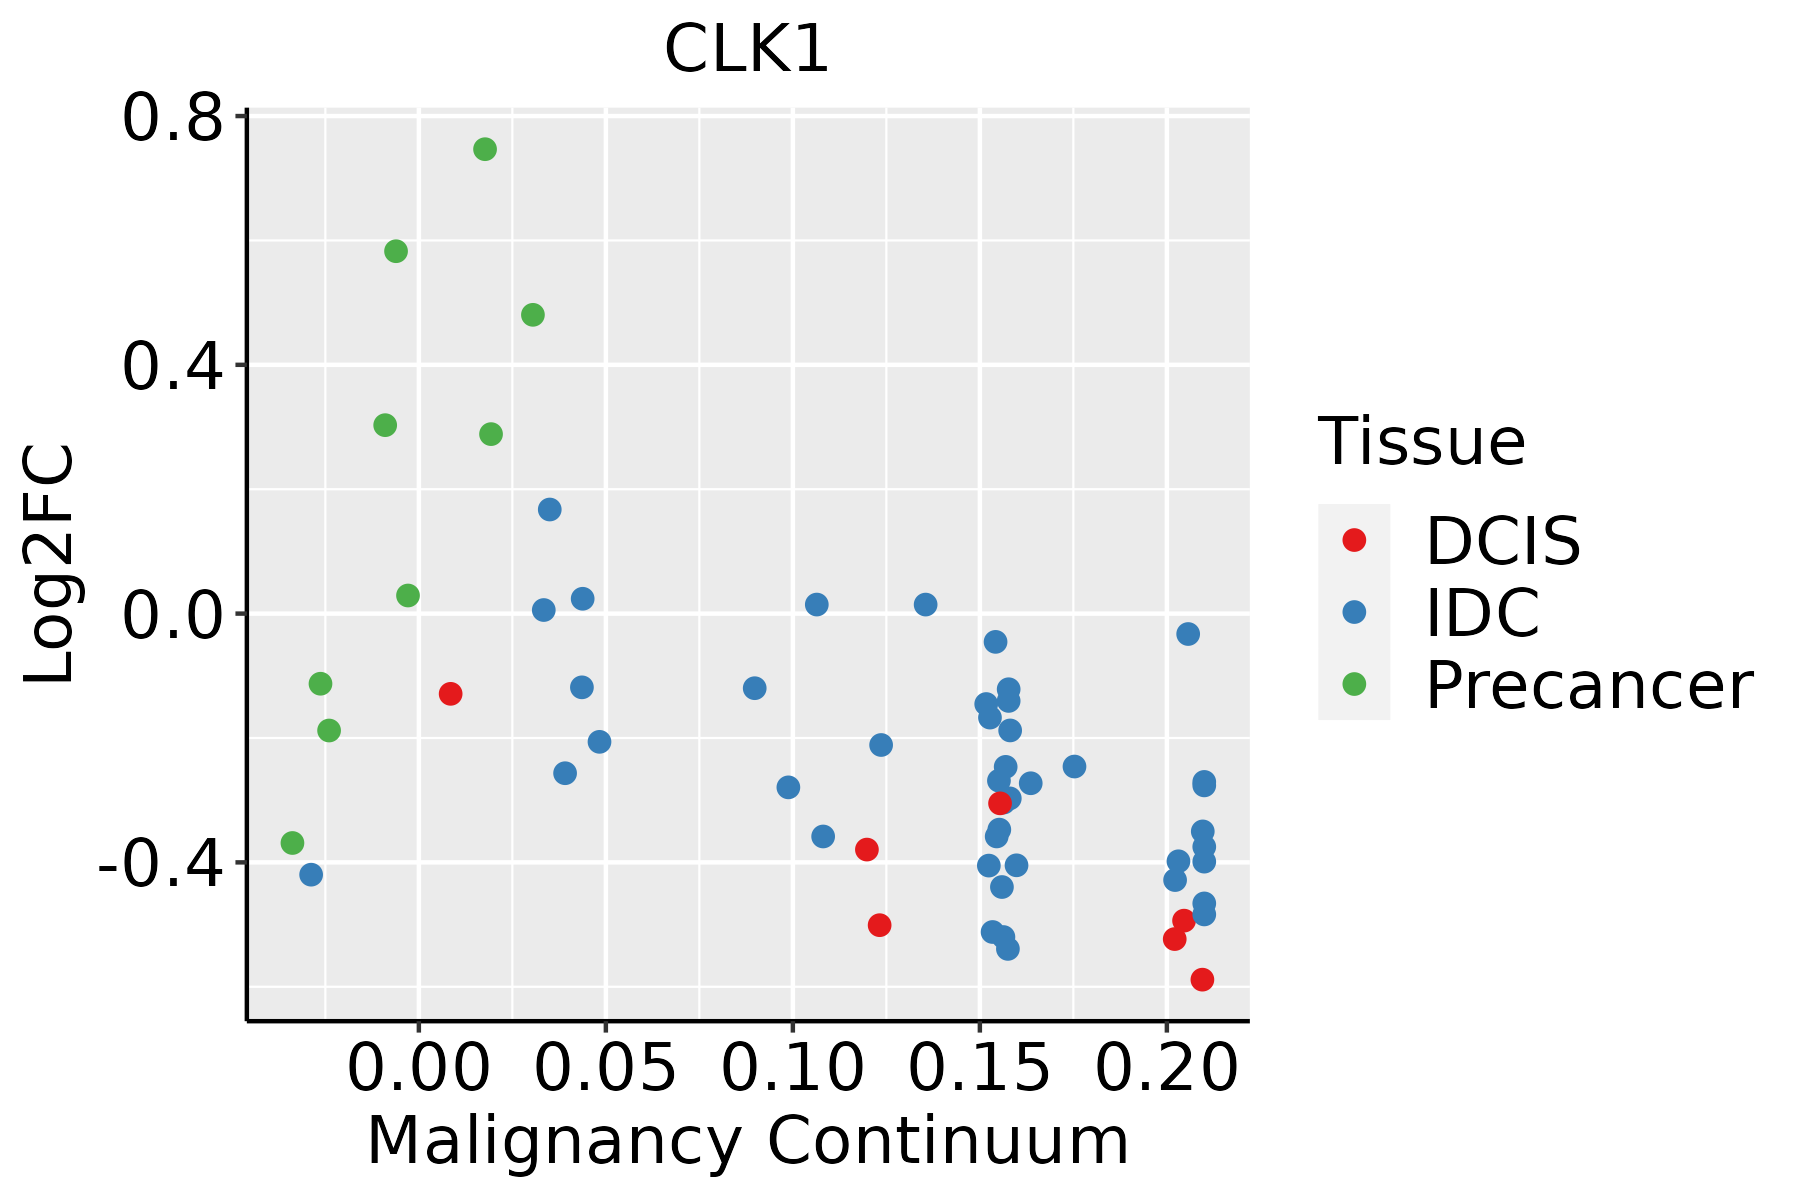 | IDC: Invasive ductal carcinoma |
| DCIS: Ductal carcinoma in situ | ||
| Precancer(BRCA1-mut): Precancerous lesion from BRCA1 mutation carriers | ||
| Esophagus | 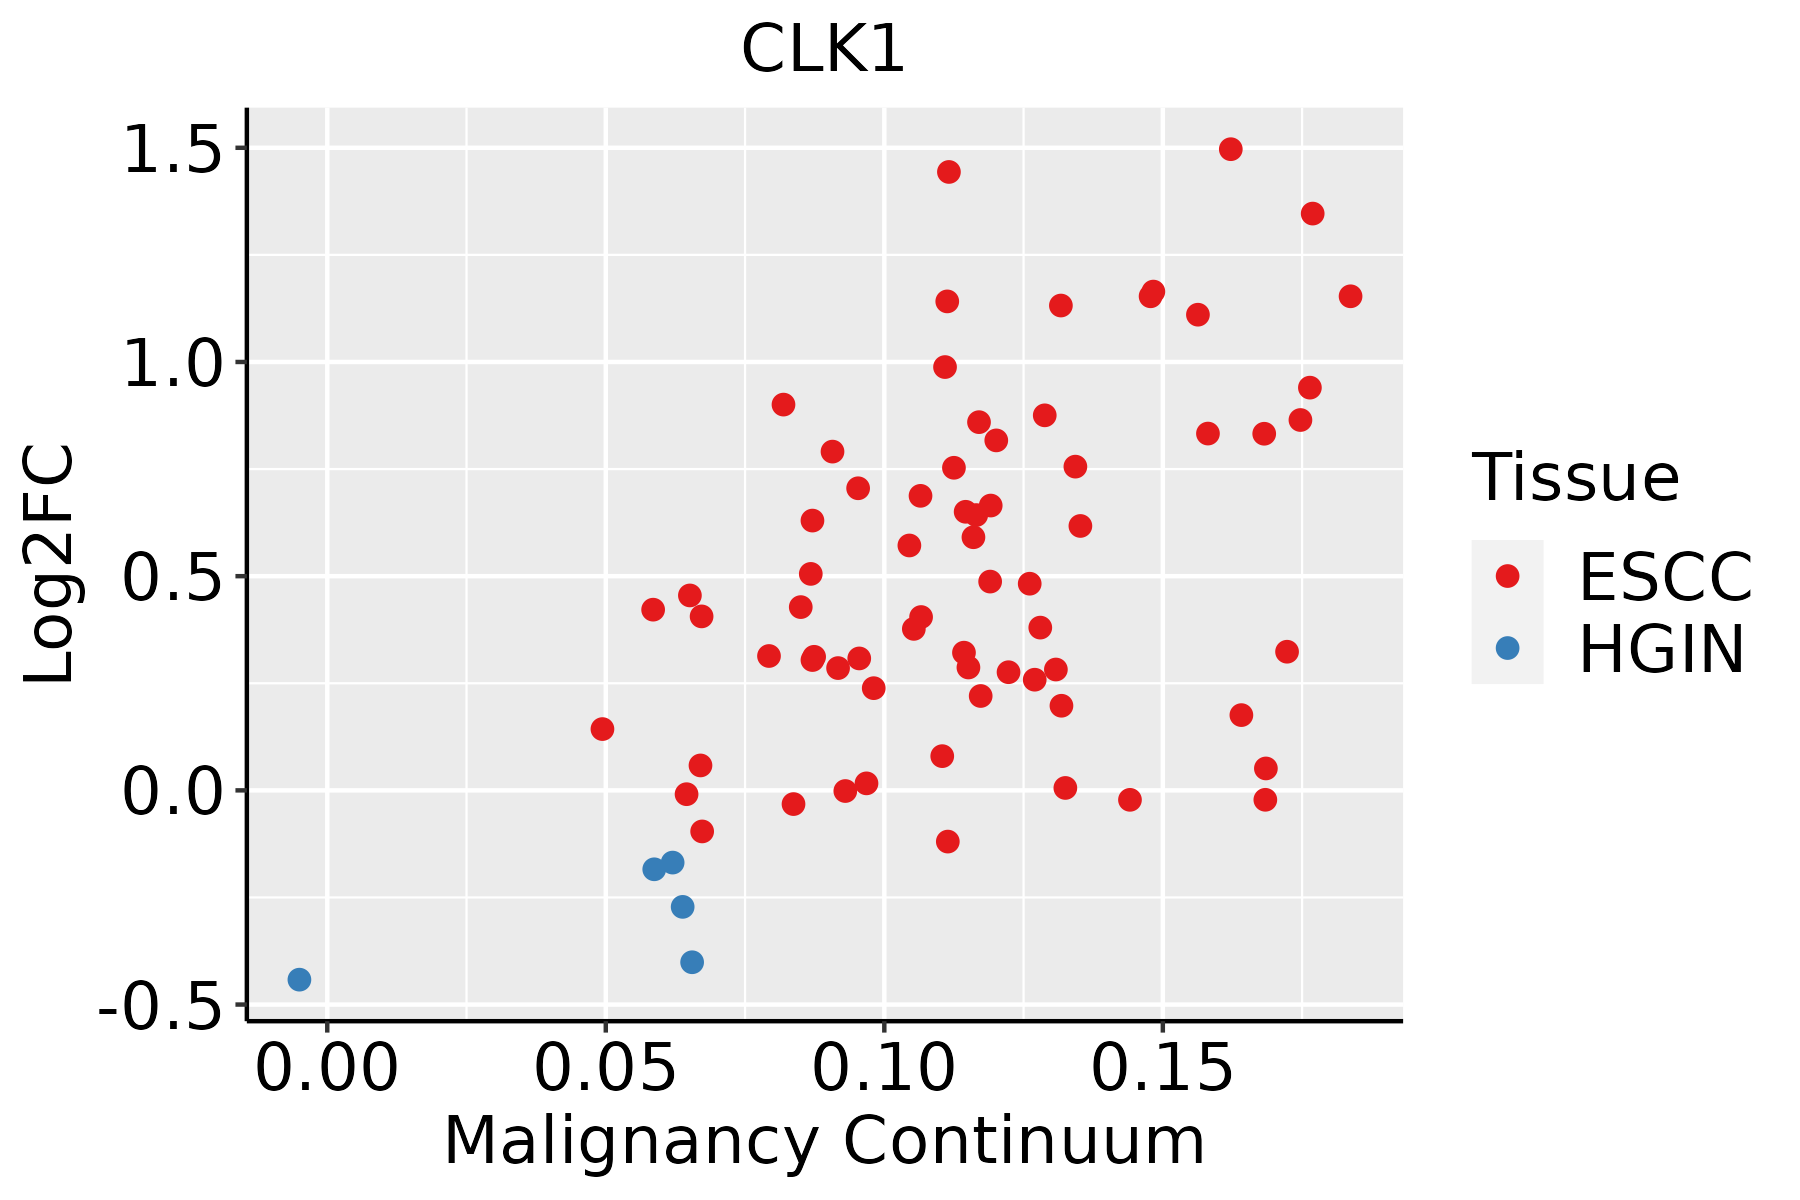 | ESCC: Esophageal squamous cell carcinoma |
| HGIN: High-grade intraepithelial neoplasias | ||
| LGIN: Low-grade intraepithelial neoplasias | ||
| GC | 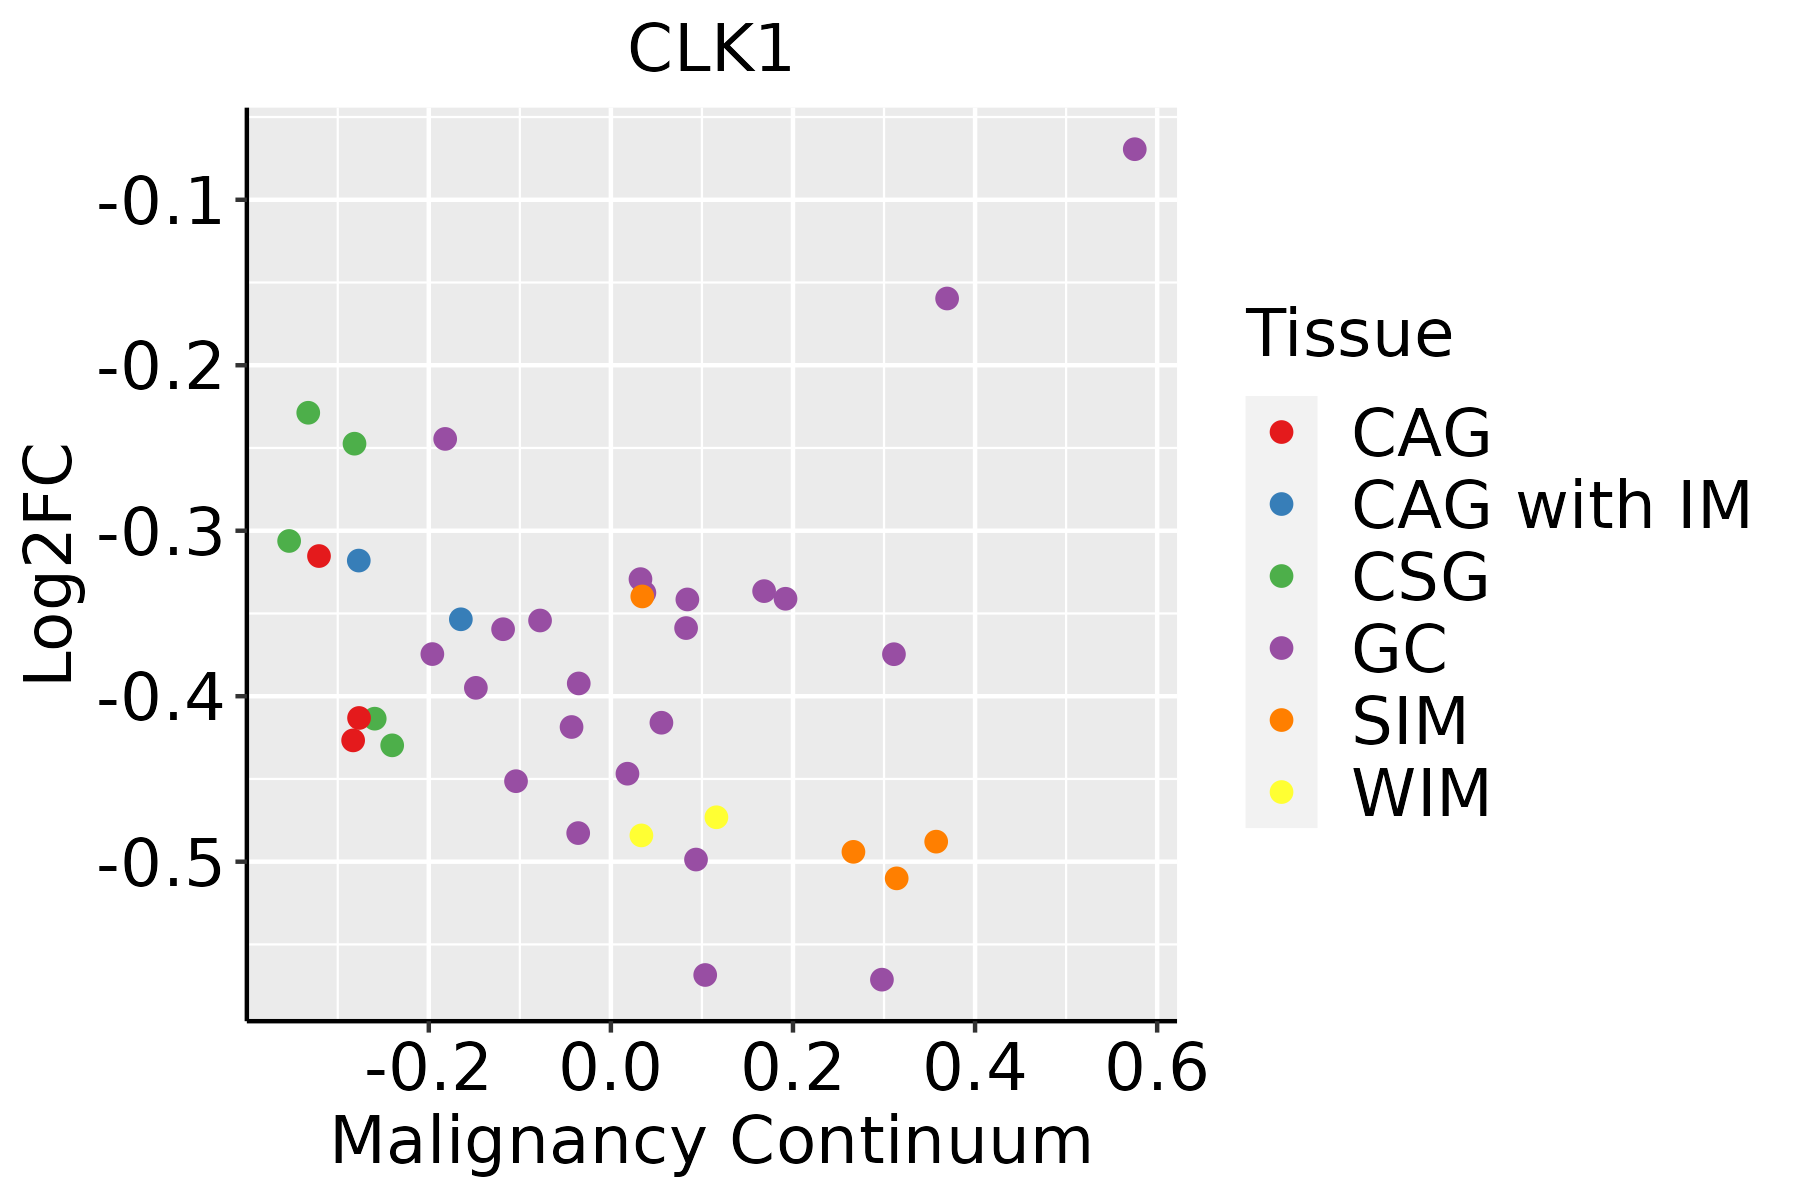 | CAG: Chronic atrophic gastritis |
| CAG with IM: Chronic atrophic gastritis with intestinal metaplasia | ||
| CSG: Chronic superficial gastritis | ||
| GC: Gastric cancer | ||
| SIM: Severe intestinal metaplasia | ||
| WIM: Wild intestinal metaplasia | ||
| Liver | 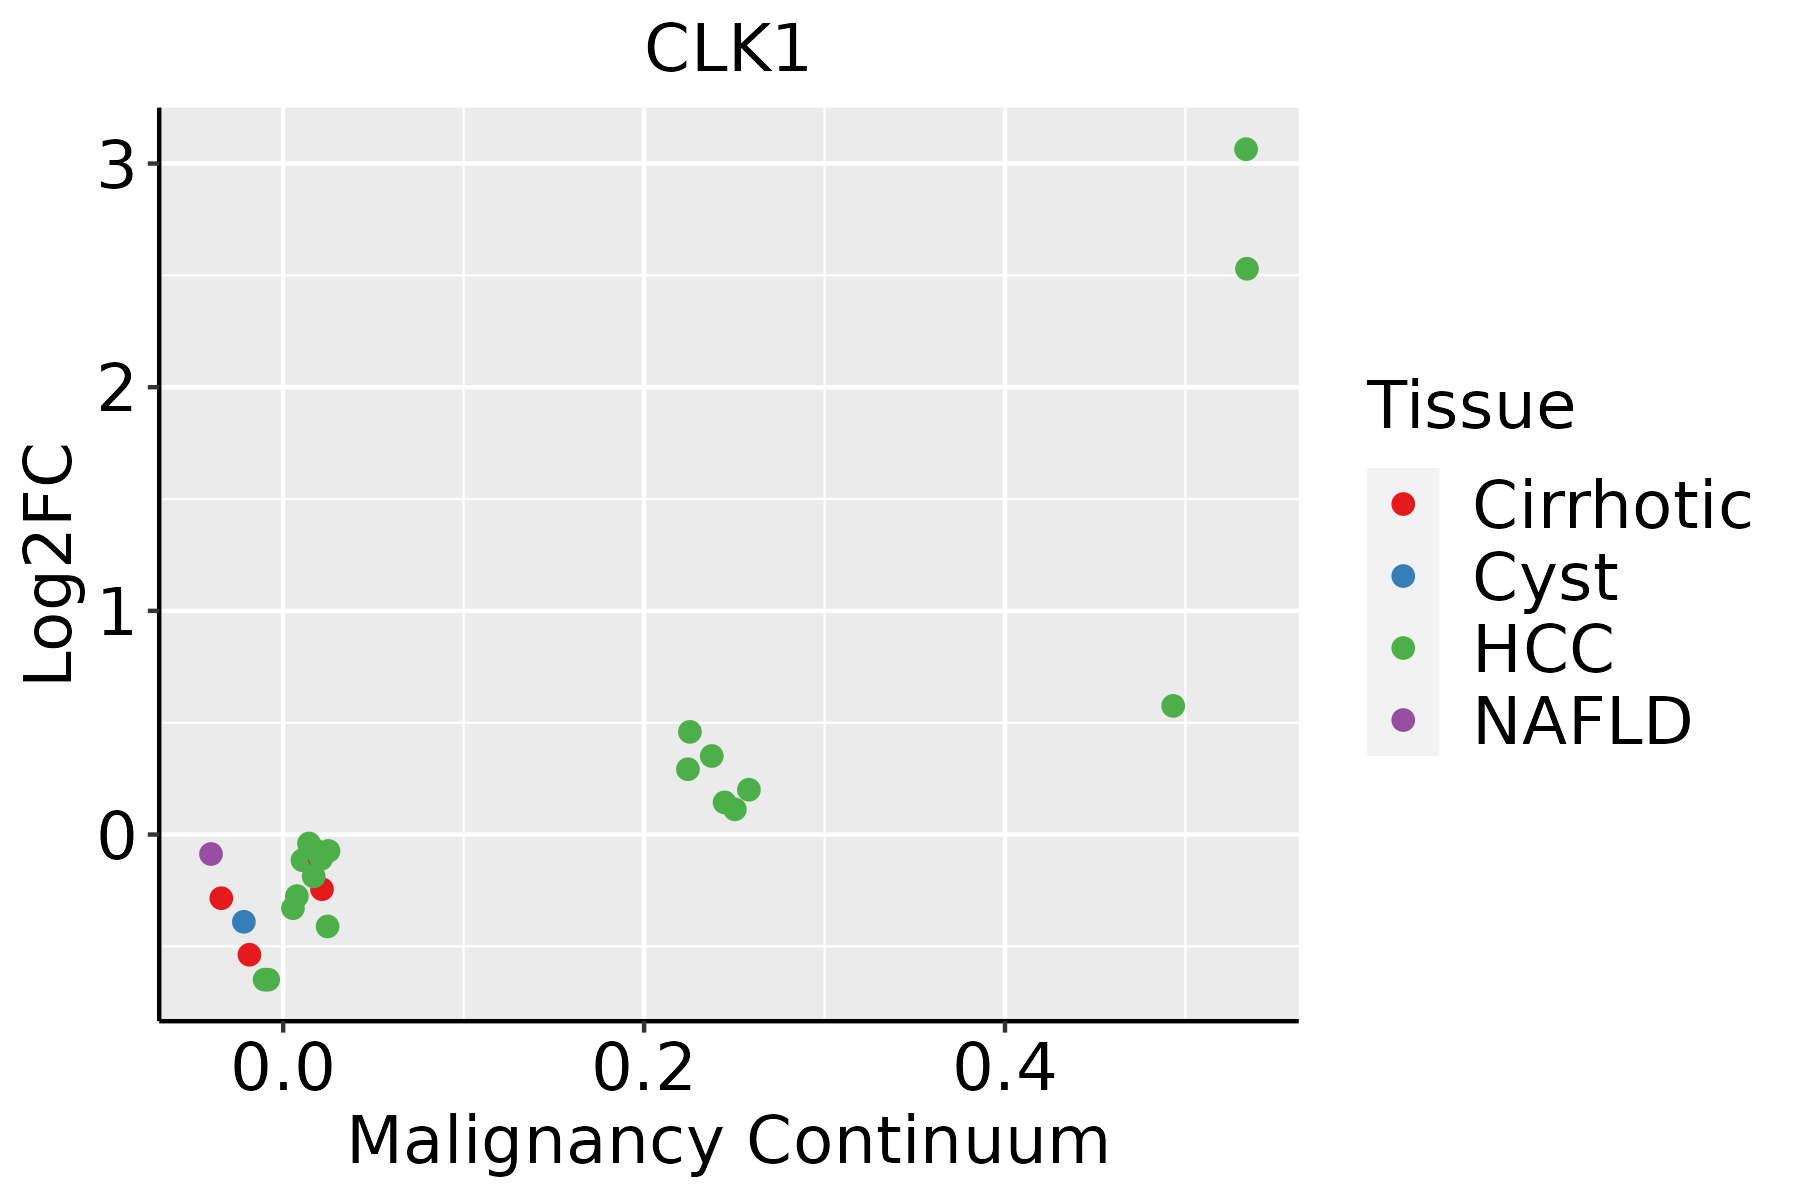 | HCC: Hepatocellular carcinoma |
| NAFLD: Non-alcoholic fatty liver disease | ||
| Oral Cavity |  | EOLP: Erosive Oral lichen planus |
| LP: leukoplakia | ||
| NEOLP: Non-erosive oral lichen planus | ||
| OSCC: Oral squamous cell carcinoma | ||
| Prostate | 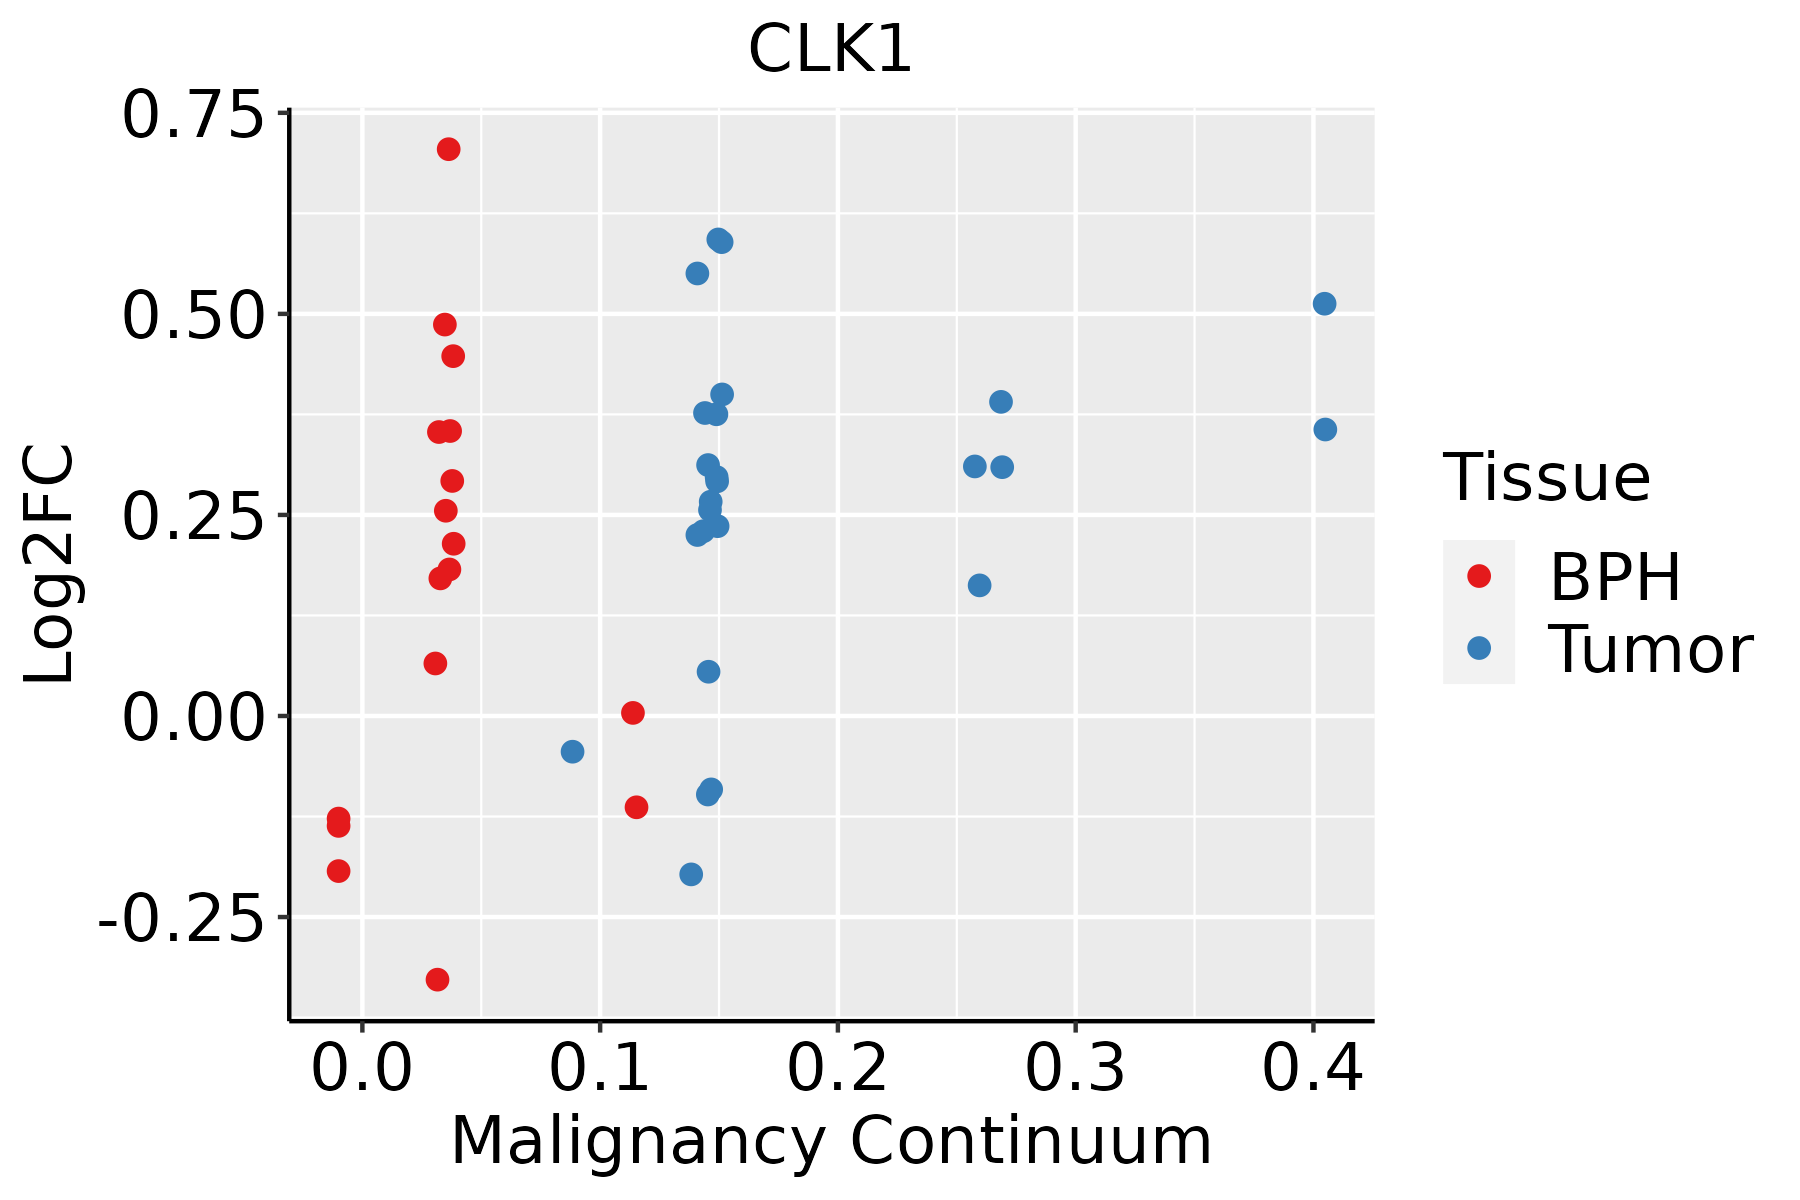 | BPH: Benign Prostatic Hyperplasia |
| Skin | 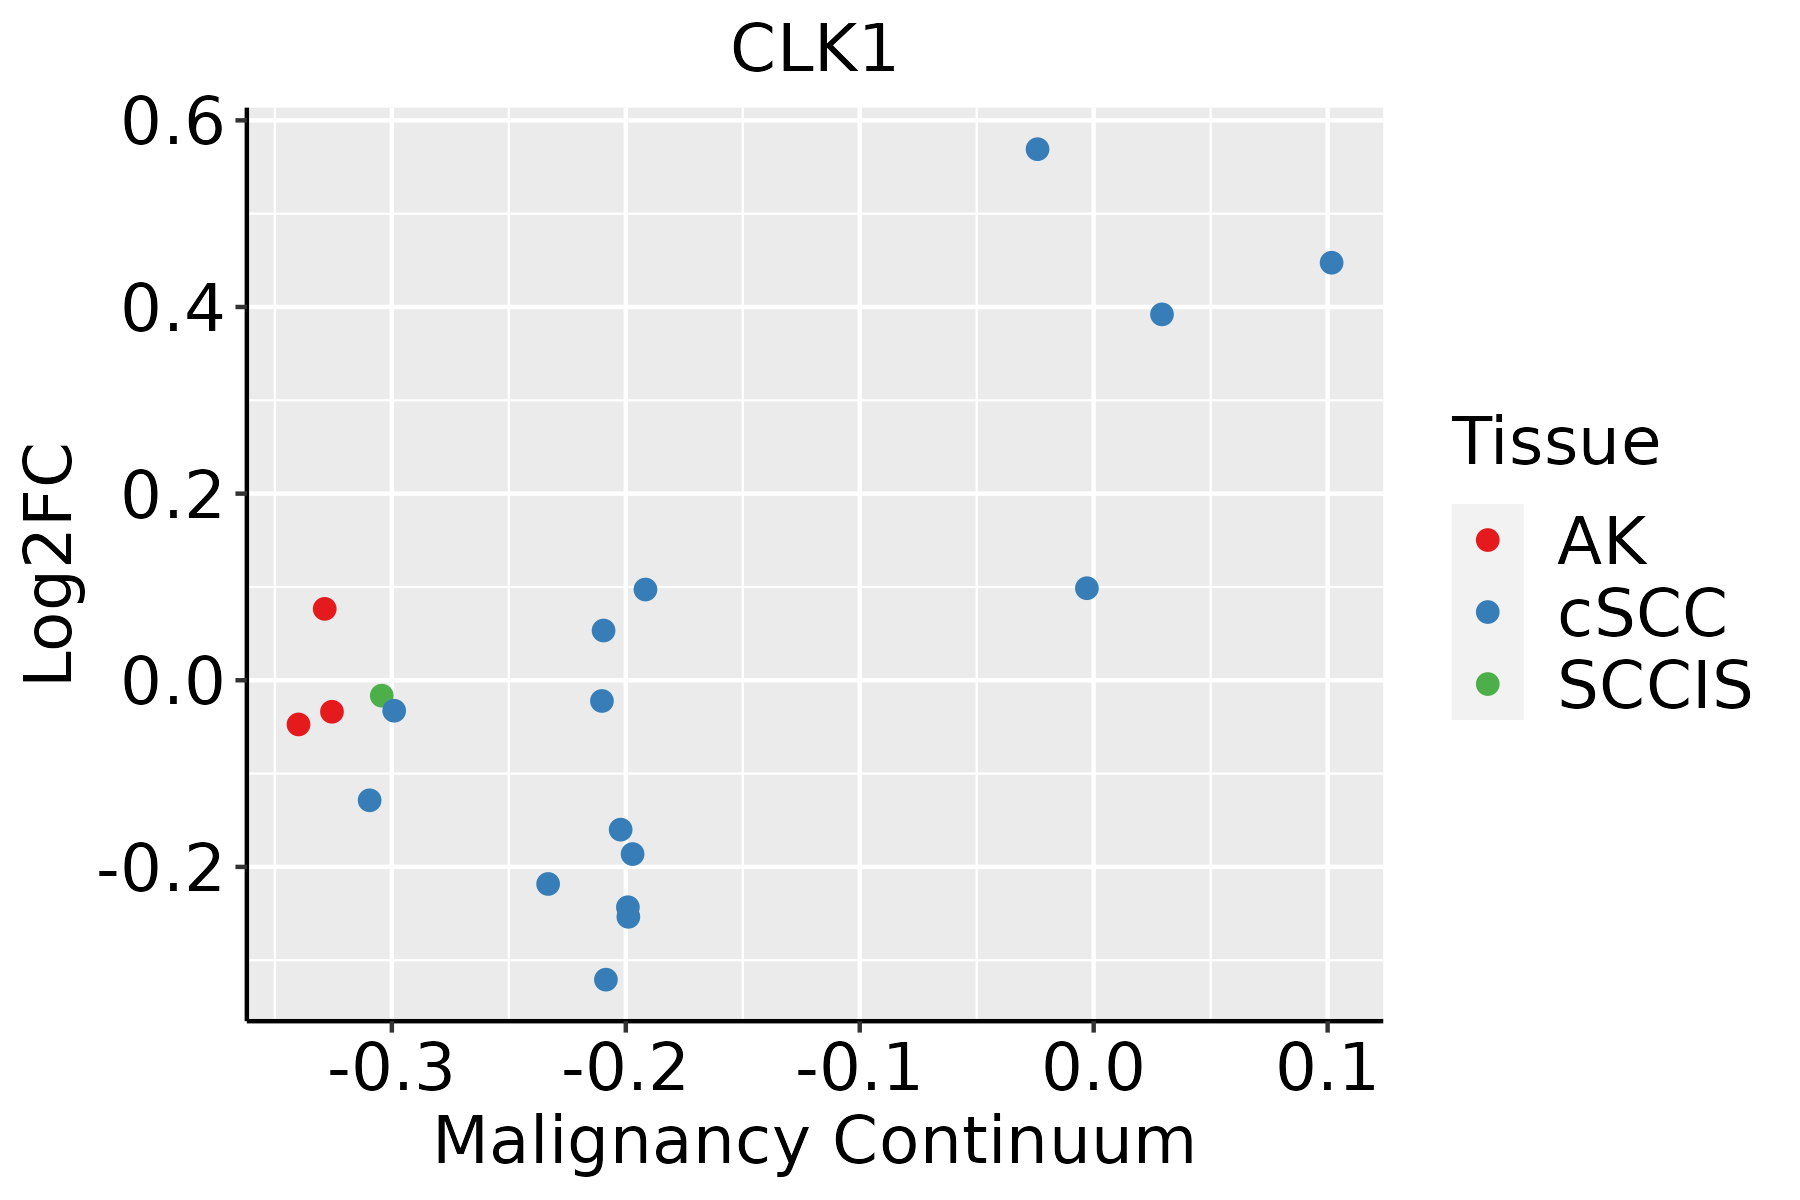 | AK: Actinic keratosis |
| cSCC: Cutaneous squamous cell carcinoma | ||
| SCCIS:squamous cell carcinoma in situ | ||
| Thyroid |  | ATC: Anaplastic thyroid cancer |
| HT: Hashimoto's thyroiditis | ||
| PTC: Papillary thyroid cancer |
| ∗log2FC in expression of this searched gene in stem-like cells from each diseased tissue sample relative to stem-like cells in normal samples in each tissue plotted against the malignancy continuum. Samples are colored based on if they are from different disease stage. |
Top |
Malignant transformation related pathway analysis |
| Find out the enriched GO biological processes and KEGG pathways involved in transition from healthy to precancer to cancer |
| Tissue | Disease Stage | Enriched GO biological Processes |
| Colorectum | AD |  |
| Colorectum | SER |  |
| Colorectum | MSS |  |
| Colorectum | MSI-H |  |
| Colorectum | FAP |  |
| ∗Top 15 enriched GO BP terms are showed in the bar plot of each disease state in each tissue. Each row represents a significant GO biological process which is colored according to the -log10(p.adjust). |
| Page: 1 2 3 4 5 6 7 8 9 |
| GO ID | Tissue | Disease Stage | Description | Gene Ratio | Bg Ratio | pvalue | p.adjust | Count |
| GO:000961521 | Oral cavity | EOLP | response to virus | 81/2218 | 367/18723 | 1.71e-08 | 7.66e-07 | 81 |
| GO:001604924 | Oral cavity | EOLP | cell growth | 97/2218 | 482/18723 | 9.06e-08 | 3.15e-06 | 97 |
| GO:001821015 | Oral cavity | EOLP | peptidyl-threonine modification | 35/2218 | 125/18723 | 7.33e-07 | 1.85e-05 | 35 |
| GO:001810715 | Oral cavity | EOLP | peptidyl-threonine phosphorylation | 33/2218 | 116/18723 | 1.02e-06 | 2.51e-05 | 33 |
| GO:001635815 | Oral cavity | EOLP | dendrite development | 55/2218 | 243/18723 | 1.43e-06 | 3.42e-05 | 55 |
| GO:004677713 | Oral cavity | EOLP | protein autophosphorylation | 49/2218 | 227/18723 | 2.04e-05 | 3.21e-04 | 49 |
| GO:004858815 | Oral cavity | EOLP | developmental cell growth | 49/2218 | 234/18723 | 4.67e-05 | 6.20e-04 | 49 |
| GO:00488137 | Oral cavity | EOLP | dendrite morphogenesis | 34/2218 | 146/18723 | 7.56e-05 | 9.19e-04 | 34 |
| GO:00309005 | Oral cavity | EOLP | forebrain development | 68/2218 | 379/18723 | 2.97e-04 | 2.79e-03 | 68 |
| GO:001619722 | Oral cavity | EOLP | endosomal transport | 45/2218 | 230/18723 | 4.63e-04 | 4.07e-03 | 45 |
| GO:190018021 | Oral cavity | EOLP | regulation of protein localization to nucleus | 30/2218 | 136/18723 | 5.23e-04 | 4.52e-03 | 30 |
| GO:004867515 | Oral cavity | EOLP | axon extension | 27/2218 | 120/18723 | 7.04e-04 | 5.78e-03 | 27 |
| GO:00182121 | Oral cavity | EOLP | peptidyl-tyrosine modification | 65/2218 | 378/18723 | 1.25e-03 | 9.02e-03 | 65 |
| GO:00181081 | Oral cavity | EOLP | peptidyl-tyrosine phosphorylation | 64/2218 | 375/18723 | 1.65e-03 | 1.09e-02 | 64 |
| GO:00219554 | Oral cavity | EOLP | central nervous system neuron axonogenesis | 11/2218 | 35/18723 | 1.74e-03 | 1.14e-02 | 11 |
| GO:199013815 | Oral cavity | EOLP | neuron projection extension | 34/2218 | 172/18723 | 1.80e-03 | 1.17e-02 | 34 |
| GO:190382821 | Oral cavity | EOLP | negative regulation of cellular protein localization | 25/2218 | 117/18723 | 2.33e-03 | 1.43e-02 | 25 |
| GO:00219542 | Oral cavity | EOLP | central nervous system neuron development | 19/2218 | 81/18723 | 2.49e-03 | 1.52e-02 | 19 |
| GO:006056015 | Oral cavity | EOLP | developmental growth involved in morphogenesis | 41/2218 | 234/18723 | 6.54e-03 | 3.21e-02 | 41 |
| GO:000740910 | Oral cavity | EOLP | axonogenesis | 66/2218 | 418/18723 | 8.99e-03 | 4.13e-02 | 66 |
| Page: 1 2 3 4 5 6 7 8 9 |
| Pathway ID | Tissue | Disease Stage | Description | Gene Ratio | Bg Ratio | pvalue | p.adjust | qvalue | Count |
| hsa0513422 | Breast | IDC | Legionellosis | 19/867 | 57/8465 | 1.89e-06 | 3.07e-05 | 2.29e-05 | 19 |
| hsa0513432 | Breast | IDC | Legionellosis | 19/867 | 57/8465 | 1.89e-06 | 3.07e-05 | 2.29e-05 | 19 |
| hsa0513427 | Esophagus | HGIN | Legionellosis | 18/1383 | 57/8465 | 3.20e-03 | 2.54e-02 | 2.02e-02 | 18 |
| hsa05134112 | Esophagus | HGIN | Legionellosis | 18/1383 | 57/8465 | 3.20e-03 | 2.54e-02 | 2.02e-02 | 18 |
| hsa0513428 | Esophagus | ESCC | Legionellosis | 42/4205 | 57/8465 | 1.83e-04 | 6.90e-04 | 3.53e-04 | 42 |
| hsa0513436 | Esophagus | ESCC | Legionellosis | 42/4205 | 57/8465 | 1.83e-04 | 6.90e-04 | 3.53e-04 | 42 |
| hsa0513412 | Liver | Cirrhotic | Legionellosis | 28/2530 | 57/8465 | 1.71e-03 | 8.01e-03 | 4.94e-03 | 28 |
| hsa0513413 | Liver | Cirrhotic | Legionellosis | 28/2530 | 57/8465 | 1.71e-03 | 8.01e-03 | 4.94e-03 | 28 |
| hsa0513425 | Oral cavity | OSCC | Legionellosis | 42/3704 | 57/8465 | 4.18e-06 | 2.15e-05 | 1.10e-05 | 42 |
| hsa05134111 | Oral cavity | OSCC | Legionellosis | 42/3704 | 57/8465 | 4.18e-06 | 2.15e-05 | 1.10e-05 | 42 |
| hsa0513426 | Oral cavity | LP | Legionellosis | 33/2418 | 57/8465 | 3.29e-06 | 3.23e-05 | 2.08e-05 | 33 |
| hsa0513435 | Oral cavity | LP | Legionellosis | 33/2418 | 57/8465 | 3.29e-06 | 3.23e-05 | 2.08e-05 | 33 |
| hsa0513443 | Oral cavity | EOLP | Legionellosis | 18/1218 | 57/8465 | 7.27e-04 | 2.73e-03 | 1.61e-03 | 18 |
| hsa0513453 | Oral cavity | EOLP | Legionellosis | 18/1218 | 57/8465 | 7.27e-04 | 2.73e-03 | 1.61e-03 | 18 |
| hsa0513461 | Oral cavity | NEOLP | Legionellosis | 15/1112 | 57/8465 | 5.58e-03 | 2.17e-02 | 1.36e-02 | 15 |
| hsa0513471 | Oral cavity | NEOLP | Legionellosis | 15/1112 | 57/8465 | 5.58e-03 | 2.17e-02 | 1.36e-02 | 15 |
| hsa0513420 | Prostate | BPH | Legionellosis | 22/1718 | 57/8465 | 1.10e-03 | 4.99e-03 | 3.09e-03 | 22 |
| hsa05134110 | Prostate | BPH | Legionellosis | 22/1718 | 57/8465 | 1.10e-03 | 4.99e-03 | 3.09e-03 | 22 |
| hsa0513424 | Prostate | Tumor | Legionellosis | 22/1791 | 57/8465 | 1.95e-03 | 7.98e-03 | 4.95e-03 | 22 |
| hsa0513434 | Prostate | Tumor | Legionellosis | 22/1791 | 57/8465 | 1.95e-03 | 7.98e-03 | 4.95e-03 | 22 |
| Page: 1 2 |
Top |
Cell-cell communication analysis |
| Identification of potential cell-cell interactions between two cell types and their ligand-receptor pairs for different disease states |
| Ligand | Receptor | LRpair | Pathway | Tissue | Disease Stage |
| Page: 1 |
Top |
Single-cell gene regulatory network inference analysis |
| Find out the significant the regulons (TFs) and the target genes of each regulon across cell types for different disease states |
| TF | Cell Type | Tissue | Disease Stage | Target Gene | RSS | Regulon Activity |
| ∗The dot plots of a searched regulon are shown for all cell subpopulations in each disease state of each tissue based on the regulon specific score inferred using pySCENIC and by calculating the average expression. |
| Page: 1 |
Top |
Somatic mutation of malignant transformation related genes |
| Annotation of somatic variants for genes involved in malignant transformation |
| Hugo Symbol | Variant Class | Variant Classification | dbSNP RS | HGVSc | HGVSp | HGVSp Short | SWISSPROT | BIOTYPE | SIFT | PolyPhen | Tumor Sample Barcode | Tissue | Histology | Sex | Age | Stage | Therapy Types | Drugs | Outcome |
| CLK1 | SNV | Missense_Mutation | c.247N>C | p.Asn83His | p.N83H | P49759 | protein_coding | deleterious_low_confidence(0) | benign(0.047) | TCGA-A8-A07R-01 | Breast | breast invasive carcinoma | Female | >=65 | III/IV | Ancillary | zoledronic | SD | |
| CLK1 | SNV | Missense_Mutation | c.246N>T | p.Glu82Asp | p.E82D | P49759 | protein_coding | deleterious_low_confidence(0.03) | benign(0.003) | TCGA-A8-A07R-01 | Breast | breast invasive carcinoma | Female | >=65 | III/IV | Ancillary | zoledronic | SD | |
| CLK1 | SNV | Missense_Mutation | c.436T>G | p.Ser146Ala | p.S146A | P49759 | protein_coding | tolerated(0.05) | probably_damaging(0.977) | TCGA-AO-A1KS-01 | Breast | breast invasive carcinoma | Female | >=65 | I/II | Hormone Therapy | arimidex | SD | |
| CLK1 | SNV | Missense_Mutation | c.937N>G | p.Gln313Glu | p.Q313E | P49759 | protein_coding | deleterious(0.01) | possibly_damaging(0.881) | TCGA-C8-A12T-01 | Breast | breast invasive carcinoma | Female | <65 | I/II | Unknown | Unknown | SD | |
| CLK1 | SNV | Missense_Mutation | c.157G>C | p.Asp53His | p.D53H | P49759 | protein_coding | deleterious_low_confidence(0.02) | benign(0.024) | TCGA-EK-A2PG-01 | Cervix | cervical & endocervical cancer | Female | >=65 | I/II | Unknown | Unknown | SD | |
| CLK1 | SNV | Missense_Mutation | rs758189196 | c.1037N>T | p.Ala346Val | p.A346V | P49759 | protein_coding | tolerated(0.65) | benign(0.003) | TCGA-FU-A3HZ-01 | Cervix | cervical & endocervical cancer | Female | <65 | I/II | Chemotherapy | cisplatin | CR |
| CLK1 | SNV | Missense_Mutation | c.605N>C | p.Arg202Thr | p.R202T | P49759 | protein_coding | deleterious(0.01) | possibly_damaging(0.58) | TCGA-FU-A3YQ-01 | Cervix | cervical & endocervical cancer | Female | <65 | I/II | Unknown | Unknown | SD | |
| CLK1 | SNV | Missense_Mutation | c.737N>A | p.Arg246His | p.R246H | P49759 | protein_coding | tolerated(0.14) | benign(0.023) | TCGA-Q1-A5R3-01 | Cervix | cervical & endocervical cancer | Female | <65 | I/II | Chemotherapy | cisplatin | PR | |
| CLK1 | SNV | Missense_Mutation | novel | c.552G>T | p.Glu184Asp | p.E184D | P49759 | protein_coding | tolerated(0.05) | benign(0.337) | TCGA-AA-3947-01 | Colorectum | colon adenocarcinoma | Female | <65 | I/II | Unknown | Unknown | SD |
| CLK1 | SNV | Missense_Mutation | c.974A>C | p.Lys325Thr | p.K325T | P49759 | protein_coding | deleterious(0) | possibly_damaging(0.793) | TCGA-AA-3977-01 | Colorectum | colon adenocarcinoma | Male | >=65 | I/II | Unknown | Unknown | SD |
| Page: 1 2 3 4 5 6 7 |
Top |
Related drugs of malignant transformation related genes |
| Identification of chemicals and drugs interact with genes involved in malignant transfromation |
| (DGIdb 4.0) |
| Entrez ID | Symbol | Category | Interaction Types | Drug Claim Name | Drug Name | PMIDs |
| 1195 | CLK1 | SERINE THREONINE KINASE, KINASE, DRUGGABLE GENOME, ENZYME, TYROSINE KINASE | inhibitor | 249565795 | ||
| 1195 | CLK1 | SERINE THREONINE KINASE, KINASE, DRUGGABLE GENOME, ENZYME, TYROSINE KINASE | inhibitor | HESPERADIN | HESPERADIN | 19035792 |
| 1195 | CLK1 | SERINE THREONINE KINASE, KINASE, DRUGGABLE GENOME, ENZYME, TYROSINE KINASE | inhibitor | 249565842 | ||
| 1195 | CLK1 | SERINE THREONINE KINASE, KINASE, DRUGGABLE GENOME, ENZYME, TYROSINE KINASE | HARMINE | HARMINE | 22998443 | |
| 1195 | CLK1 | SERINE THREONINE KINASE, KINASE, DRUGGABLE GENOME, ENZYME, TYROSINE KINASE | inhibitor | 249565735 | ||
| 1195 | CLK1 | SERINE THREONINE KINASE, KINASE, DRUGGABLE GENOME, ENZYME, TYROSINE KINASE | inhibitor | 249565841 | ||
| 1195 | CLK1 | SERINE THREONINE KINASE, KINASE, DRUGGABLE GENOME, ENZYME, TYROSINE KINASE | LEUCETTAMINE B | LEUCETTAMINE B | 22998443 | |
| 1195 | CLK1 | SERINE THREONINE KINASE, KINASE, DRUGGABLE GENOME, ENZYME, TYROSINE KINASE | NU-2058 | CHEMBL269881 | ||
| 1195 | CLK1 | SERINE THREONINE KINASE, KINASE, DRUGGABLE GENOME, ENZYME, TYROSINE KINASE | TG003 |
| Page: 1 |

Copyright 2023-Present -The University of Texas Health Science Center at Houston |