
|
|||||
|
 | |
| |
| |
| |
| |
| |
|
Gene: CHP2 |
Gene summary for CHP2 |
| Gene information | Species | Human | Gene symbol | CHP2 | Gene ID | 63928 |
| Gene name | calcineurin like EF-hand protein 2 | |
| Gene Alias | CHP2 | |
| Cytomap | 16p12.2 | |
| Gene Type | protein-coding | GO ID | GO:0006139 | UniProtAcc | O43745 |
Top |
Malignant transformation analysis |
| Identification of the aberrant gene expression in precancerous and cancerous lesions by comparing the gene expression of stem-like cells in diseased tissues with normal stem cells |
| Entrez ID | Symbol | Replicates | Species | Organ | Tissue | Adj P-value | Log2FC | Malignancy |
| 63928 | CHP2 | HTA11_2487_2000001011 | Human | Colorectum | SER | 2.75e-16 | 8.51e-01 | -0.1808 |
| 63928 | CHP2 | HTA11_78_2000001011 | Human | Colorectum | AD | 3.19e-05 | 6.76e-01 | -0.1088 |
| 63928 | CHP2 | HTA11_347_2000001011 | Human | Colorectum | AD | 6.40e-56 | 1.55e+00 | -0.1954 |
| 63928 | CHP2 | HTA11_411_2000001011 | Human | Colorectum | SER | 4.60e-03 | 9.77e-01 | -0.2602 |
| 63928 | CHP2 | HTA11_2112_2000001011 | Human | Colorectum | SER | 2.54e-02 | 7.04e-01 | -0.2196 |
| 63928 | CHP2 | HTA11_3361_2000001011 | Human | Colorectum | AD | 3.50e-07 | 6.76e-01 | -0.1207 |
| 63928 | CHP2 | HTA11_83_2000001011 | Human | Colorectum | SER | 4.87e-23 | 1.38e+00 | -0.1526 |
| 63928 | CHP2 | HTA11_696_2000001011 | Human | Colorectum | AD | 2.38e-19 | 8.65e-01 | -0.1464 |
| 63928 | CHP2 | HTA11_866_2000001011 | Human | Colorectum | AD | 6.63e-04 | 5.16e-01 | -0.1001 |
| 63928 | CHP2 | HTA11_1391_2000001011 | Human | Colorectum | AD | 5.57e-18 | 8.21e-01 | -0.059 |
| 63928 | CHP2 | HTA11_2992_2000001011 | Human | Colorectum | SER | 4.25e-12 | 1.24e+00 | -0.1706 |
| 63928 | CHP2 | HTA11_5212_2000001011 | Human | Colorectum | AD | 3.06e-23 | 1.45e+00 | -0.2061 |
| 63928 | CHP2 | HTA11_5216_2000001011 | Human | Colorectum | SER | 3.37e-14 | 1.63e+00 | -0.1462 |
| 63928 | CHP2 | HTA11_9341_2000001011 | Human | Colorectum | SER | 1.50e-02 | 6.09e-01 | -0.00410000000000005 |
| 63928 | CHP2 | HTA11_7862_2000001011 | Human | Colorectum | AD | 4.61e-10 | 9.14e-01 | -0.0179 |
| 63928 | CHP2 | HTA11_7663_2000001011 | Human | Colorectum | SER | 2.53e-02 | 5.98e-01 | 0.0131 |
| 63928 | CHP2 | HTA11_10623_2000001011 | Human | Colorectum | AD | 7.24e-12 | 1.02e+00 | -0.0177 |
| 63928 | CHP2 | HTA11_6801_2000001011 | Human | Colorectum | SER | 4.76e-08 | 1.18e+00 | 0.0171 |
| 63928 | CHP2 | HTA11_7696_3000711011 | Human | Colorectum | AD | 6.76e-03 | -1.94e-01 | 0.0674 |
| 63928 | CHP2 | HTA11_7469_2000001011 | Human | Colorectum | AD | 2.02e-09 | 1.35e+00 | -0.0124 |
| Page: 1 2 3 |
| Tissue | Expression Dynamics | Abbreviation |
| Colorectum (GSE201348) | 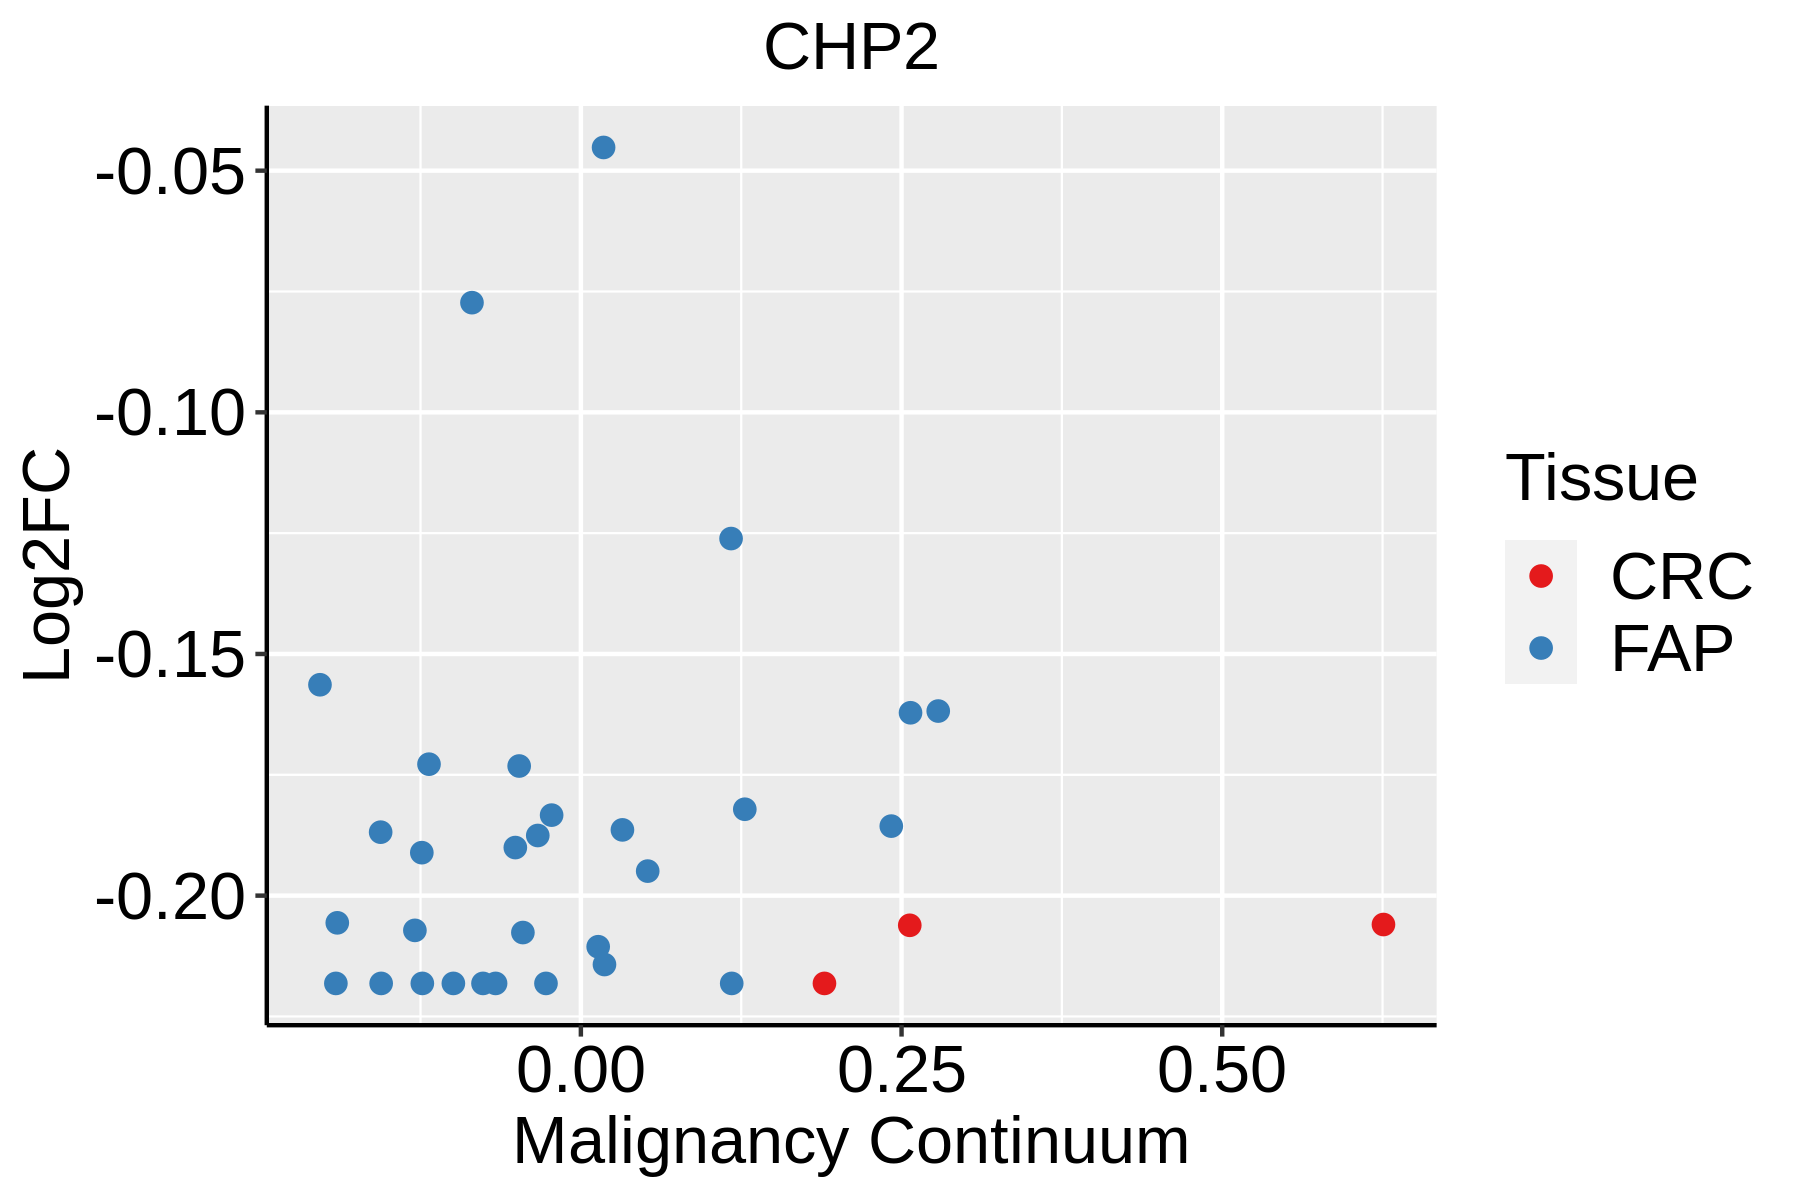 | FAP: Familial adenomatous polyposis |
| CRC: Colorectal cancer | ||
| Colorectum (HTA11) |  | AD: Adenomas |
| SER: Sessile serrated lesions | ||
| MSI-H: Microsatellite-high colorectal cancer | ||
| MSS: Microsatellite stable colorectal cancer | ||
| GC | 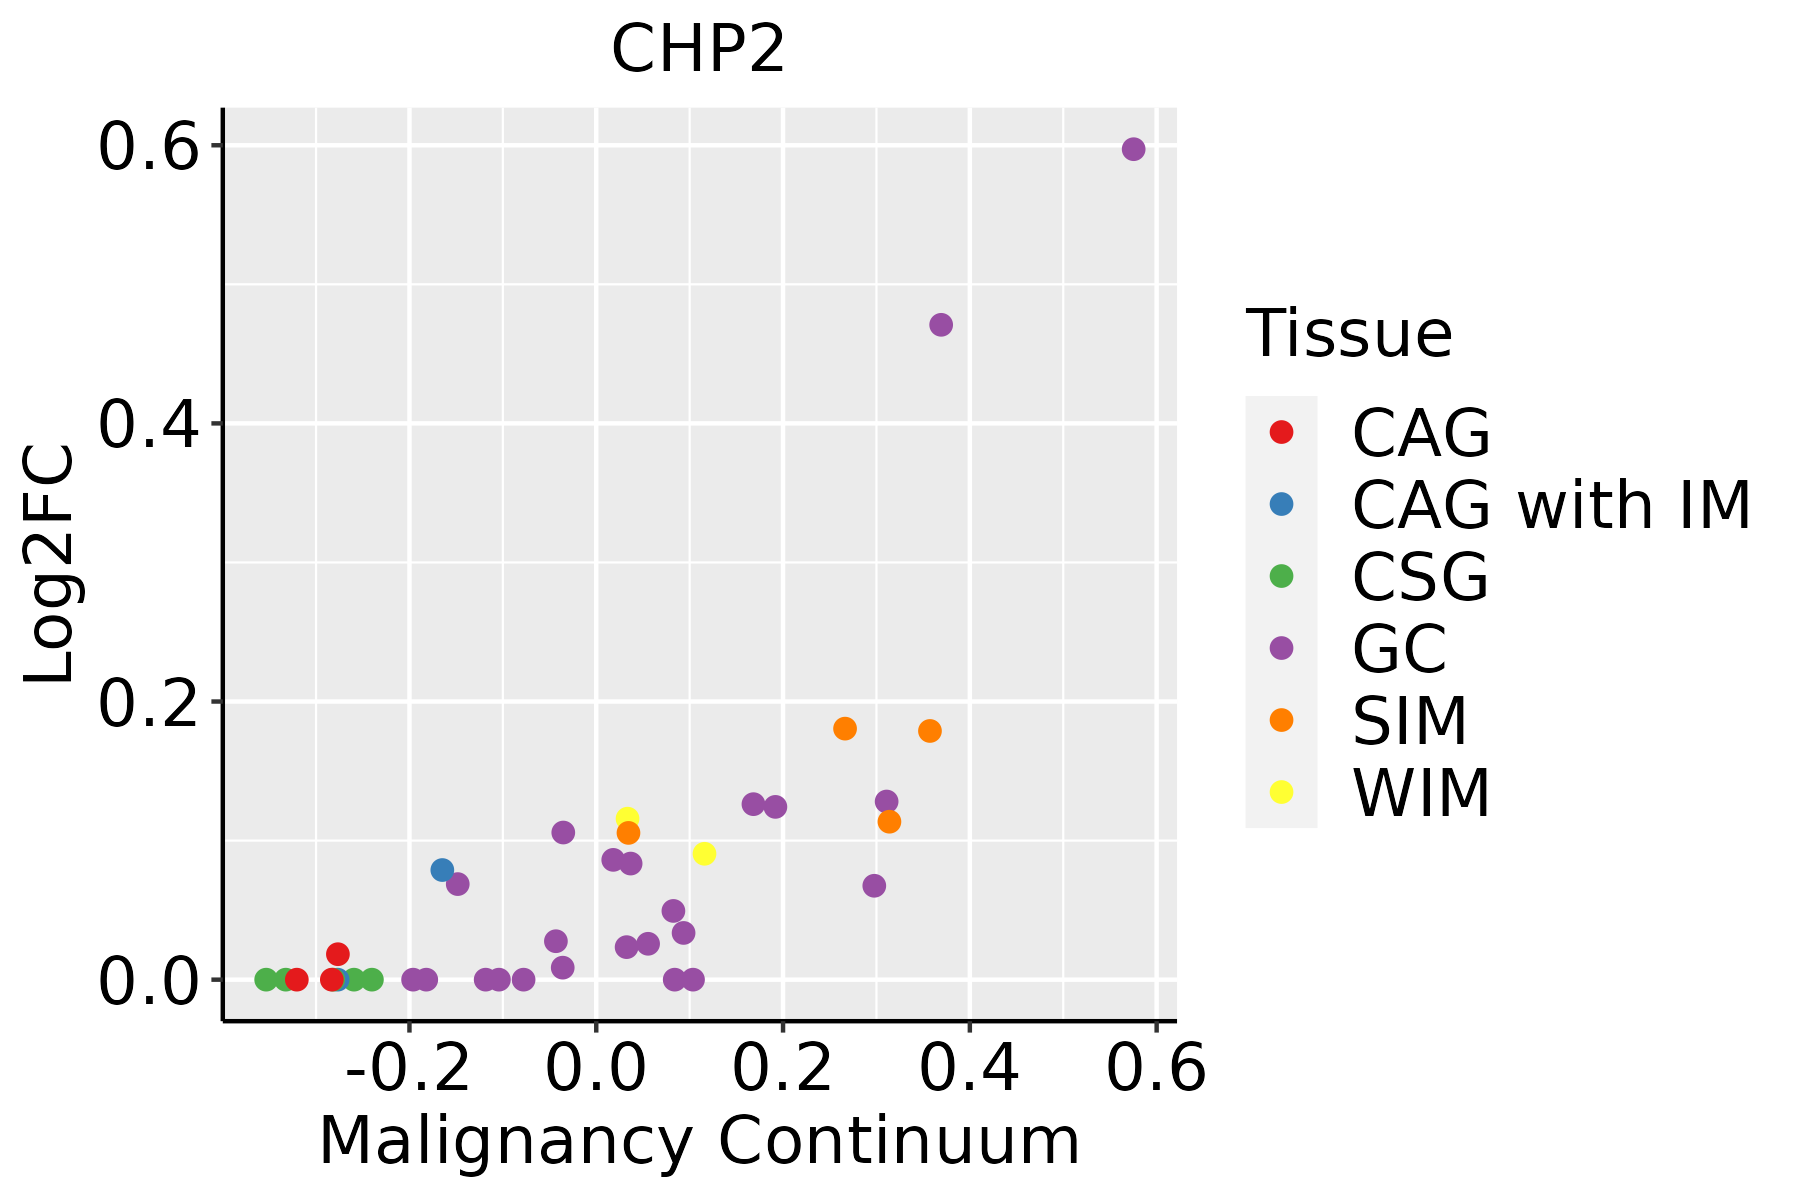 | CAG: Chronic atrophic gastritis |
| CAG with IM: Chronic atrophic gastritis with intestinal metaplasia | ||
| CSG: Chronic superficial gastritis | ||
| GC: Gastric cancer | ||
| SIM: Severe intestinal metaplasia | ||
| WIM: Wild intestinal metaplasia |
| ∗log2FC in expression of this searched gene in stem-like cells from each diseased tissue sample relative to stem-like cells in normal samples in each tissue plotted against the malignancy continuum. Samples are colored based on if they are from different disease stage. |
Top |
Malignant transformation related pathway analysis |
| Find out the enriched GO biological processes and KEGG pathways involved in transition from healthy to precancer to cancer |
| Tissue | Disease Stage | Enriched GO biological Processes |
| Colorectum | AD |  |
| Colorectum | SER |  |
| Colorectum | MSS |  |
| Colorectum | MSI-H |  |
| Colorectum | FAP |  |
| ∗Top 15 enriched GO BP terms are showed in the bar plot of each disease state in each tissue. Each row represents a significant GO biological process which is colored according to the -log10(p.adjust). |
| Page: 1 2 3 4 5 6 7 8 9 |
| GO ID | Tissue | Disease Stage | Description | Gene Ratio | Bg Ratio | pvalue | p.adjust | Count |
| GO:00512224 | Colorectum | FAP | positive regulation of protein transport | 78/2622 | 303/18723 | 3.79e-08 | 3.23e-06 | 78 |
| GO:00069134 | Colorectum | FAP | nucleocytoplasmic transport | 77/2622 | 301/18723 | 6.15e-08 | 4.54e-06 | 77 |
| GO:00511694 | Colorectum | FAP | nuclear transport | 77/2622 | 301/18723 | 6.15e-08 | 4.54e-06 | 77 |
| GO:00725944 | Colorectum | FAP | establishment of protein localization to organelle | 96/2622 | 422/18723 | 6.63e-07 | 3.20e-05 | 96 |
| GO:00163113 | Colorectum | FAP | dephosphorylation | 95/2622 | 417/18723 | 7.07e-07 | 3.32e-05 | 95 |
| GO:00323884 | Colorectum | FAP | positive regulation of intracellular transport | 53/2622 | 202/18723 | 2.99e-06 | 1.10e-04 | 53 |
| GO:00468224 | Colorectum | FAP | regulation of nucleocytoplasmic transport | 32/2622 | 106/18723 | 1.30e-05 | 3.53e-04 | 32 |
| GO:00903164 | Colorectum | FAP | positive regulation of intracellular protein transport | 43/2622 | 160/18723 | 1.30e-05 | 3.53e-04 | 43 |
| GO:00353034 | Colorectum | FAP | regulation of dephosphorylation | 36/2622 | 128/18723 | 2.22e-05 | 5.28e-04 | 36 |
| GO:00323864 | Colorectum | FAP | regulation of intracellular transport | 75/2622 | 337/18723 | 2.38e-05 | 5.60e-04 | 75 |
| GO:00331574 | Colorectum | FAP | regulation of intracellular protein transport | 55/2622 | 229/18723 | 3.20e-05 | 7.20e-04 | 55 |
| GO:00345044 | Colorectum | FAP | protein localization to nucleus | 66/2622 | 290/18723 | 3.47e-05 | 7.64e-04 | 66 |
| GO:19001804 | Colorectum | FAP | regulation of protein localization to nucleus | 36/2622 | 136/18723 | 8.95e-05 | 1.58e-03 | 36 |
| GO:00468244 | Colorectum | FAP | positive regulation of nucleocytoplasmic transport | 20/2622 | 62/18723 | 1.95e-04 | 2.83e-03 | 20 |
| GO:00511704 | Colorectum | FAP | import into nucleus | 39/2622 | 159/18723 | 2.68e-04 | 3.64e-03 | 39 |
| GO:00066064 | Colorectum | FAP | protein import into nucleus | 38/2622 | 155/18723 | 3.23e-04 | 4.15e-03 | 38 |
| GO:00170384 | Colorectum | FAP | protein import | 47/2622 | 206/18723 | 4.10e-04 | 4.94e-03 | 47 |
| GO:19001824 | Colorectum | FAP | positive regulation of protein localization to nucleus | 24/2622 | 87/18723 | 6.65e-04 | 7.22e-03 | 24 |
| GO:00109214 | Colorectum | FAP | regulation of phosphatase activity | 22/2622 | 84/18723 | 2.27e-03 | 1.84e-02 | 22 |
| GO:0048016 | Colorectum | FAP | inositol phosphate-mediated signaling | 16/2622 | 55/18723 | 2.78e-03 | 2.15e-02 | 16 |
| Page: 1 2 3 4 5 6 7 |
| Pathway ID | Tissue | Disease Stage | Description | Gene Ratio | Bg Ratio | pvalue | p.adjust | qvalue | Count |
| Page: 1 |
Top |
Cell-cell communication analysis |
| Identification of potential cell-cell interactions between two cell types and their ligand-receptor pairs for different disease states |
| Ligand | Receptor | LRpair | Pathway | Tissue | Disease Stage |
| Page: 1 |
Top |
Single-cell gene regulatory network inference analysis |
| Find out the significant the regulons (TFs) and the target genes of each regulon across cell types for different disease states |
| TF | Cell Type | Tissue | Disease Stage | Target Gene | RSS | Regulon Activity |
| ∗The dot plots of a searched regulon are shown for all cell subpopulations in each disease state of each tissue based on the regulon specific score inferred using pySCENIC and by calculating the average expression. |
| Page: 1 |
Top |
Somatic mutation of malignant transformation related genes |
| Annotation of somatic variants for genes involved in malignant transformation |
| Hugo Symbol | Variant Class | Variant Classification | dbSNP RS | HGVSc | HGVSp | HGVSp Short | SWISSPROT | BIOTYPE | SIFT | PolyPhen | Tumor Sample Barcode | Tissue | Histology | Sex | Age | Stage | Therapy Types | Drugs | Outcome |
| CHP2 | SNV | Missense_Mutation | rs138042112 | c.523N>A | p.Val175Met | p.V175M | O43745 | protein_coding | tolerated(0.08) | benign(0) | TCGA-A1-A0SG-01 | Breast | breast invasive carcinoma | Female | <65 | I/II | Chemotherapy | SD | |
| CHP2 | SNV | Missense_Mutation | novel | c.326N>C | p.Leu109Pro | p.L109P | O43745 | protein_coding | deleterious(0.04) | benign(0.071) | TCGA-AC-A62V-01 | Breast | breast invasive carcinoma | Male | <65 | III/IV | Targeted Molecular therapy | denosumab | PD |
| CHP2 | SNV | Missense_Mutation | novel | c.462G>T | p.Glu154Asp | p.E154D | O43745 | protein_coding | tolerated(0.45) | benign(0) | TCGA-AN-A046-01 | Breast | breast invasive carcinoma | Female | >=65 | I/II | Unknown | Unknown | SD |
| CHP2 | SNV | Missense_Mutation | rs773423633 | c.475N>T | p.Arg159Cys | p.R159C | O43745 | protein_coding | deleterious(0) | probably_damaging(0.997) | TCGA-A6-6653-01 | Colorectum | colon adenocarcinoma | Male | >=65 | I/II | Unknown | Unknown | SD |
| CHP2 | SNV | Missense_Mutation | c.479N>T | p.Thr160Met | p.T160M | O43745 | protein_coding | deleterious(0) | probably_damaging(0.981) | TCGA-D5-6537-01 | Colorectum | colon adenocarcinoma | Male | <65 | III/IV | Unknown | Unknown | PD | |
| CHP2 | SNV | Missense_Mutation | novel | c.289G>T | p.Asp97Tyr | p.D97Y | O43745 | protein_coding | deleterious(0.05) | benign(0.003) | TCGA-A5-A2K5-01 | Endometrium | uterine corpus endometrioid carcinoma | Female | >=65 | I/II | Unknown | Unknown | SD |
| CHP2 | SNV | Missense_Mutation | rs756892483 | c.512N>T | p.Ala171Val | p.A171V | O43745 | protein_coding | tolerated(0.28) | benign(0.027) | TCGA-AP-A056-01 | Endometrium | uterine corpus endometrioid carcinoma | Female | <65 | I/II | Unknown | Unknown | SD |
| CHP2 | SNV | Missense_Mutation | novel | c.344A>C | p.Lys115Thr | p.K115T | O43745 | protein_coding | deleterious(0) | probably_damaging(0.999) | TCGA-AP-A1E0-01 | Endometrium | uterine corpus endometrioid carcinoma | Female | <65 | III/IV | Chemotherapy | paclitaxel | SD |
| CHP2 | SNV | Missense_Mutation | rs368850634 | c.289N>A | p.Asp97Asn | p.D97N | O43745 | protein_coding | tolerated(0.32) | benign(0.013) | TCGA-AX-A06D-01 | Endometrium | uterine corpus endometrioid carcinoma | Female | >=65 | III/IV | Chemotherapy | carboplatin | PD |
| CHP2 | SNV | Missense_Mutation | rs751008002 | c.578N>A | p.Arg193Gln | p.R193Q | O43745 | protein_coding | deleterious(0.02) | benign(0.34) | TCGA-AX-A2HC-01 | Endometrium | uterine corpus endometrioid carcinoma | Female | <65 | III/IV | Chemotherapy | paclitaxel | PD |
| Page: 1 2 3 |
Top |
Related drugs of malignant transformation related genes |
| Identification of chemicals and drugs interact with genes involved in malignant transfromation |
| (DGIdb 4.0) |
| Entrez ID | Symbol | Category | Interaction Types | Drug Claim Name | Drug Name | PMIDs |
| Page: 1 |

Copyright 2023-Present -The University of Texas Health Science Center at Houston |