
|
|||||
|
 | |
| |
| |
| |
| |
| |
|
Gene: CHMP1A |
Gene summary for CHMP1A |
| Gene information | Species | Human | Gene symbol | CHMP1A | Gene ID | 5119 |
| Gene name | charged multivesicular body protein 1A | |
| Gene Alias | CHMP1 | |
| Cytomap | 16q24.3 | |
| Gene Type | protein-coding | GO ID | GO:0000070 | UniProtAcc | Q9HD42 |
Top |
Malignant transformation analysis |
| Identification of the aberrant gene expression in precancerous and cancerous lesions by comparing the gene expression of stem-like cells in diseased tissues with normal stem cells |
| Entrez ID | Symbol | Replicates | Species | Organ | Tissue | Adj P-value | Log2FC | Malignancy |
| 5119 | CHMP1A | HTA11_2487_2000001011 | Human | Colorectum | SER | 1.88e-09 | 4.32e-01 | -0.1808 |
| 5119 | CHMP1A | HTA11_1938_2000001011 | Human | Colorectum | AD | 1.17e-04 | 2.92e-01 | -0.0811 |
| 5119 | CHMP1A | HTA11_347_2000001011 | Human | Colorectum | AD | 2.08e-04 | 1.90e-01 | -0.1954 |
| 5119 | CHMP1A | HTA11_411_2000001011 | Human | Colorectum | SER | 1.24e-04 | 6.71e-01 | -0.2602 |
| 5119 | CHMP1A | HTA11_2112_2000001011 | Human | Colorectum | SER | 6.66e-05 | 5.53e-01 | -0.2196 |
| 5119 | CHMP1A | HTA11_3361_2000001011 | Human | Colorectum | AD | 6.10e-08 | 4.08e-01 | -0.1207 |
| 5119 | CHMP1A | HTA11_696_2000001011 | Human | Colorectum | AD | 6.47e-08 | 2.72e-01 | -0.1464 |
| 5119 | CHMP1A | HTA11_1391_2000001011 | Human | Colorectum | AD | 1.85e-07 | 2.80e-01 | -0.059 |
| 5119 | CHMP1A | HTA11_2992_2000001011 | Human | Colorectum | SER | 4.15e-02 | 2.49e-01 | -0.1706 |
| 5119 | CHMP1A | HTA11_5212_2000001011 | Human | Colorectum | AD | 3.53e-02 | 2.33e-01 | -0.2061 |
| 5119 | CHMP1A | HTA11_5216_2000001011 | Human | Colorectum | SER | 4.54e-03 | 3.11e-01 | -0.1462 |
| 5119 | CHMP1A | HTA11_866_3004761011 | Human | Colorectum | AD | 9.96e-06 | 1.47e-01 | 0.096 |
| 5119 | CHMP1A | HTA11_10623_2000001011 | Human | Colorectum | AD | 6.89e-04 | 3.56e-01 | -0.0177 |
| 5119 | CHMP1A | HTA11_7696_3000711011 | Human | Colorectum | AD | 4.60e-07 | 2.44e-01 | 0.0674 |
| 5119 | CHMP1A | HTA11_99999970781_79442 | Human | Colorectum | MSS | 3.52e-03 | 1.21e-01 | 0.294 |
| 5119 | CHMP1A | HTA11_99999965104_69814 | Human | Colorectum | MSS | 1.89e-02 | 1.80e-01 | 0.281 |
| 5119 | CHMP1A | HTA11_99999971662_82457 | Human | Colorectum | MSS | 1.13e-10 | 3.63e-01 | 0.3859 |
| 5119 | CHMP1A | LZE2T | Human | Esophagus | ESCC | 6.62e-04 | 5.96e-01 | 0.082 |
| 5119 | CHMP1A | LZE4T | Human | Esophagus | ESCC | 3.78e-10 | 3.41e-01 | 0.0811 |
| 5119 | CHMP1A | LZE7T | Human | Esophagus | ESCC | 2.00e-04 | 3.47e-01 | 0.0667 |
| Page: 1 2 3 4 5 6 7 |
| Tissue | Expression Dynamics | Abbreviation |
| Colorectum (GSE201348) | 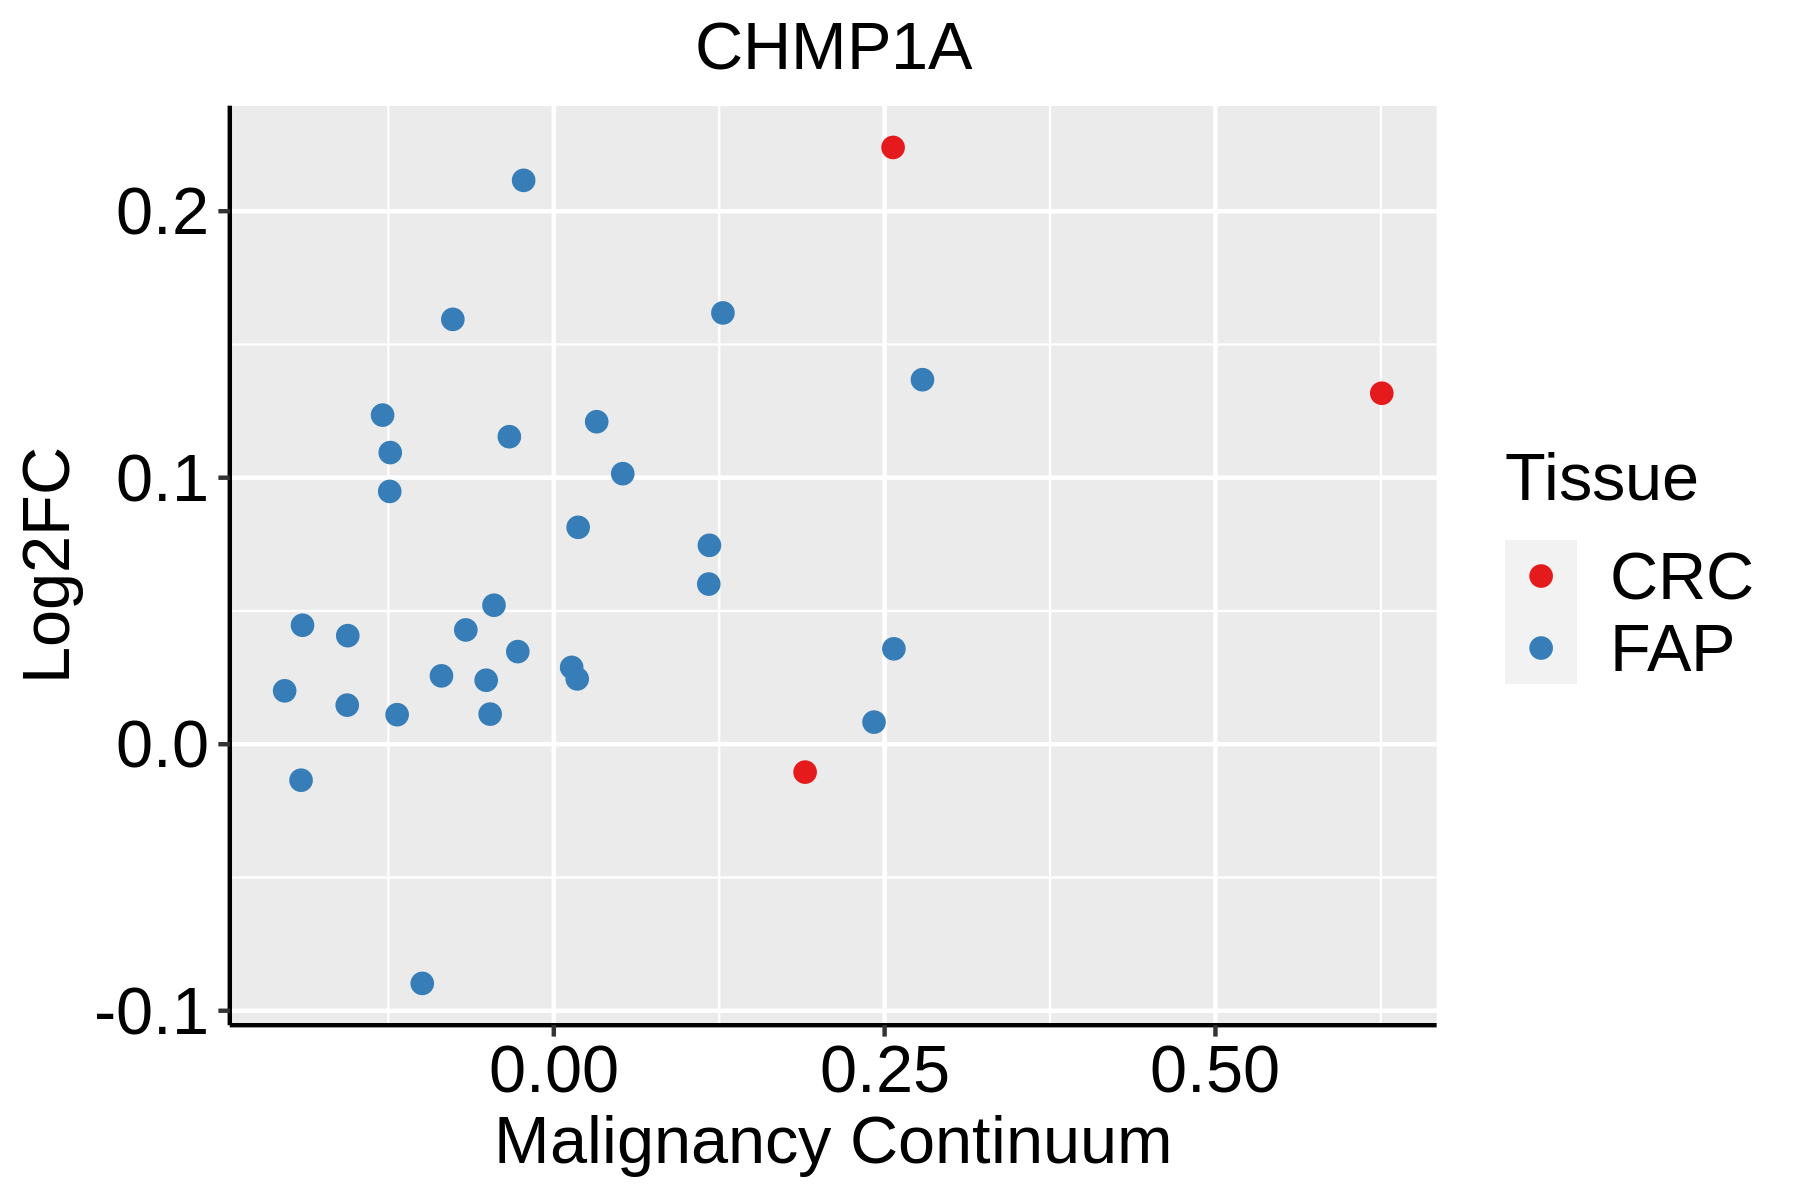 | FAP: Familial adenomatous polyposis |
| CRC: Colorectal cancer | ||
| Colorectum (HTA11) |  | AD: Adenomas |
| SER: Sessile serrated lesions | ||
| MSI-H: Microsatellite-high colorectal cancer | ||
| MSS: Microsatellite stable colorectal cancer | ||
| Esophagus |  | ESCC: Esophageal squamous cell carcinoma |
| HGIN: High-grade intraepithelial neoplasias | ||
| LGIN: Low-grade intraepithelial neoplasias | ||
| Liver | 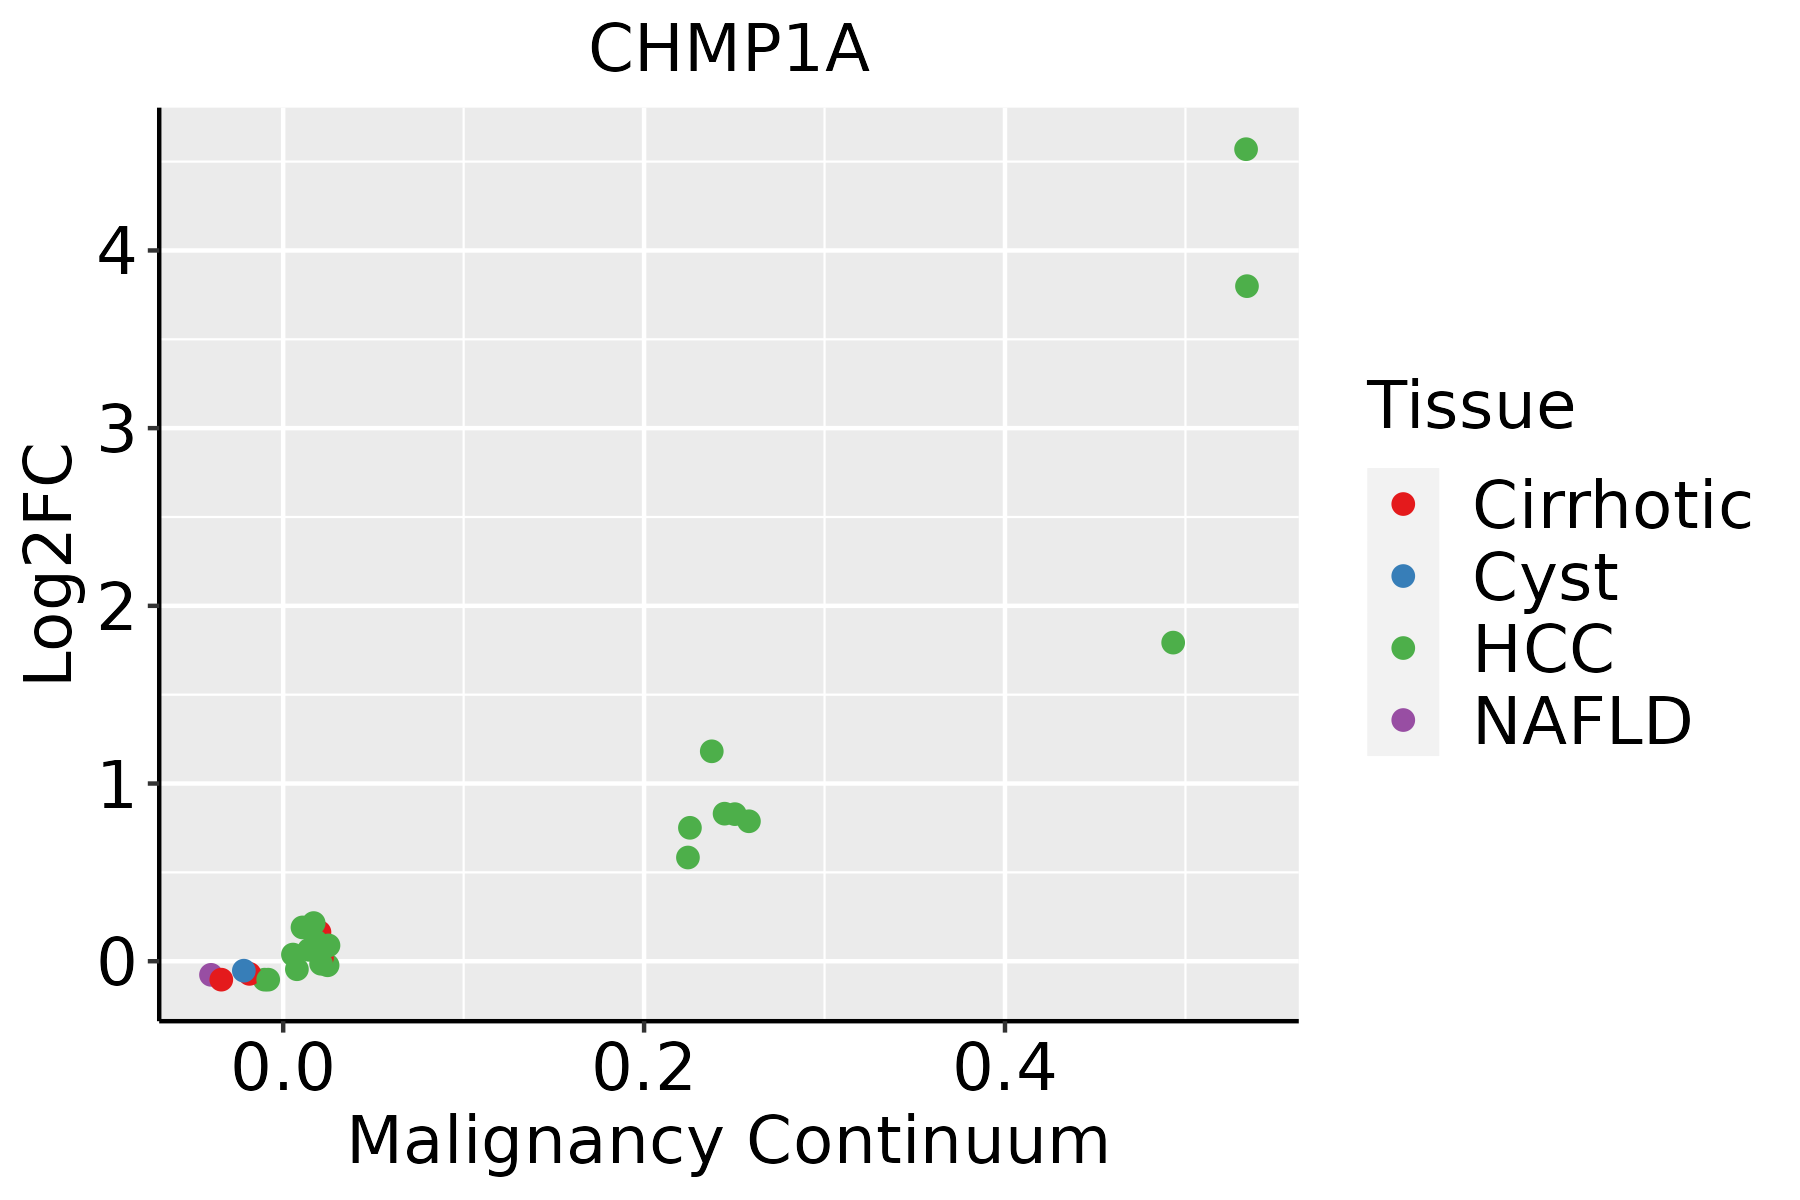 | HCC: Hepatocellular carcinoma |
| NAFLD: Non-alcoholic fatty liver disease | ||
| Oral Cavity |  | EOLP: Erosive Oral lichen planus |
| LP: leukoplakia | ||
| NEOLP: Non-erosive oral lichen planus | ||
| OSCC: Oral squamous cell carcinoma | ||
| Skin | 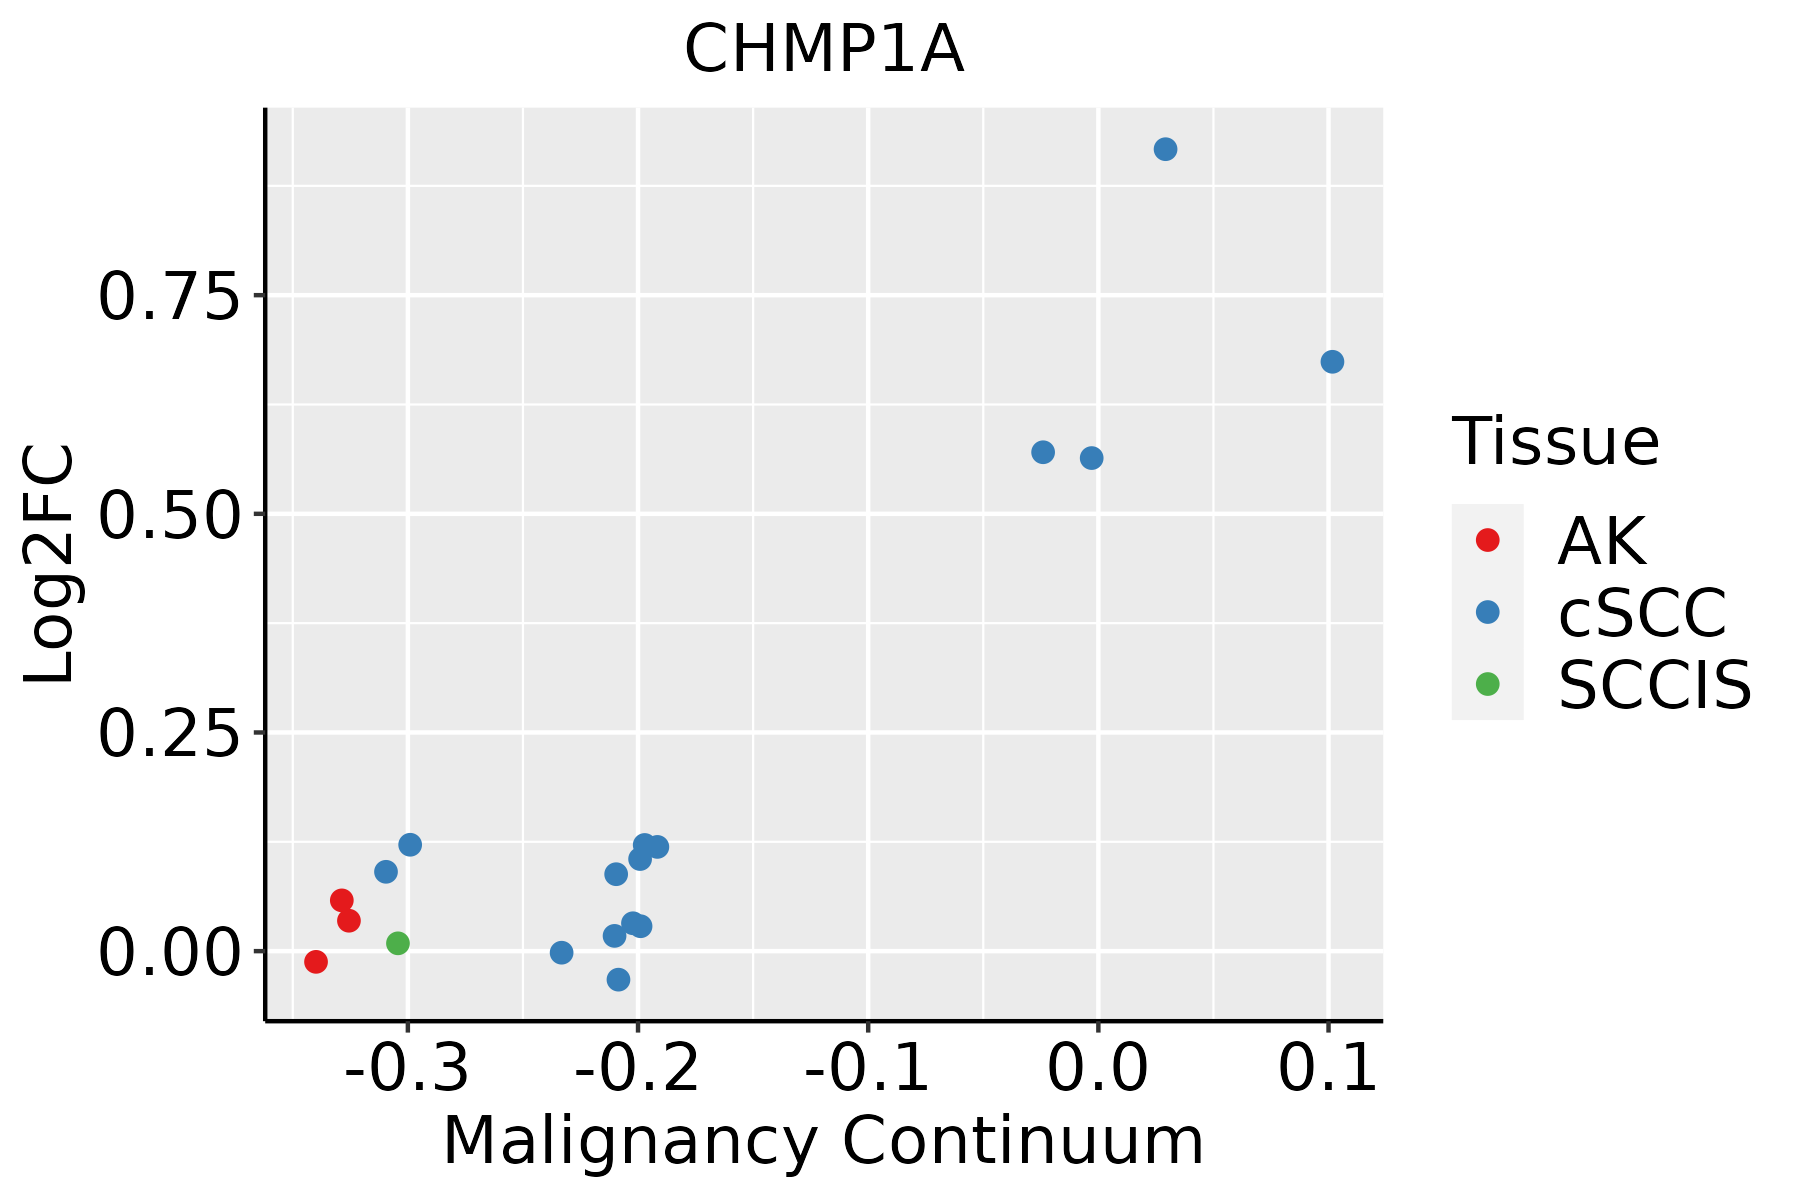 | AK: Actinic keratosis |
| cSCC: Cutaneous squamous cell carcinoma | ||
| SCCIS:squamous cell carcinoma in situ | ||
| Thyroid | 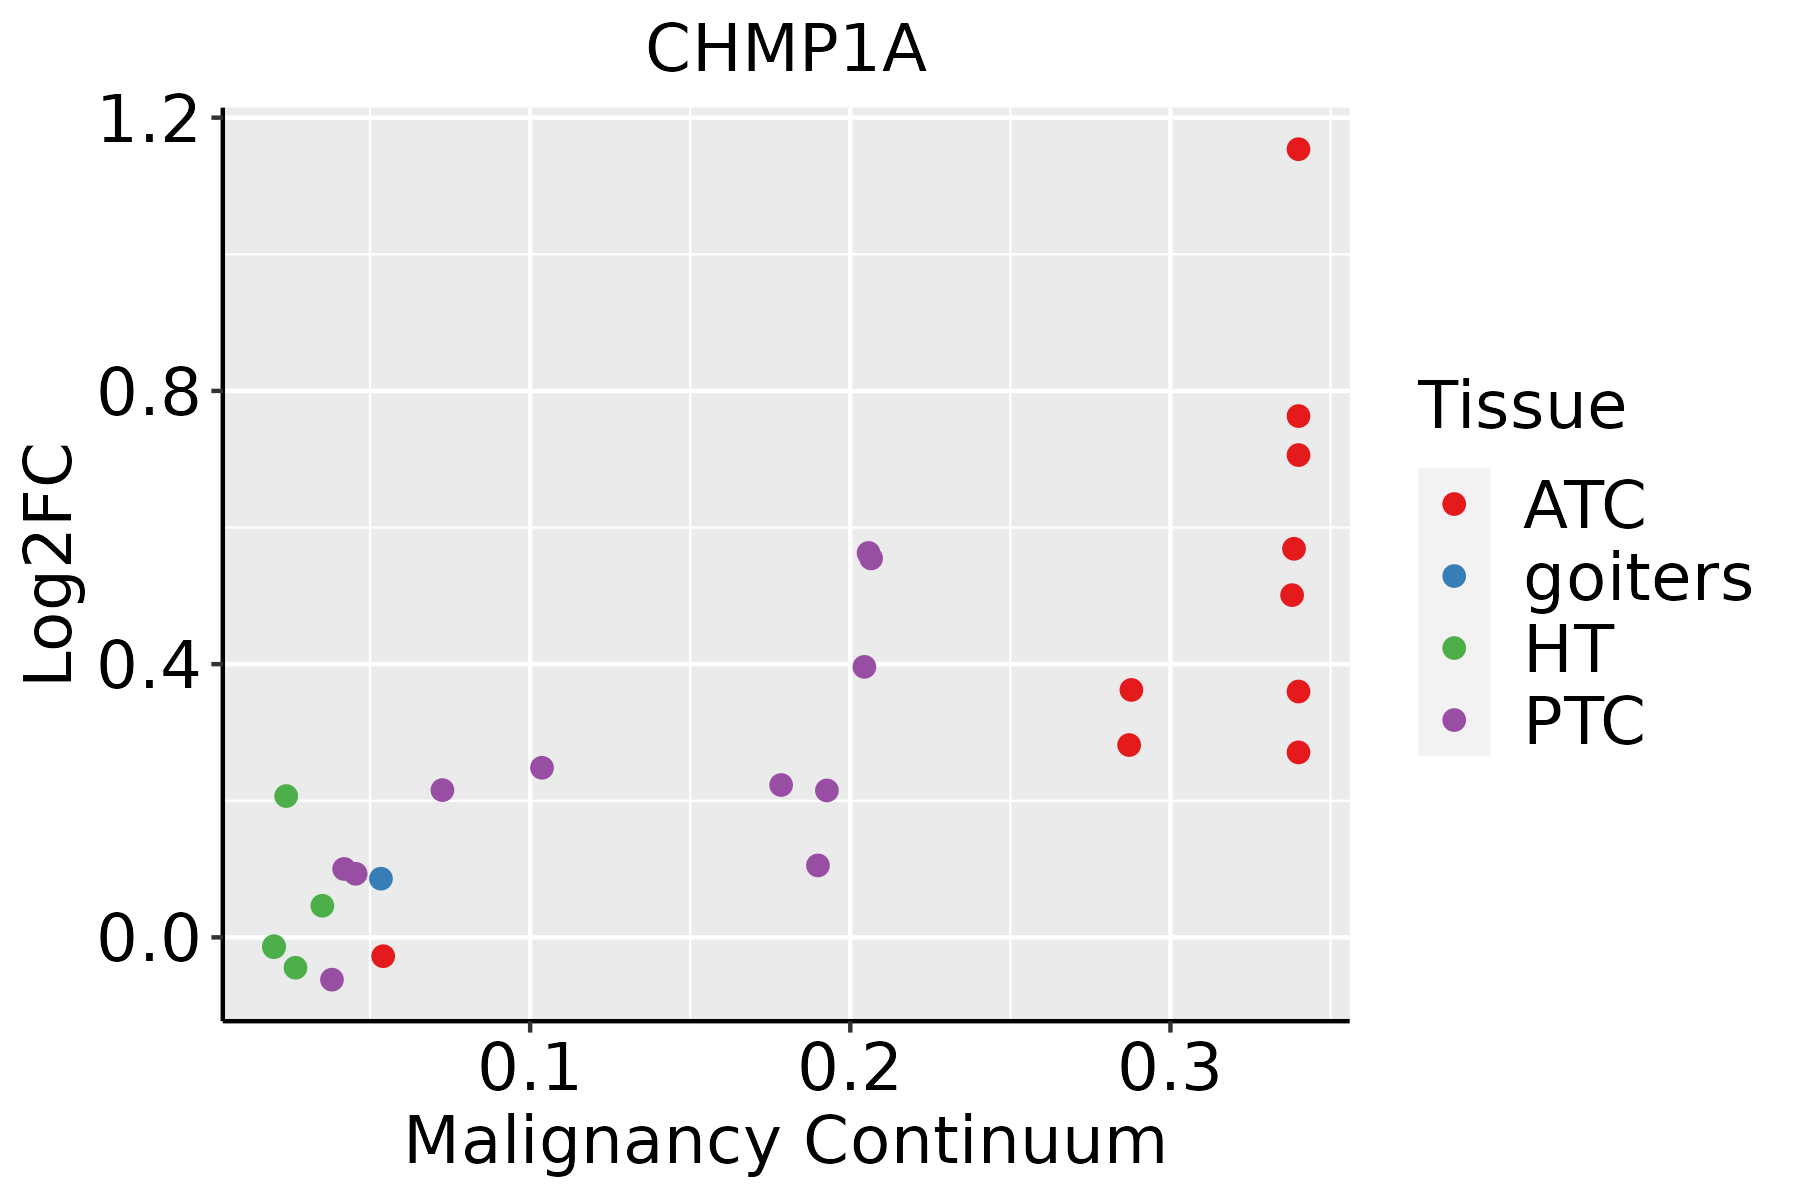 | ATC: Anaplastic thyroid cancer |
| HT: Hashimoto's thyroiditis | ||
| PTC: Papillary thyroid cancer |
| ∗log2FC in expression of this searched gene in stem-like cells from each diseased tissue sample relative to stem-like cells in normal samples in each tissue plotted against the malignancy continuum. Samples are colored based on if they are from different disease stage. |
Top |
Malignant transformation related pathway analysis |
| Find out the enriched GO biological processes and KEGG pathways involved in transition from healthy to precancer to cancer |
| Tissue | Disease Stage | Enriched GO biological Processes |
| Colorectum | AD |  |
| Colorectum | SER |  |
| Colorectum | MSS |  |
| Colorectum | MSI-H |  |
| Colorectum | FAP |  |
| ∗Top 15 enriched GO BP terms are showed in the bar plot of each disease state in each tissue. Each row represents a significant GO biological process which is colored according to the -log10(p.adjust). |
| Page: 1 2 3 4 5 6 7 8 9 |
| GO ID | Tissue | Disease Stage | Description | Gene Ratio | Bg Ratio | pvalue | p.adjust | Count |
| GO:0010824 | Colorectum | SER | regulation of centrosome duplication | 15/2897 | 45/18723 | 2.29e-03 | 2.19e-02 | 15 |
| GO:0045324 | Colorectum | SER | late endosome to vacuole transport | 10/2897 | 25/18723 | 2.70e-03 | 2.44e-02 | 10 |
| GO:00901691 | Colorectum | SER | regulation of spindle assembly | 10/2897 | 25/18723 | 2.70e-03 | 2.44e-02 | 10 |
| GO:0090224 | Colorectum | SER | regulation of spindle organization | 13/2897 | 39/18723 | 4.39e-03 | 3.51e-02 | 13 |
| GO:00602361 | Colorectum | SER | regulation of mitotic spindle organization | 12/2897 | 35/18723 | 4.72e-03 | 3.71e-02 | 12 |
| GO:00160322 | Colorectum | MSS | viral process | 157/3467 | 415/18723 | 7.94e-21 | 6.19e-18 | 157 |
| GO:00190582 | Colorectum | MSS | viral life cycle | 111/3467 | 317/18723 | 1.65e-12 | 2.95e-10 | 111 |
| GO:00161972 | Colorectum | MSS | endosomal transport | 79/3467 | 230/18723 | 7.04e-09 | 4.39e-07 | 79 |
| GO:00224112 | Colorectum | MSS | cellular component disassembly | 130/3467 | 443/18723 | 1.44e-08 | 8.46e-07 | 130 |
| GO:00516562 | Colorectum | MSS | establishment of organelle localization | 115/3467 | 390/18723 | 7.30e-08 | 3.67e-06 | 115 |
| GO:00160502 | Colorectum | MSS | vesicle organization | 93/3467 | 300/18723 | 1.04e-07 | 4.97e-06 | 93 |
| GO:00329842 | Colorectum | MSS | protein-containing complex disassembly | 69/3467 | 224/18723 | 5.61e-06 | 1.50e-04 | 69 |
| GO:00070342 | Colorectum | MSS | vacuolar transport | 52/3467 | 157/18723 | 8.25e-06 | 2.07e-04 | 52 |
| GO:00362572 | Colorectum | MSS | multivesicular body organization | 15/3467 | 31/18723 | 1.48e-04 | 2.18e-03 | 15 |
| GO:00362582 | Colorectum | MSS | multivesicular body assembly | 14/3467 | 30/18723 | 3.95e-04 | 4.91e-03 | 14 |
| GO:00070511 | Colorectum | MSS | spindle organization | 53/3467 | 184/18723 | 4.23e-04 | 5.19e-03 | 53 |
| GO:00719852 | Colorectum | MSS | multivesicular body sorting pathway | 16/3467 | 37/18723 | 4.51e-04 | 5.38e-03 | 16 |
| GO:19028501 | Colorectum | MSS | microtubule cytoskeleton organization involved in mitosis | 44/3467 | 147/18723 | 5.17e-04 | 5.98e-03 | 44 |
| GO:00070322 | Colorectum | MSS | endosome organization | 28/3467 | 82/18723 | 5.44e-04 | 6.07e-03 | 28 |
| GO:00009102 | Colorectum | MSS | cytokinesis | 49/3467 | 173/18723 | 1.02e-03 | 1.02e-02 | 49 |
| Page: 1 2 3 4 5 6 7 8 9 10 11 12 13 14 15 16 17 18 19 20 21 22 23 24 25 26 27 28 |
| Pathway ID | Tissue | Disease Stage | Description | Gene Ratio | Bg Ratio | pvalue | p.adjust | qvalue | Count |
| hsa04144 | Colorectum | AD | Endocytosis | 111/2092 | 251/8465 | 5.95e-12 | 1.42e-10 | 9.08e-11 | 111 |
| hsa041441 | Colorectum | AD | Endocytosis | 111/2092 | 251/8465 | 5.95e-12 | 1.42e-10 | 9.08e-11 | 111 |
| hsa041442 | Colorectum | SER | Endocytosis | 81/1580 | 251/8465 | 1.14e-07 | 2.36e-06 | 1.71e-06 | 81 |
| hsa04217 | Colorectum | SER | Necroptosis | 47/1580 | 159/8465 | 5.21e-04 | 4.44e-03 | 3.22e-03 | 47 |
| hsa041443 | Colorectum | SER | Endocytosis | 81/1580 | 251/8465 | 1.14e-07 | 2.36e-06 | 1.71e-06 | 81 |
| hsa042171 | Colorectum | SER | Necroptosis | 47/1580 | 159/8465 | 5.21e-04 | 4.44e-03 | 3.22e-03 | 47 |
| hsa041444 | Colorectum | MSS | Endocytosis | 102/1875 | 251/8465 | 1.85e-11 | 4.43e-10 | 2.71e-10 | 102 |
| hsa041445 | Colorectum | MSS | Endocytosis | 102/1875 | 251/8465 | 1.85e-11 | 4.43e-10 | 2.71e-10 | 102 |
| hsa04144210 | Esophagus | ESCC | Endocytosis | 186/4205 | 251/8465 | 9.74e-16 | 4.66e-14 | 2.39e-14 | 186 |
| hsa0414437 | Esophagus | ESCC | Endocytosis | 186/4205 | 251/8465 | 9.74e-16 | 4.66e-14 | 2.39e-14 | 186 |
| hsa0414412 | Liver | Cirrhotic | Endocytosis | 119/2530 | 251/8465 | 2.33e-09 | 4.56e-08 | 2.81e-08 | 119 |
| hsa0414413 | Liver | Cirrhotic | Endocytosis | 119/2530 | 251/8465 | 2.33e-09 | 4.56e-08 | 2.81e-08 | 119 |
| hsa0414422 | Liver | HCC | Endocytosis | 178/4020 | 251/8465 | 2.03e-14 | 5.22e-13 | 2.91e-13 | 178 |
| hsa0414432 | Liver | HCC | Endocytosis | 178/4020 | 251/8465 | 2.03e-14 | 5.22e-13 | 2.91e-13 | 178 |
| hsa0414427 | Oral cavity | OSCC | Endocytosis | 174/3704 | 251/8465 | 9.42e-17 | 4.51e-15 | 2.29e-15 | 174 |
| hsa04144112 | Oral cavity | OSCC | Endocytosis | 174/3704 | 251/8465 | 9.42e-17 | 4.51e-15 | 2.29e-15 | 174 |
| hsa0414428 | Oral cavity | LP | Endocytosis | 121/2418 | 251/8465 | 1.89e-11 | 3.70e-10 | 2.38e-10 | 121 |
| hsa0421714 | Oral cavity | LP | Necroptosis | 59/2418 | 159/8465 | 1.15e-02 | 3.91e-02 | 2.52e-02 | 59 |
| hsa0414436 | Oral cavity | LP | Endocytosis | 121/2418 | 251/8465 | 1.89e-11 | 3.70e-10 | 2.38e-10 | 121 |
| hsa0421715 | Oral cavity | LP | Necroptosis | 59/2418 | 159/8465 | 1.15e-02 | 3.91e-02 | 2.52e-02 | 59 |
| Page: 1 |
Top |
Cell-cell communication analysis |
| Identification of potential cell-cell interactions between two cell types and their ligand-receptor pairs for different disease states |
| Ligand | Receptor | LRpair | Pathway | Tissue | Disease Stage |
| Page: 1 |
Top |
Single-cell gene regulatory network inference analysis |
| Find out the significant the regulons (TFs) and the target genes of each regulon across cell types for different disease states |
| TF | Cell Type | Tissue | Disease Stage | Target Gene | RSS | Regulon Activity |
| ∗The dot plots of a searched regulon are shown for all cell subpopulations in each disease state of each tissue based on the regulon specific score inferred using pySCENIC and by calculating the average expression. |
| Page: 1 |
Top |
Somatic mutation of malignant transformation related genes |
| Annotation of somatic variants for genes involved in malignant transformation |
| Hugo Symbol | Variant Class | Variant Classification | dbSNP RS | HGVSc | HGVSp | HGVSp Short | SWISSPROT | BIOTYPE | SIFT | PolyPhen | Tumor Sample Barcode | Tissue | Histology | Sex | Age | Stage | Therapy Types | Drugs | Outcome |
| CHMP1A | SNV | Missense_Mutation | c.133N>A | p.Ala45Thr | p.A45T | Q9HD42 | protein_coding | deleterious(0) | benign(0.229) | TCGA-A6-2686-01 | Colorectum | colon adenocarcinoma | Female | >=65 | I/II | Unknown | Unknown | SD | |
| CHMP1A | SNV | Missense_Mutation | c.224N>C | p.Lys75Thr | p.K75T | Q9HD42 | protein_coding | deleterious(0) | possibly_damaging(0.516) | TCGA-AD-6889-01 | Colorectum | colon adenocarcinoma | Male | >=65 | I/II | Chemotherapy | xeloda | PD | |
| CHMP1A | SNV | Missense_Mutation | rs767659184 | c.197C>T | p.Ala66Val | p.A66V | Q9HD42 | protein_coding | deleterious(0) | possibly_damaging(0.581) | TCGA-CK-4951-01 | Colorectum | colon adenocarcinoma | Female | >=65 | I/II | Unknown | Unknown | PD |
| CHMP1A | SNV | Missense_Mutation | c.211N>A | p.Ala71Thr | p.A71T | Q9HD42 | protein_coding | deleterious(0) | benign(0.164) | TCGA-CM-6162-01 | Colorectum | colon adenocarcinoma | Female | <65 | III/IV | Chemotherapy | oxaliplatin | SD | |
| CHMP1A | SNV | Missense_Mutation | rs764268997 | c.565N>T | p.Arg189Trp | p.R189W | Q9HD42 | protein_coding | deleterious(0) | probably_damaging(0.936) | TCGA-DM-A0X9-01 | Colorectum | colon adenocarcinoma | Female | >=65 | I/II | Unknown | Unknown | SD |
| CHMP1A | SNV | Missense_Mutation | novel | c.425N>T | p.Pro142Leu | p.P142L | Q9HD42 | protein_coding | deleterious(0) | probably_damaging(1) | TCGA-A5-A2K3-01 | Endometrium | uterine corpus endometrioid carcinoma | Female | >=65 | I/II | Chemotherapy | carboplatin | SD |
| CHMP1A | SNV | Missense_Mutation | rs771909969 | c.514N>A | p.Ala172Thr | p.A172T | Q9HD42 | protein_coding | tolerated(0.67) | benign(0.009) | TCGA-AP-A0LS-01 | Endometrium | uterine corpus endometrioid carcinoma | Female | <65 | I/II | Unknown | Unknown | SD |
| CHMP1A | SNV | Missense_Mutation | rs771909969 | c.514G>A | p.Ala172Thr | p.A172T | Q9HD42 | protein_coding | tolerated(0.67) | benign(0.009) | TCGA-AP-A1DV-01 | Endometrium | uterine corpus endometrioid carcinoma | Female | <65 | I/II | Unknown | Unknown | SD |
| CHMP1A | SNV | Missense_Mutation | novel | c.236N>A | p.Ala79Asp | p.A79D | Q9HD42 | protein_coding | deleterious(0) | probably_damaging(0.989) | TCGA-AX-A0J1-01 | Endometrium | uterine corpus endometrioid carcinoma | Female | >=65 | I/II | Unknown | Unknown | SD |
| CHMP1A | SNV | Missense_Mutation | novel | c.35N>T | p.Ala12Val | p.A12V | Q9HD42 | protein_coding | tolerated(0.09) | benign(0.005) | TCGA-B5-A3FC-01 | Endometrium | uterine corpus endometrioid carcinoma | Female | <65 | I/II | Unknown | Unknown | SD |
| Page: 1 2 |
Top |
Related drugs of malignant transformation related genes |
| Identification of chemicals and drugs interact with genes involved in malignant transfromation |
| (DGIdb 4.0) |
| Entrez ID | Symbol | Category | Interaction Types | Drug Claim Name | Drug Name | PMIDs |
| Page: 1 |

Copyright 2023-Present -The University of Texas Health Science Center at Houston |