
|
|||||
|
 | |
| |
| |
| |
| |
| |
|
Gene: CHD3 |
Gene summary for CHD3 |
| Gene information | Species | Human | Gene symbol | CHD3 | Gene ID | 1107 |
| Gene name | chromodomain helicase DNA binding protein 3 | |
| Gene Alias | Mi-2a | |
| Cytomap | 17p13.1 | |
| Gene Type | protein-coding | GO ID | GO:0000122 | UniProtAcc | B3KWV4 |
Top |
Malignant transformation analysis |
| Identification of the aberrant gene expression in precancerous and cancerous lesions by comparing the gene expression of stem-like cells in diseased tissues with normal stem cells |
| Entrez ID | Symbol | Replicates | Species | Organ | Tissue | Adj P-value | Log2FC | Malignancy |
| 1107 | CHD3 | HTA11_3410_2000001011 | Human | Colorectum | AD | 2.26e-03 | 5.43e-02 | 0.0155 |
| 1107 | CHD3 | HTA11_1938_2000001011 | Human | Colorectum | AD | 1.75e-02 | 1.90e-01 | -0.0811 |
| 1107 | CHD3 | HTA11_347_2000001011 | Human | Colorectum | AD | 1.15e-02 | 1.59e-01 | -0.1954 |
| 1107 | CHD3 | HTA11_696_2000001011 | Human | Colorectum | AD | 3.35e-04 | 2.40e-01 | -0.1464 |
| 1107 | CHD3 | HTA11_1391_2000001011 | Human | Colorectum | AD | 1.07e-03 | 2.92e-01 | -0.059 |
| 1107 | CHD3 | HTA11_10711_2000001011 | Human | Colorectum | AD | 9.05e-03 | 3.80e-01 | 0.0338 |
| 1107 | CHD3 | HTA11_7696_3000711011 | Human | Colorectum | AD | 4.61e-03 | 2.76e-01 | 0.0674 |
| 1107 | CHD3 | A015-C-203 | Human | Colorectum | FAP | 2.48e-03 | 1.90e-01 | -0.1294 |
| 1107 | CHD3 | A001-C-119 | Human | Colorectum | FAP | 2.58e-05 | 5.94e-01 | -0.1557 |
| 1107 | CHD3 | A001-C-108 | Human | Colorectum | FAP | 1.23e-03 | 3.31e-01 | -0.0272 |
| 1107 | CHD3 | A002-C-021 | Human | Colorectum | FAP | 3.23e-02 | 3.38e-01 | 0.1171 |
| 1107 | CHD3 | A002-C-205 | Human | Colorectum | FAP | 6.14e-05 | 4.37e-01 | -0.1236 |
| 1107 | CHD3 | A001-C-104 | Human | Colorectum | FAP | 2.69e-05 | 4.05e-01 | 0.0184 |
| 1107 | CHD3 | A015-C-106 | Human | Colorectum | FAP | 1.15e-02 | 2.94e-01 | -0.0511 |
| 1107 | CHD3 | A015-C-104 | Human | Colorectum | FAP | 1.32e-10 | 3.70e-01 | -0.1899 |
| 1107 | CHD3 | A002-C-116 | Human | Colorectum | FAP | 7.12e-04 | 4.55e-02 | -0.0452 |
| 1107 | CHD3 | A014-C-008 | Human | Colorectum | FAP | 2.27e-07 | 6.29e-01 | -0.191 |
| 1107 | CHD3 | LZE4T | Human | Esophagus | ESCC | 1.28e-09 | 3.59e-01 | 0.0811 |
| 1107 | CHD3 | LZE5T | Human | Esophagus | ESCC | 2.79e-04 | 3.67e-01 | 0.0514 |
| 1107 | CHD3 | LZE7T | Human | Esophagus | ESCC | 1.06e-11 | 4.55e-01 | 0.0667 |
| Page: 1 2 3 4 5 6 7 8 |
| Tissue | Expression Dynamics | Abbreviation |
| Colorectum (GSE201348) | 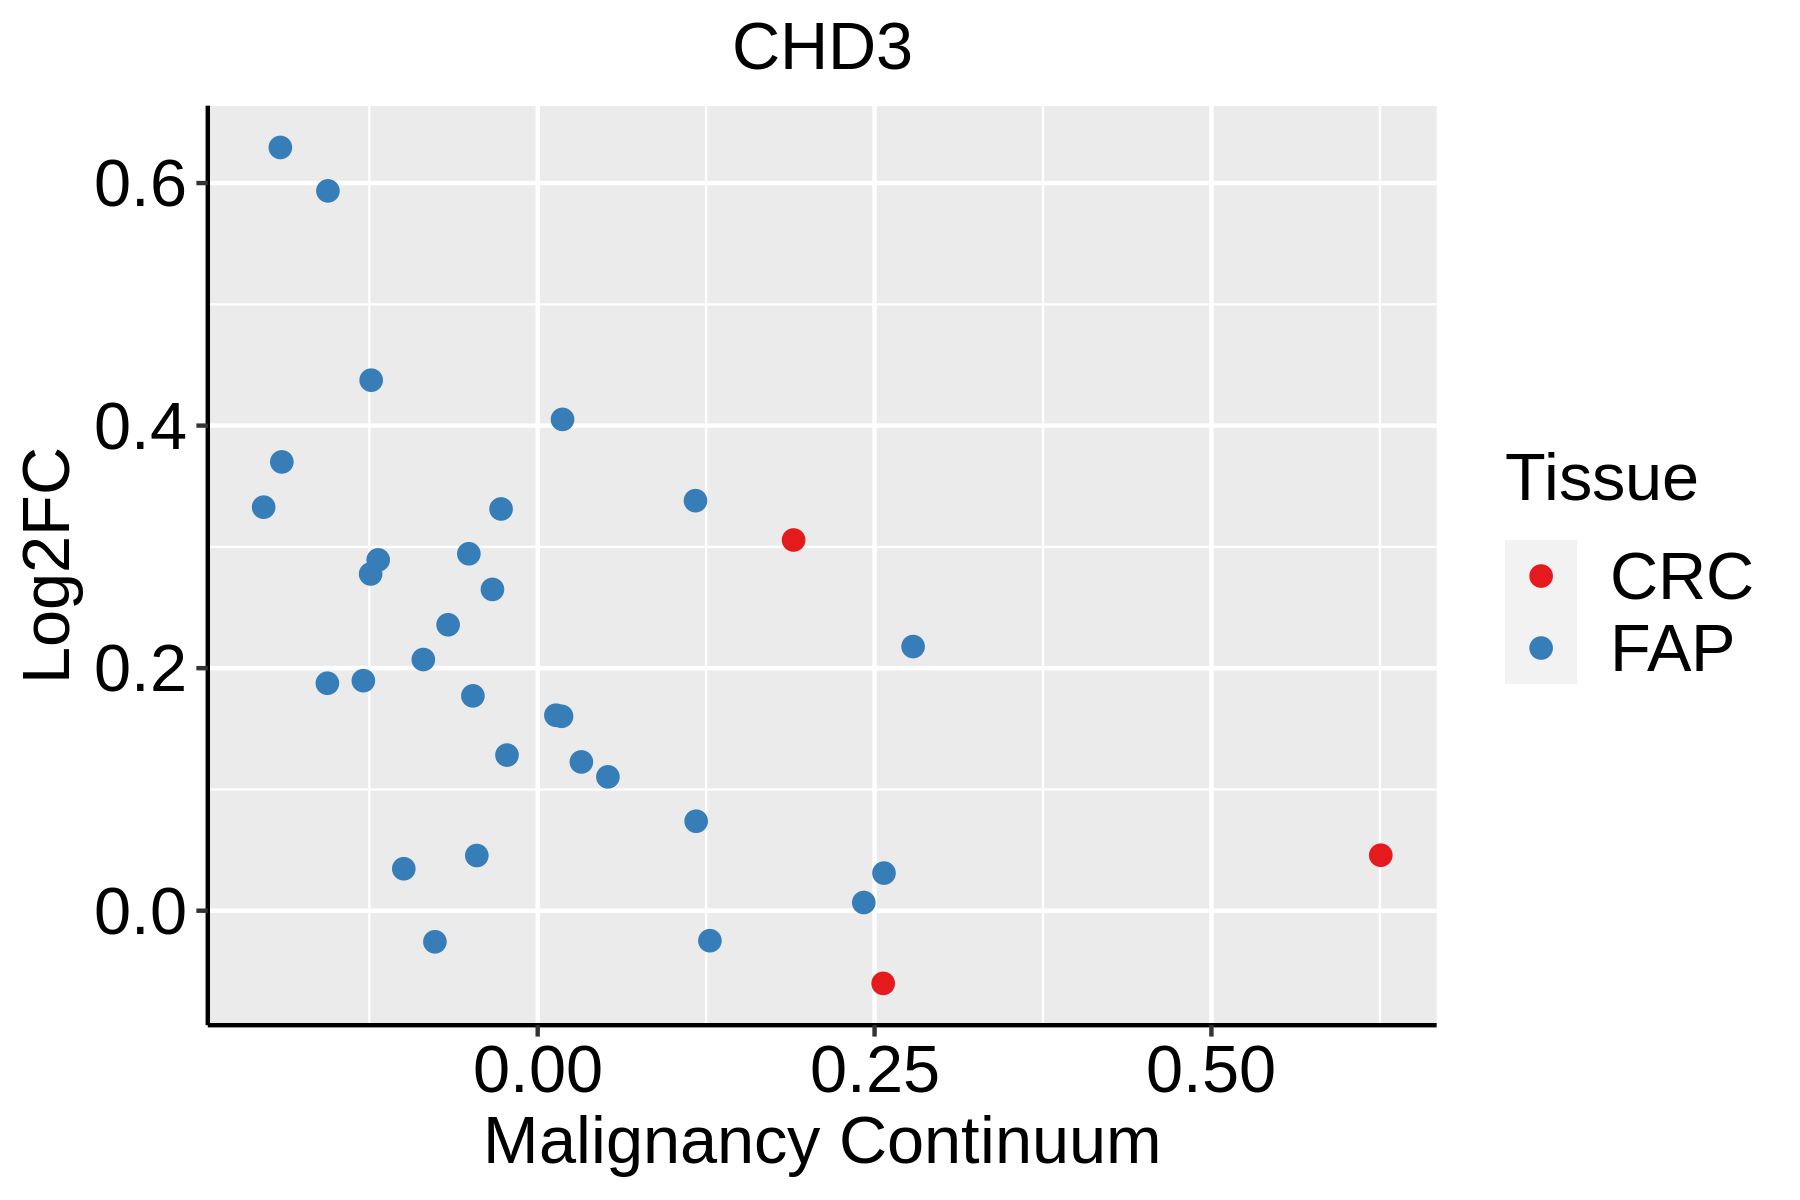 | FAP: Familial adenomatous polyposis |
| CRC: Colorectal cancer | ||
| Colorectum (HTA11) |  | AD: Adenomas |
| SER: Sessile serrated lesions | ||
| MSI-H: Microsatellite-high colorectal cancer | ||
| MSS: Microsatellite stable colorectal cancer | ||
| Esophagus | 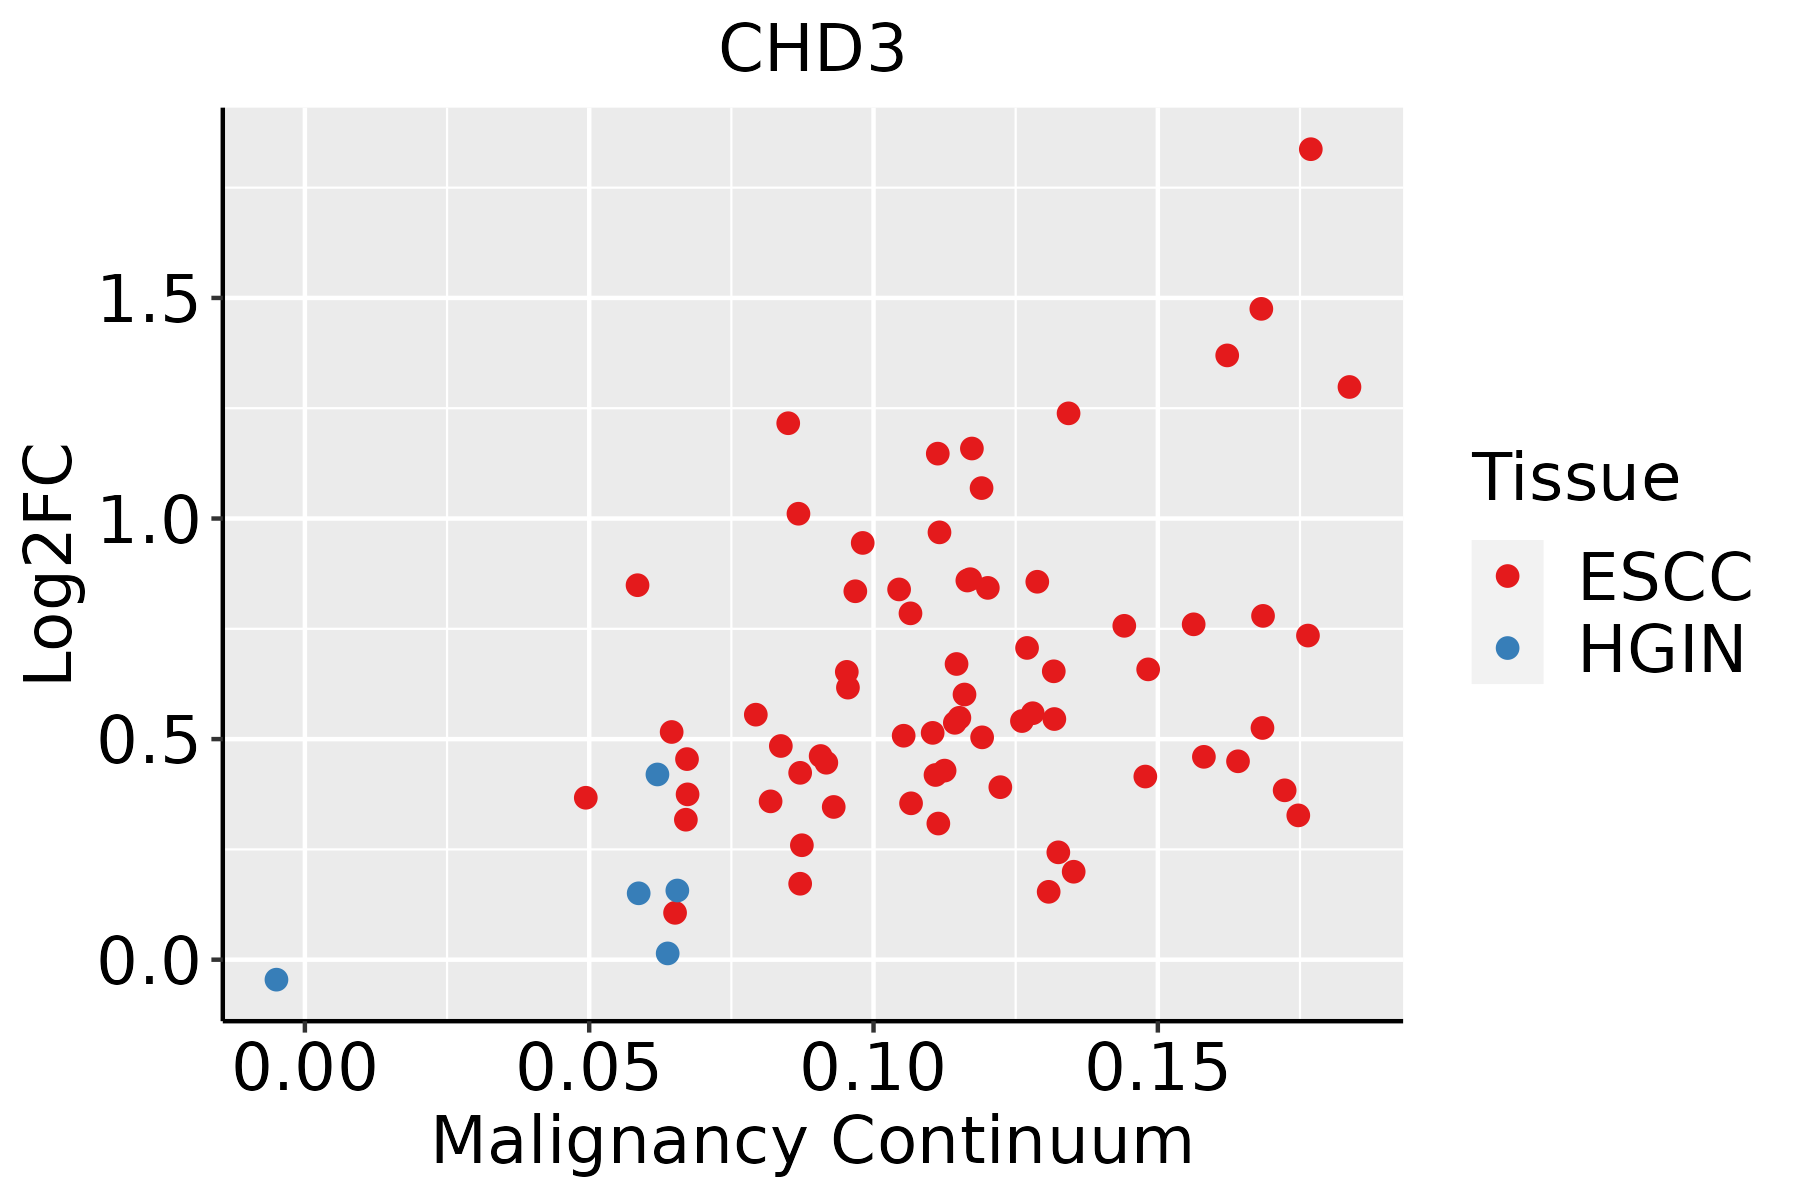 | ESCC: Esophageal squamous cell carcinoma |
| HGIN: High-grade intraepithelial neoplasias | ||
| LGIN: Low-grade intraepithelial neoplasias | ||
| Oral Cavity | 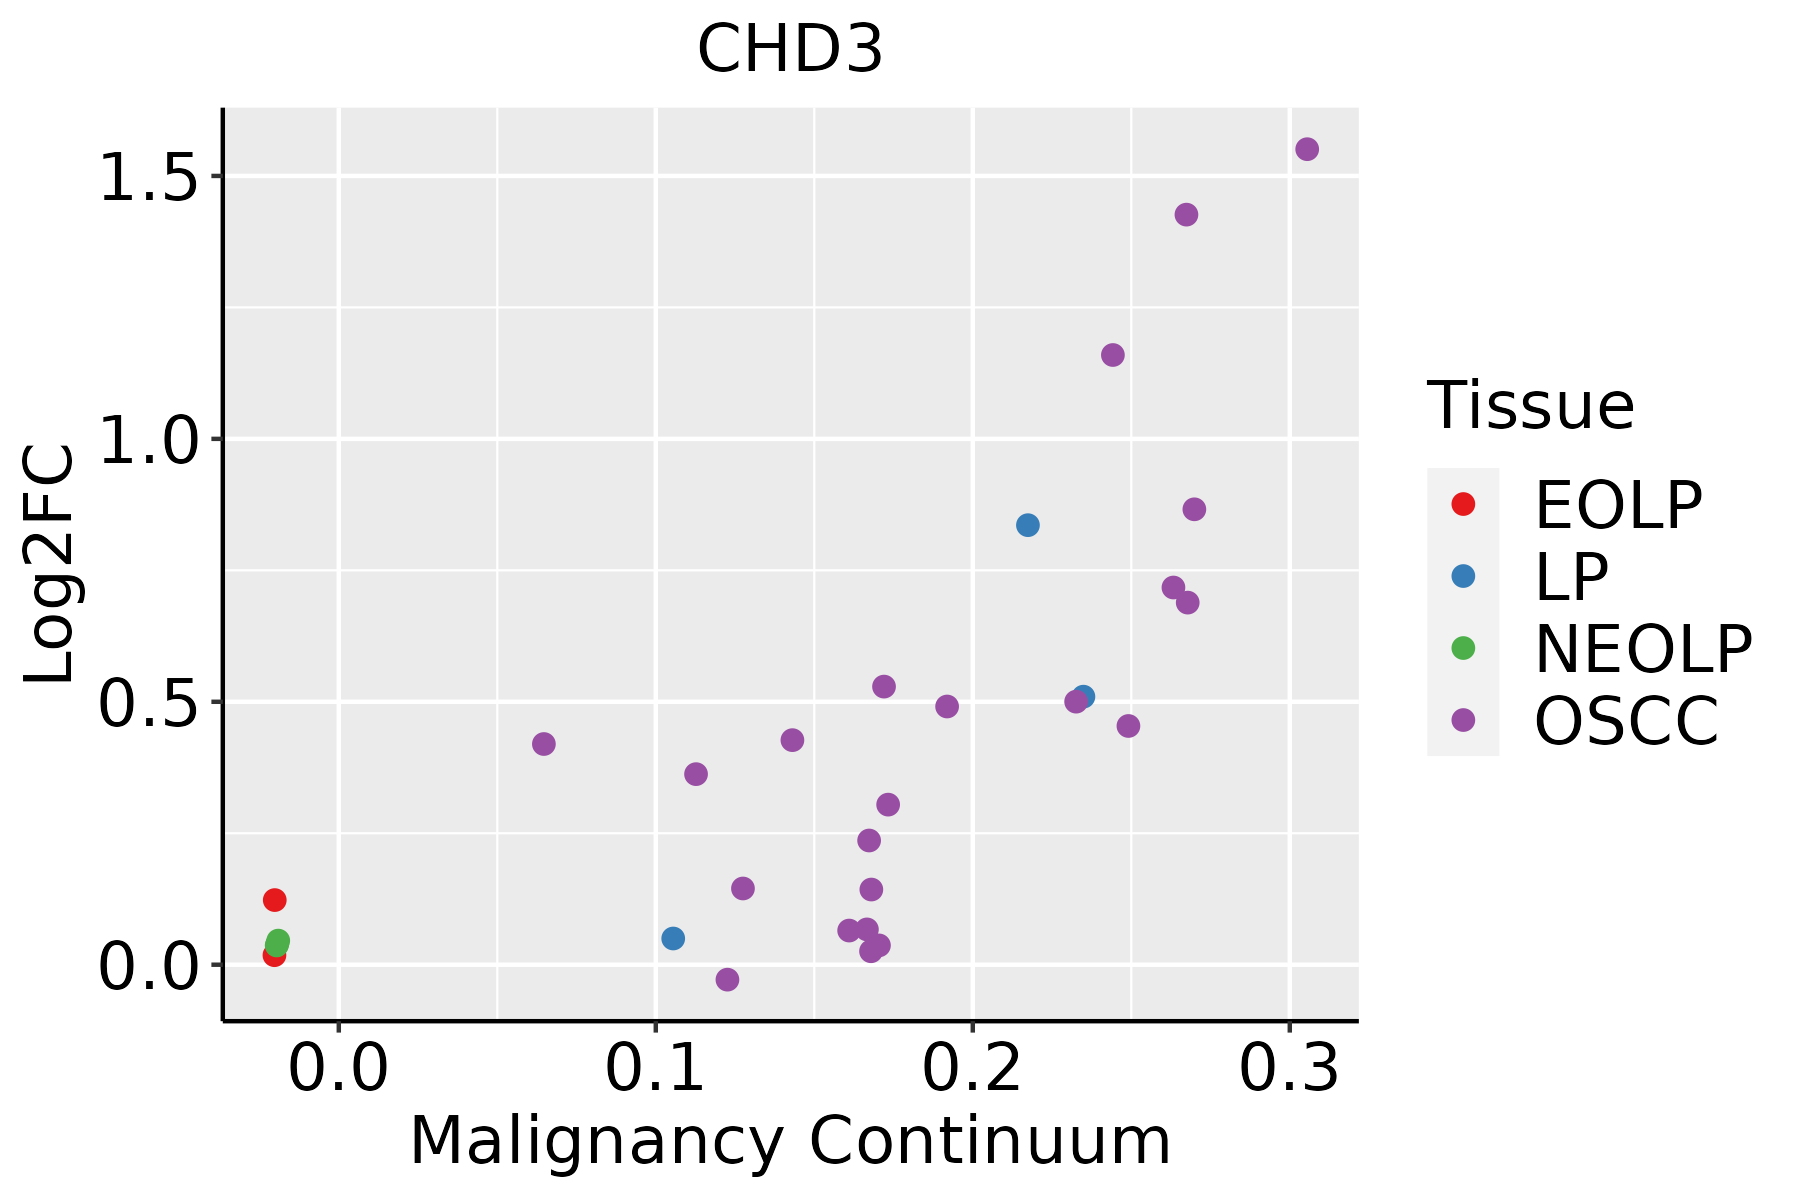 | EOLP: Erosive Oral lichen planus |
| LP: leukoplakia | ||
| NEOLP: Non-erosive oral lichen planus | ||
| OSCC: Oral squamous cell carcinoma | ||
| Prostate |  | BPH: Benign Prostatic Hyperplasia |
| Skin | 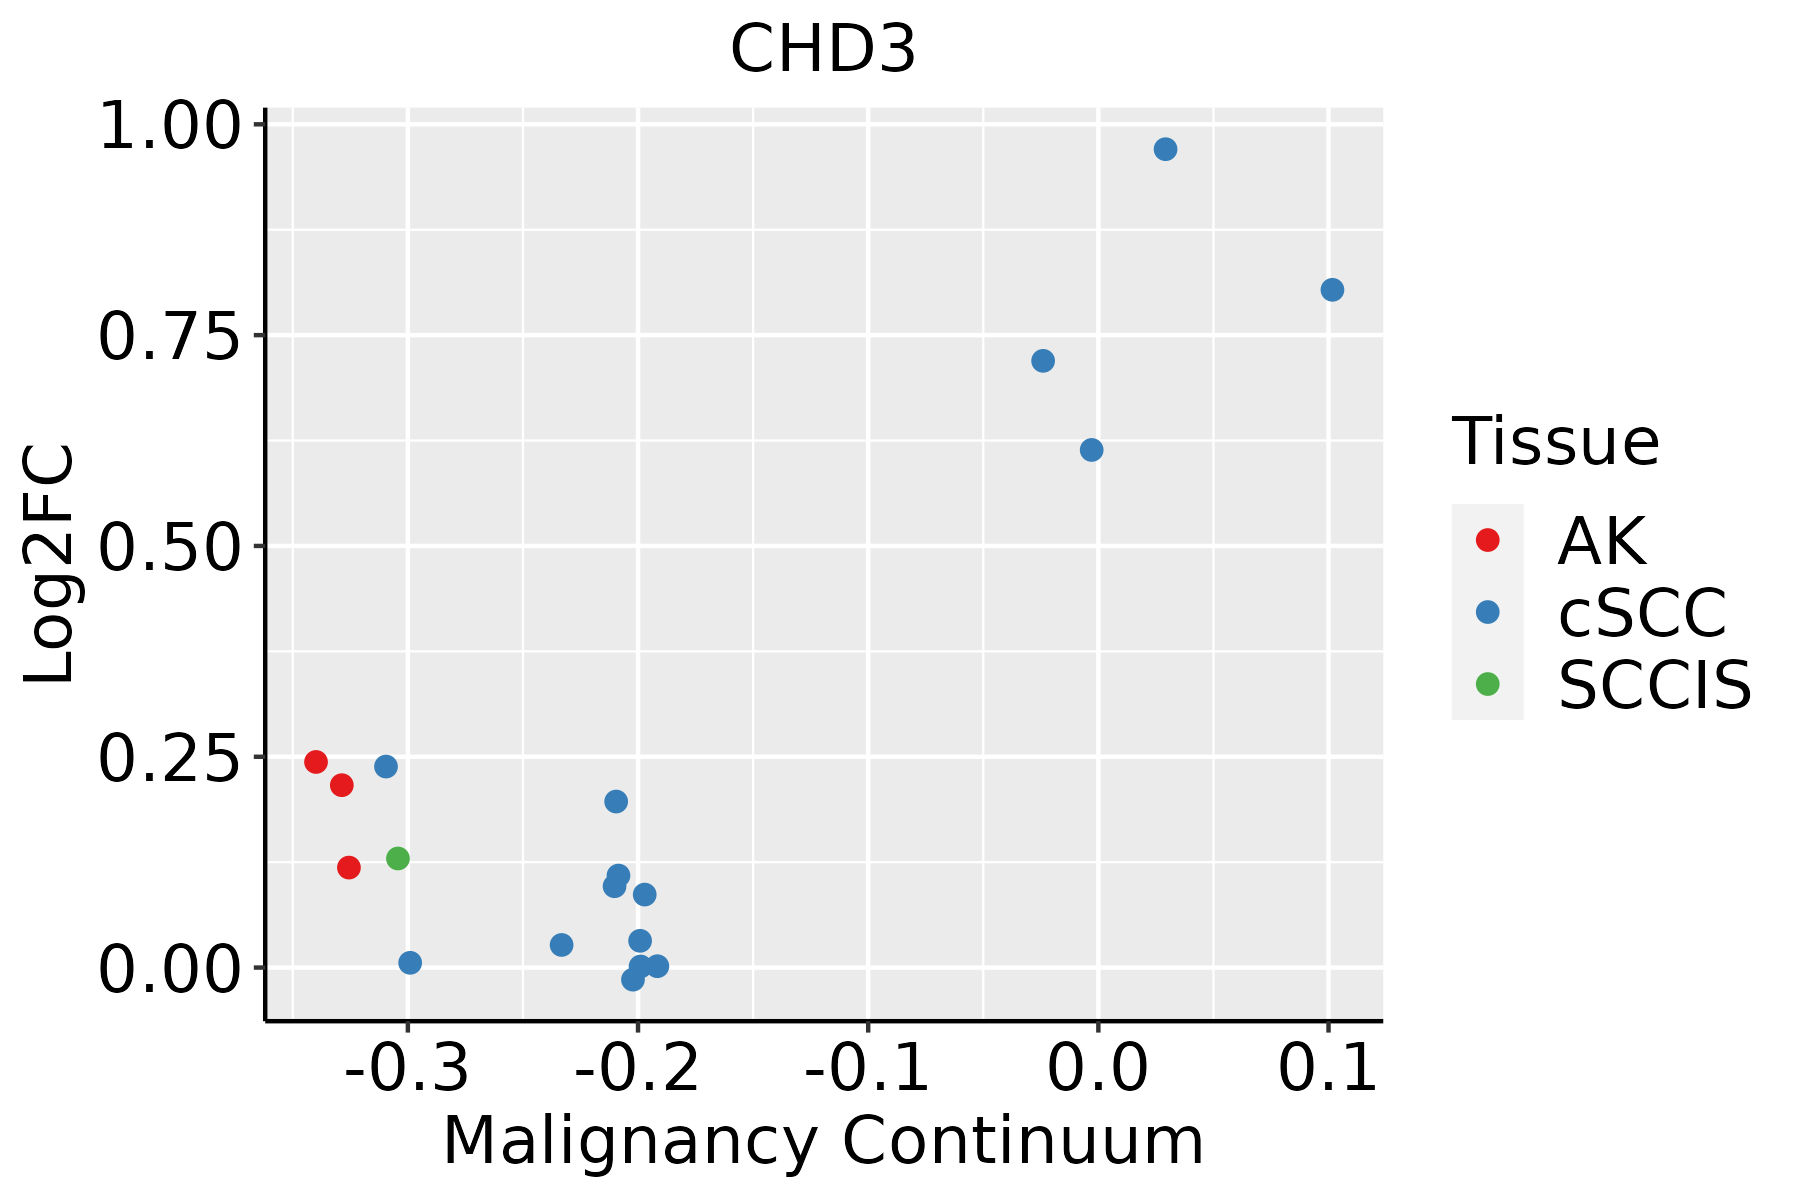 | AK: Actinic keratosis |
| cSCC: Cutaneous squamous cell carcinoma | ||
| SCCIS:squamous cell carcinoma in situ | ||
| Thyroid |  | ATC: Anaplastic thyroid cancer |
| HT: Hashimoto's thyroiditis | ||
| PTC: Papillary thyroid cancer |
| ∗log2FC in expression of this searched gene in stem-like cells from each diseased tissue sample relative to stem-like cells in normal samples in each tissue plotted against the malignancy continuum. Samples are colored based on if they are from different disease stage. |
Top |
Malignant transformation related pathway analysis |
| Find out the enriched GO biological processes and KEGG pathways involved in transition from healthy to precancer to cancer |
| Tissue | Disease Stage | Enriched GO biological Processes |
| Colorectum | AD |  |
| Colorectum | SER |  |
| Colorectum | MSS |  |
| Colorectum | MSI-H |  |
| Colorectum | FAP |  |
| ∗Top 15 enriched GO BP terms are showed in the bar plot of each disease state in each tissue. Each row represents a significant GO biological process which is colored according to the -log10(p.adjust). |
| Page: 1 2 3 4 5 6 7 8 9 |
| GO ID | Tissue | Disease Stage | Description | Gene Ratio | Bg Ratio | pvalue | p.adjust | Count |
| GO:003250812 | Oral cavity | EOLP | DNA duplex unwinding | 19/2218 | 84/18723 | 3.84e-03 | 2.13e-02 | 19 |
| GO:00063259 | Prostate | BPH | chromatin organization | 101/3107 | 409/18723 | 1.52e-05 | 1.94e-04 | 101 |
| GO:00070516 | Prostate | BPH | spindle organization | 48/3107 | 184/18723 | 6.91e-04 | 4.60e-03 | 48 |
| GO:00063382 | Prostate | BPH | chromatin remodeling | 62/3107 | 255/18723 | 9.47e-04 | 5.97e-03 | 62 |
| GO:00323924 | Prostate | BPH | DNA geometric change | 26/3107 | 90/18723 | 2.46e-03 | 1.33e-02 | 26 |
| GO:00325082 | Prostate | BPH | DNA duplex unwinding | 24/3107 | 84/18723 | 4.13e-03 | 2.04e-02 | 24 |
| GO:00310231 | Prostate | BPH | microtubule organizing center organization | 35/3107 | 143/18723 | 9.88e-03 | 4.16e-02 | 35 |
| GO:000632514 | Prostate | Tumor | chromatin organization | 104/3246 | 409/18723 | 2.02e-05 | 2.62e-04 | 104 |
| GO:000633811 | Prostate | Tumor | chromatin remodeling | 63/3246 | 255/18723 | 1.73e-03 | 1.02e-02 | 63 |
| GO:000705112 | Prostate | Tumor | spindle organization | 48/3246 | 184/18723 | 1.80e-03 | 1.06e-02 | 48 |
| GO:003239212 | Prostate | Tumor | DNA geometric change | 27/3246 | 90/18723 | 2.15e-03 | 1.22e-02 | 27 |
| GO:003250811 | Prostate | Tumor | DNA duplex unwinding | 25/3246 | 84/18723 | 3.47e-03 | 1.79e-02 | 25 |
| GO:000632518 | Skin | AK | chromatin organization | 73/1910 | 409/18723 | 1.40e-06 | 4.26e-05 | 73 |
| GO:00063384 | Skin | AK | chromatin remodeling | 51/1910 | 255/18723 | 1.95e-06 | 5.73e-05 | 51 |
| GO:00323927 | Skin | AK | DNA geometric change | 23/1910 | 90/18723 | 2.53e-05 | 4.54e-04 | 23 |
| GO:00070519 | Skin | AK | spindle organization | 37/1910 | 184/18723 | 4.21e-05 | 6.70e-04 | 37 |
| GO:00325085 | Skin | AK | DNA duplex unwinding | 21/1910 | 84/18723 | 7.93e-05 | 1.09e-03 | 21 |
| GO:000700620 | Skin | AK | mitochondrial membrane organization | 25/1910 | 116/18723 | 2.31e-04 | 2.56e-03 | 25 |
| GO:0071103 | Skin | AK | DNA conformation change | 47/1910 | 290/18723 | 9.43e-04 | 7.61e-03 | 47 |
| GO:000705115 | Skin | cSCC | spindle organization | 96/4864 | 184/18723 | 2.59e-14 | 1.77e-12 | 96 |
| Page: 1 2 3 4 5 6 |
| Pathway ID | Tissue | Disease Stage | Description | Gene Ratio | Bg Ratio | pvalue | p.adjust | qvalue | Count |
| Page: 1 |
Top |
Cell-cell communication analysis |
| Identification of potential cell-cell interactions between two cell types and their ligand-receptor pairs for different disease states |
| Ligand | Receptor | LRpair | Pathway | Tissue | Disease Stage |
| Page: 1 |
Top |
Single-cell gene regulatory network inference analysis |
| Find out the significant the regulons (TFs) and the target genes of each regulon across cell types for different disease states |
| TF | Cell Type | Tissue | Disease Stage | Target Gene | RSS | Regulon Activity |
| ∗The dot plots of a searched regulon are shown for all cell subpopulations in each disease state of each tissue based on the regulon specific score inferred using pySCENIC and by calculating the average expression. |
| Page: 1 |
Top |
Somatic mutation of malignant transformation related genes |
| Annotation of somatic variants for genes involved in malignant transformation |
| Hugo Symbol | Variant Class | Variant Classification | dbSNP RS | HGVSc | HGVSp | HGVSp Short | SWISSPROT | BIOTYPE | SIFT | PolyPhen | Tumor Sample Barcode | Tissue | Histology | Sex | Age | Stage | Therapy Types | Drugs | Outcome |
| CHD3 | SNV | Missense_Mutation | c.2045N>A | p.Arg682His | p.R682H | Q12873 | protein_coding | deleterious(0) | possibly_damaging(0.791) | TCGA-A2-A0YM-01 | Breast | breast invasive carcinoma | Female | >=65 | I/II | Unknown | Unknown | SD | |
| CHD3 | SNV | Missense_Mutation | rs374465330 | c.5986N>A | p.Ala1996Thr | p.A1996T | Q12873 | protein_coding | tolerated_low_confidence(0.09) | benign(0) | TCGA-A8-A06R-01 | Breast | breast invasive carcinoma | Female | >=65 | I/II | Chemotherapy | 5-fluorouracil | CR |
| CHD3 | SNV | Missense_Mutation | c.1012G>C | p.Asp338His | p.D338H | Q12873 | protein_coding | deleterious_low_confidence(0.01) | benign(0.443) | TCGA-A8-A0AB-01 | Breast | breast invasive carcinoma | Female | <65 | I/II | Chemotherapy | 5-fluorouracil | CR | |
| CHD3 | SNV | Missense_Mutation | c.2299N>A | p.Asp767Asn | p.D767N | Q12873 | protein_coding | tolerated(0.06) | benign(0.111) | TCGA-AC-A23H-01 | Breast | breast invasive carcinoma | Female | >=65 | I/II | Unknown | Unknown | PD | |
| CHD3 | SNV | Missense_Mutation | c.2461N>A | p.Glu821Lys | p.E821K | Q12873 | protein_coding | deleterious(0) | probably_damaging(0.995) | TCGA-AC-A3W6-01 | Breast | breast invasive carcinoma | Female | >=65 | III/IV | Unknown | Unknown | SD | |
| CHD3 | SNV | Missense_Mutation | novel | c.1929N>T | p.Lys643Asn | p.K643N | Q12873 | protein_coding | deleterious(0) | probably_damaging(0.991) | TCGA-AN-A046-01 | Breast | breast invasive carcinoma | Female | >=65 | I/II | Unknown | Unknown | SD |
| CHD3 | SNV | Missense_Mutation | novel | c.90N>C | p.Glu30Asp | p.E30D | Q12873 | protein_coding | deleterious_low_confidence(0) | possibly_damaging(0.483) | TCGA-AO-A128-01 | Breast | breast invasive carcinoma | Female | <65 | I/II | Chemotherapy | doxorubicin | SD |
| CHD3 | SNV | Missense_Mutation | rs765531902 | c.809N>T | p.Ala270Val | p.A270V | Q12873 | protein_coding | deleterious_low_confidence(0.03) | probably_damaging(0.986) | TCGA-AR-A1AI-01 | Breast | breast invasive carcinoma | Female | <65 | I/II | Chemotherapy | cytoxan | PD |
| CHD3 | SNV | Missense_Mutation | novel | c.3739G>A | p.Ala1247Thr | p.A1247T | Q12873 | protein_coding | deleterious(0.02) | probably_damaging(0.99) | TCGA-B6-A0RE-01 | Breast | breast invasive carcinoma | Female | <65 | I/II | Unknown | Unknown | SD |
| CHD3 | SNV | Missense_Mutation | rs551155540 | c.1396N>C | p.Asp466His | p.D466H | Q12873 | protein_coding | deleterious(0) | possibly_damaging(0.905) | TCGA-BH-A1FC-01 | Breast | breast invasive carcinoma | Female | >=65 | I/II | Unknown | Unknown | SD |
| Page: 1 2 3 4 5 6 7 8 9 10 11 12 13 14 15 16 17 18 19 20 21 |
Top |
Related drugs of malignant transformation related genes |
| Identification of chemicals and drugs interact with genes involved in malignant transfromation |
| (DGIdb 4.0) |
| Entrez ID | Symbol | Category | Interaction Types | Drug Claim Name | Drug Name | PMIDs |
| Page: 1 |

Copyright 2023-Present -The University of Texas Health Science Center at Houston |