
|
|||||
|
 | |
| |
| |
| |
| |
| |
|
Gene: CETN2 |
Gene summary for CETN2 |
| Gene information | Species | Human | Gene symbol | CETN2 | Gene ID | 1069 |
| Gene name | centrin 2 | |
| Gene Alias | CALT | |
| Cytomap | Xq28 | |
| Gene Type | protein-coding | GO ID | GO:0000003 | UniProtAcc | P41208 |
Top |
Malignant transformation analysis |
| Identification of the aberrant gene expression in precancerous and cancerous lesions by comparing the gene expression of stem-like cells in diseased tissues with normal stem cells |
| Entrez ID | Symbol | Replicates | Species | Organ | Tissue | Adj P-value | Log2FC | Malignancy |
| 1069 | CETN2 | GSM4909282 | Human | Breast | IDC | 3.24e-17 | 5.42e-01 | -0.0288 |
| 1069 | CETN2 | GSM4909286 | Human | Breast | IDC | 7.33e-03 | 2.00e-01 | 0.1081 |
| 1069 | CETN2 | GSM4909287 | Human | Breast | IDC | 1.09e-04 | 3.75e-01 | 0.2057 |
| 1069 | CETN2 | GSM4909290 | Human | Breast | IDC | 5.22e-11 | 5.32e-01 | 0.2096 |
| 1069 | CETN2 | GSM4909293 | Human | Breast | IDC | 2.09e-07 | 3.14e-01 | 0.1581 |
| 1069 | CETN2 | GSM4909294 | Human | Breast | IDC | 2.74e-03 | 3.20e-01 | 0.2022 |
| 1069 | CETN2 | GSM4909296 | Human | Breast | IDC | 4.44e-02 | 9.04e-02 | 0.1524 |
| 1069 | CETN2 | GSM4909297 | Human | Breast | IDC | 7.64e-03 | 9.19e-02 | 0.1517 |
| 1069 | CETN2 | GSM4909298 | Human | Breast | IDC | 8.97e-03 | 2.24e-01 | 0.1551 |
| 1069 | CETN2 | GSM4909301 | Human | Breast | IDC | 1.73e-10 | 4.47e-01 | 0.1577 |
| 1069 | CETN2 | GSM4909302 | Human | Breast | IDC | 1.00e-02 | 3.28e-01 | 0.1545 |
| 1069 | CETN2 | GSM4909304 | Human | Breast | IDC | 3.90e-12 | 4.47e-01 | 0.1636 |
| 1069 | CETN2 | GSM4909306 | Human | Breast | IDC | 1.55e-21 | 5.89e-01 | 0.1564 |
| 1069 | CETN2 | GSM4909311 | Human | Breast | IDC | 1.44e-11 | -4.33e-02 | 0.1534 |
| 1069 | CETN2 | GSM4909316 | Human | Breast | IDC | 2.22e-02 | 1.71e-01 | 0.21 |
| 1069 | CETN2 | GSM4909319 | Human | Breast | IDC | 2.21e-22 | 1.97e-01 | 0.1563 |
| 1069 | CETN2 | GSM4909320 | Human | Breast | IDC | 9.20e-06 | 2.67e-01 | 0.1575 |
| 1069 | CETN2 | GSM4909321 | Human | Breast | IDC | 2.88e-03 | 4.64e-02 | 0.1559 |
| 1069 | CETN2 | brca2 | Human | Breast | Precancer | 1.60e-13 | 3.70e-01 | -0.024 |
| 1069 | CETN2 | NCCBC14 | Human | Breast | DCIS | 8.75e-04 | 2.35e-01 | 0.2021 |
| Page: 1 2 3 4 5 6 7 8 9 |
| Tissue | Expression Dynamics | Abbreviation |
| Breast | 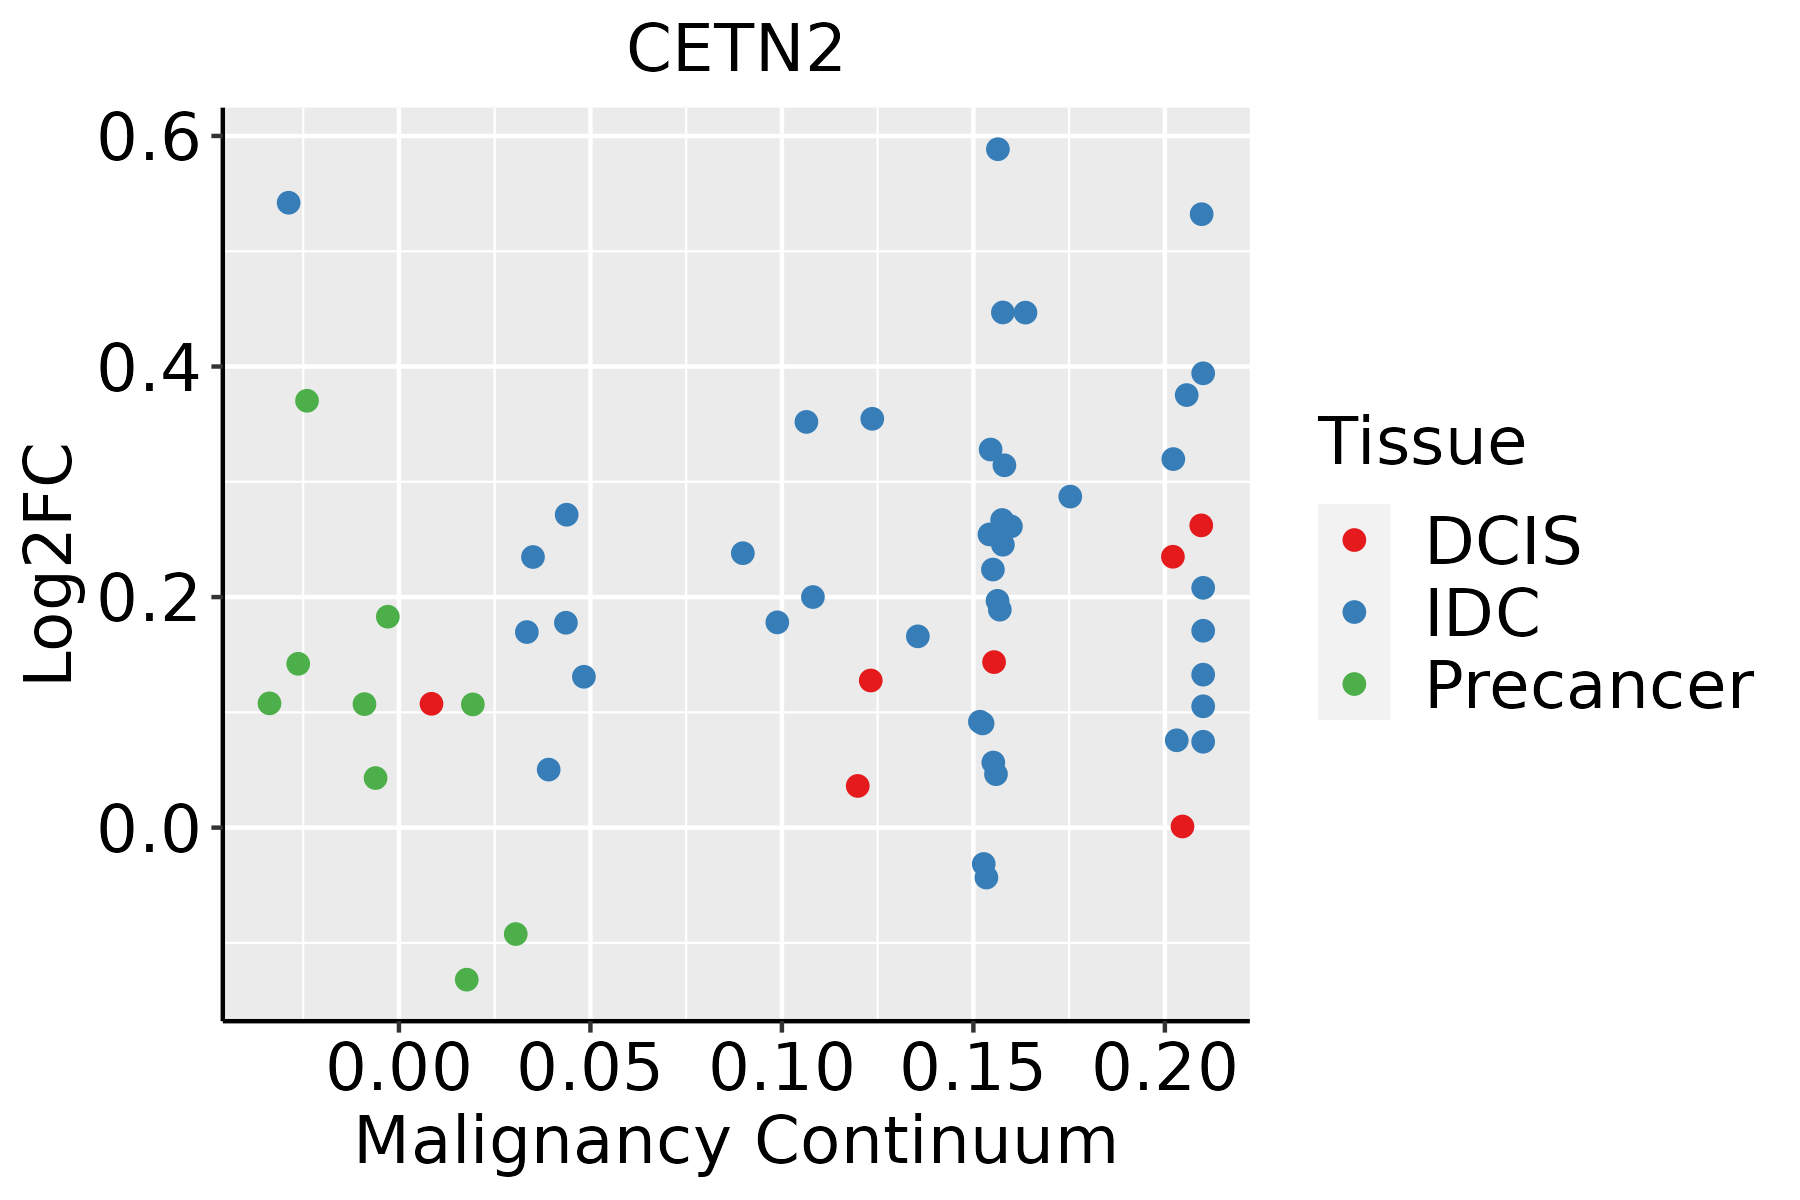 | IDC: Invasive ductal carcinoma |
| DCIS: Ductal carcinoma in situ | ||
| Precancer(BRCA1-mut): Precancerous lesion from BRCA1 mutation carriers | ||
| Endometrium |  | AEH: Atypical endometrial hyperplasia |
| EEC: Endometrioid Cancer | ||
| Esophagus | 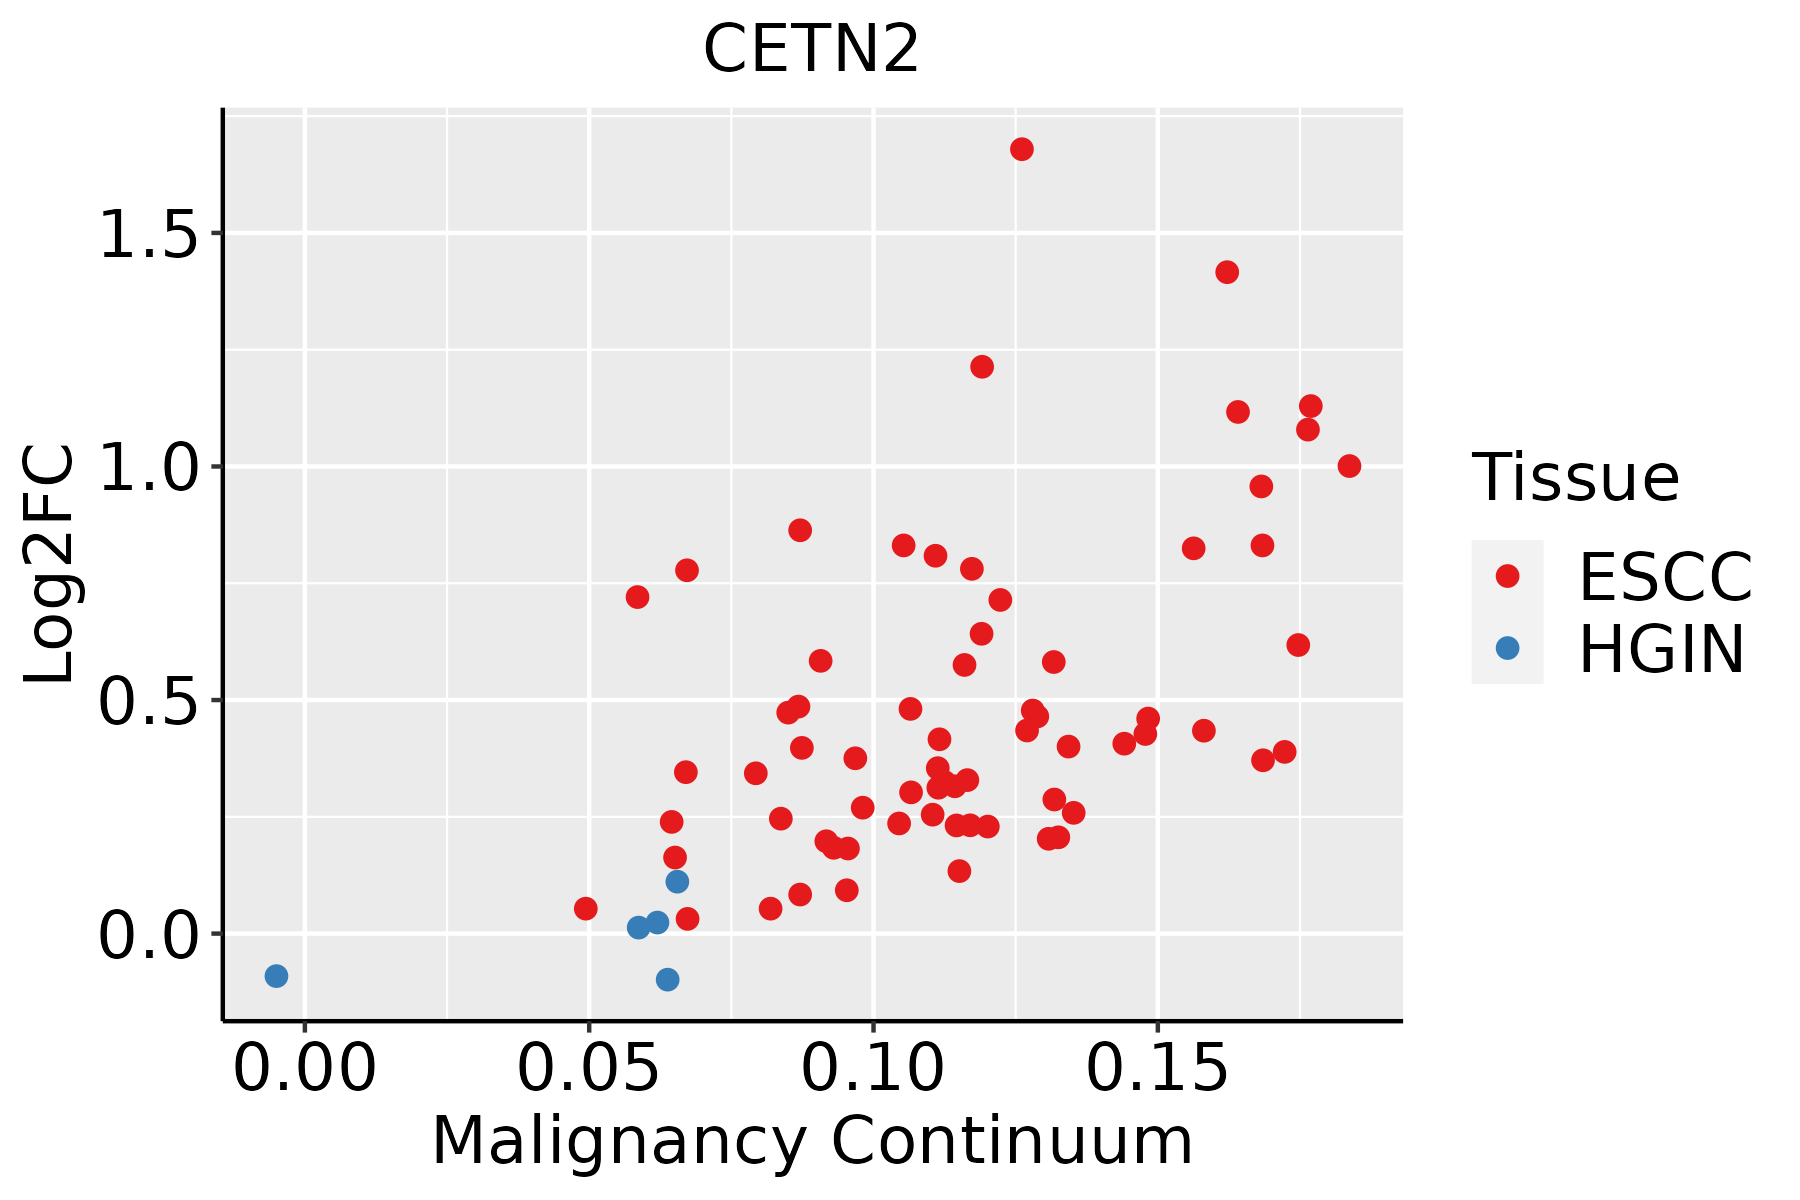 | ESCC: Esophageal squamous cell carcinoma |
| HGIN: High-grade intraepithelial neoplasias | ||
| LGIN: Low-grade intraepithelial neoplasias | ||
| Liver |  | HCC: Hepatocellular carcinoma |
| NAFLD: Non-alcoholic fatty liver disease | ||
| Oral Cavity |  | EOLP: Erosive Oral lichen planus |
| LP: leukoplakia | ||
| NEOLP: Non-erosive oral lichen planus | ||
| OSCC: Oral squamous cell carcinoma | ||
| Skin | 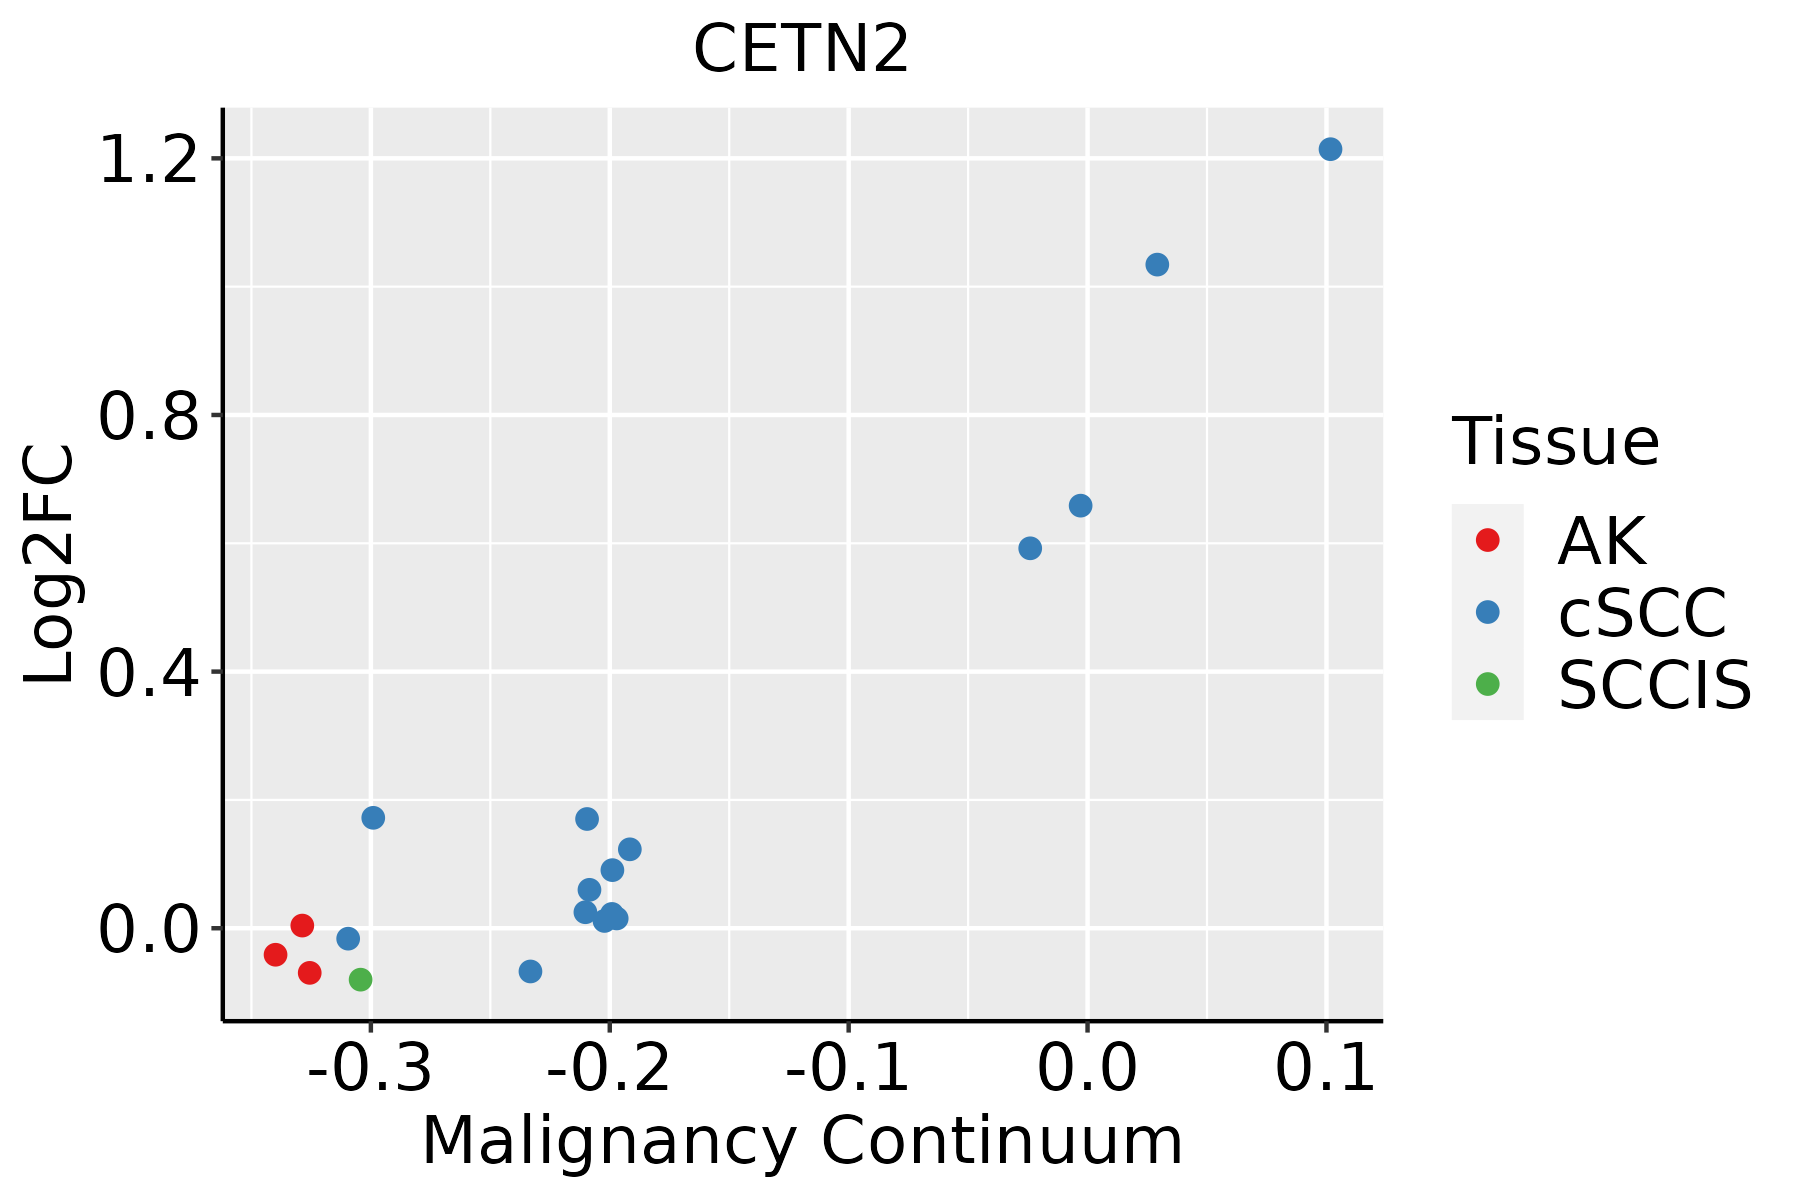 | AK: Actinic keratosis |
| cSCC: Cutaneous squamous cell carcinoma | ||
| SCCIS:squamous cell carcinoma in situ | ||
| Thyroid |  | ATC: Anaplastic thyroid cancer |
| HT: Hashimoto's thyroiditis | ||
| PTC: Papillary thyroid cancer |
| ∗log2FC in expression of this searched gene in stem-like cells from each diseased tissue sample relative to stem-like cells in normal samples in each tissue plotted against the malignancy continuum. Samples are colored based on if they are from different disease stage. |
Top |
Malignant transformation related pathway analysis |
| Find out the enriched GO biological processes and KEGG pathways involved in transition from healthy to precancer to cancer |
| Tissue | Disease Stage | Enriched GO biological Processes |
| Colorectum | AD |  |
| Colorectum | SER |  |
| Colorectum | MSS |  |
| Colorectum | MSI-H |  |
| Colorectum | FAP |  |
| ∗Top 15 enriched GO BP terms are showed in the bar plot of each disease state in each tissue. Each row represents a significant GO biological process which is colored according to the -log10(p.adjust). |
| Page: 1 2 3 4 5 6 7 8 9 |
| GO ID | Tissue | Disease Stage | Description | Gene Ratio | Bg Ratio | pvalue | p.adjust | Count |
| GO:005065715 | Oral cavity | LP | nucleic acid transport | 78/4623 | 163/18723 | 1.11e-10 | 6.44e-09 | 78 |
| GO:005065815 | Oral cavity | LP | RNA transport | 78/4623 | 163/18723 | 1.11e-10 | 6.44e-09 | 78 |
| GO:005123615 | Oral cavity | LP | establishment of RNA localization | 79/4623 | 166/18723 | 1.18e-10 | 6.81e-09 | 79 |
| GO:001593115 | Oral cavity | LP | nucleobase-containing compound transport | 95/4623 | 222/18723 | 2.23e-09 | 9.98e-08 | 95 |
| GO:005102814 | Oral cavity | LP | mRNA transport | 62/4623 | 130/18723 | 1.03e-08 | 3.90e-07 | 62 |
| GO:0006403111 | Skin | cSCC | RNA localization | 120/4864 | 201/18723 | 4.17e-24 | 1.01e-21 | 120 |
| GO:005065719 | Skin | cSCC | nucleic acid transport | 92/4864 | 163/18723 | 1.35e-16 | 1.33e-14 | 92 |
| GO:005065819 | Skin | cSCC | RNA transport | 92/4864 | 163/18723 | 1.35e-16 | 1.33e-14 | 92 |
| GO:005123619 | Skin | cSCC | establishment of RNA localization | 93/4864 | 166/18723 | 1.78e-16 | 1.69e-14 | 93 |
| GO:005102816 | Skin | cSCC | mRNA transport | 77/4864 | 130/18723 | 1.06e-15 | 8.95e-14 | 77 |
| GO:001593119 | Skin | cSCC | nucleobase-containing compound transport | 105/4864 | 222/18723 | 5.49e-12 | 2.89e-10 | 105 |
| GO:000091021 | Skin | cSCC | cytokinesis | 84/4864 | 173/18723 | 1.36e-10 | 6.04e-09 | 84 |
| GO:00310234 | Skin | cSCC | microtubule organizing center organization | 58/4864 | 143/18723 | 9.47e-05 | 8.83e-04 | 58 |
| GO:00070983 | Skin | cSCC | centrosome cycle | 53/4864 | 130/18723 | 1.59e-04 | 1.39e-03 | 53 |
| GO:00062893 | Skin | cSCC | nucleotide-excision repair | 27/4864 | 60/18723 | 1.10e-03 | 7.24e-03 | 27 |
| GO:00324654 | Skin | cSCC | regulation of cytokinesis | 37/4864 | 92/18723 | 1.94e-03 | 1.17e-02 | 37 |
| GO:00513026 | Skin | cSCC | regulation of cell division | 61/4864 | 177/18723 | 7.34e-03 | 3.47e-02 | 61 |
| GO:000640325 | Thyroid | HT | RNA localization | 35/1272 | 201/18723 | 2.37e-07 | 1.19e-05 | 35 |
| GO:005065720 | Thyroid | HT | nucleic acid transport | 28/1272 | 163/18723 | 4.86e-06 | 1.53e-04 | 28 |
| GO:005065820 | Thyroid | HT | RNA transport | 28/1272 | 163/18723 | 4.86e-06 | 1.53e-04 | 28 |
| Page: 1 2 3 4 5 6 |
| Pathway ID | Tissue | Disease Stage | Description | Gene Ratio | Bg Ratio | pvalue | p.adjust | qvalue | Count |
| hsa03420 | Liver | Cirrhotic | Nucleotide excision repair | 29/2530 | 63/8465 | 4.81e-03 | 1.74e-02 | 1.07e-02 | 29 |
| hsa034201 | Liver | Cirrhotic | Nucleotide excision repair | 29/2530 | 63/8465 | 4.81e-03 | 1.74e-02 | 1.07e-02 | 29 |
| hsa034202 | Liver | HCC | Nucleotide excision repair | 41/4020 | 63/8465 | 3.59e-03 | 1.12e-02 | 6.22e-03 | 41 |
| hsa034203 | Liver | HCC | Nucleotide excision repair | 41/4020 | 63/8465 | 3.59e-03 | 1.12e-02 | 6.22e-03 | 41 |
| hsa034204 | Oral cavity | OSCC | Nucleotide excision repair | 49/3704 | 63/8465 | 3.48e-08 | 2.91e-07 | 1.48e-07 | 49 |
| hsa0342011 | Oral cavity | OSCC | Nucleotide excision repair | 49/3704 | 63/8465 | 3.48e-08 | 2.91e-07 | 1.48e-07 | 49 |
| Page: 1 |
Top |
Cell-cell communication analysis |
| Identification of potential cell-cell interactions between two cell types and their ligand-receptor pairs for different disease states |
| Ligand | Receptor | LRpair | Pathway | Tissue | Disease Stage |
| Page: 1 |
Top |
Single-cell gene regulatory network inference analysis |
| Find out the significant the regulons (TFs) and the target genes of each regulon across cell types for different disease states |
| TF | Cell Type | Tissue | Disease Stage | Target Gene | RSS | Regulon Activity |
| ∗The dot plots of a searched regulon are shown for all cell subpopulations in each disease state of each tissue based on the regulon specific score inferred using pySCENIC and by calculating the average expression. |
| Page: 1 |
Top |
Somatic mutation of malignant transformation related genes |
| Annotation of somatic variants for genes involved in malignant transformation |
| Hugo Symbol | Variant Class | Variant Classification | dbSNP RS | HGVSc | HGVSp | HGVSp Short | SWISSPROT | BIOTYPE | SIFT | PolyPhen | Tumor Sample Barcode | Tissue | Histology | Sex | Age | Stage | Therapy Types | Drugs | Outcome |
| CETN2 | SNV | Missense_Mutation | novel | c.360G>T | p.Lys120Asn | p.K120N | P41208 | protein_coding | deleterious(0.01) | possibly_damaging(0.65) | TCGA-AN-A046-01 | Breast | breast invasive carcinoma | Female | >=65 | I/II | Unknown | Unknown | SD |
| CETN2 | SNV | Missense_Mutation | c.319N>A | p.Leu107Met | p.L107M | P41208 | protein_coding | tolerated(0.22) | benign(0.127) | TCGA-2W-A8YY-01 | Cervix | cervical & endocervical cancer | Female | <65 | I/II | Chemotherapy | cisplatin | CR | |
| CETN2 | SNV | Missense_Mutation | c.359N>C | p.Lys120Thr | p.K120T | P41208 | protein_coding | tolerated(0.17) | benign(0.056) | TCGA-AP-A056-01 | Endometrium | uterine corpus endometrioid carcinoma | Female | <65 | I/II | Unknown | Unknown | SD | |
| CETN2 | SNV | Missense_Mutation | c.376N>A | p.Leu126Met | p.L126M | P41208 | protein_coding | deleterious(0.02) | probably_damaging(0.987) | TCGA-AP-A0LM-01 | Endometrium | uterine corpus endometrioid carcinoma | Female | <65 | III/IV | Chemotherapy | cisplatin | SD | |
| CETN2 | SNV | Missense_Mutation | c.195N>T | p.Lys65Asn | p.K65N | P41208 | protein_coding | deleterious(0.02) | benign(0.089) | TCGA-AX-A05Z-01 | Endometrium | uterine corpus endometrioid carcinoma | Female | <65 | III/IV | Chemotherapy | adriamycin | SD | |
| CETN2 | SNV | Missense_Mutation | c.53N>T | p.Arg18Ile | p.R18I | P41208 | protein_coding | deleterious(0.01) | benign(0.058) | TCGA-AX-A05Z-01 | Endometrium | uterine corpus endometrioid carcinoma | Female | <65 | III/IV | Chemotherapy | adriamycin | SD | |
| CETN2 | SNV | Missense_Mutation | rs782369762 | c.491G>A | p.Arg164His | p.R164H | P41208 | protein_coding | tolerated(0.06) | benign(0.044) | TCGA-AX-A2HD-01 | Endometrium | uterine corpus endometrioid carcinoma | Female | >=65 | III/IV | Unknown | Unknown | SD |
| CETN2 | SNV | Missense_Mutation | rs373398188 | c.490N>T | p.Arg164Cys | p.R164C | P41208 | protein_coding | deleterious(0.03) | probably_damaging(0.941) | TCGA-B5-A1MR-01 | Endometrium | uterine corpus endometrioid carcinoma | Female | >=65 | III/IV | Unknown | Unknown | SD |
| CETN2 | SNV | Missense_Mutation | c.115N>A | p.Leu39Ile | p.L39I | P41208 | protein_coding | deleterious(0.02) | possibly_damaging(0.831) | TCGA-BS-A0UF-01 | Endometrium | uterine corpus endometrioid carcinoma | Female | >=65 | I/II | Unknown | Unknown | SD | |
| CETN2 | SNV | Missense_Mutation | novel | c.392N>G | p.Lys131Arg | p.K131R | P41208 | protein_coding | tolerated(0.31) | benign(0.013) | TCGA-E6-A1LX-01 | Endometrium | uterine corpus endometrioid carcinoma | Female | <65 | I/II | Unknown | Unknown | SD |
| Page: 1 2 3 |
Top |
Related drugs of malignant transformation related genes |
| Identification of chemicals and drugs interact with genes involved in malignant transfromation |
| (DGIdb 4.0) |
| Entrez ID | Symbol | Category | Interaction Types | Drug Claim Name | Drug Name | PMIDs |
| Page: 1 |

Copyright 2023-Present -The University of Texas Health Science Center at Houston |