
|
|||||
|
 | |
| |
| |
| |
| |
| |
|
Gene: CDO1 |
Gene summary for CDO1 |
| Gene information | Species | Human | Gene symbol | CDO1 | Gene ID | 1036 |
| Gene name | cysteine dioxygenase type 1 | |
| Gene Alias | CDO-I | |
| Cytomap | 5q22.3 | |
| Gene Type | protein-coding | GO ID | GO:0000096 | UniProtAcc | Q16878 |
Top |
Malignant transformation analysis |
| Identification of the aberrant gene expression in precancerous and cancerous lesions by comparing the gene expression of stem-like cells in diseased tissues with normal stem cells |
| Entrez ID | Symbol | Replicates | Species | Organ | Tissue | Adj P-value | Log2FC | Malignancy |
| 1036 | CDO1 | NAFLD1 | Human | Liver | NAFLD | 5.55e-05 | 6.13e-01 | -0.04 |
| 1036 | CDO1 | S43 | Human | Liver | Cirrhotic | 2.61e-04 | 2.32e-02 | -0.0187 |
| 1036 | CDO1 | HCC1_Meng | Human | Liver | HCC | 1.59e-06 | -1.73e-01 | 0.0246 |
| 1036 | CDO1 | HCC2_Meng | Human | Liver | HCC | 1.08e-07 | -1.73e-01 | 0.0107 |
| 1036 | CDO1 | HCC1 | Human | Liver | HCC | 1.20e-25 | 4.56e+00 | 0.5336 |
| 1036 | CDO1 | HCC2 | Human | Liver | HCC | 5.89e-03 | 2.35e+00 | 0.5341 |
| 1036 | CDO1 | Pt14.b | Human | Liver | HCC | 7.72e-07 | 3.68e-01 | 0.018 |
| 1036 | CDO1 | S014 | Human | Liver | HCC | 1.53e-16 | 9.55e-01 | 0.2254 |
| 1036 | CDO1 | S015 | Human | Liver | HCC | 2.18e-20 | 1.19e+00 | 0.2375 |
| 1036 | CDO1 | S016 | Human | Liver | HCC | 2.05e-23 | 1.10e+00 | 0.2243 |
| Page: 1 |
| Tissue | Expression Dynamics | Abbreviation |
| Liver | 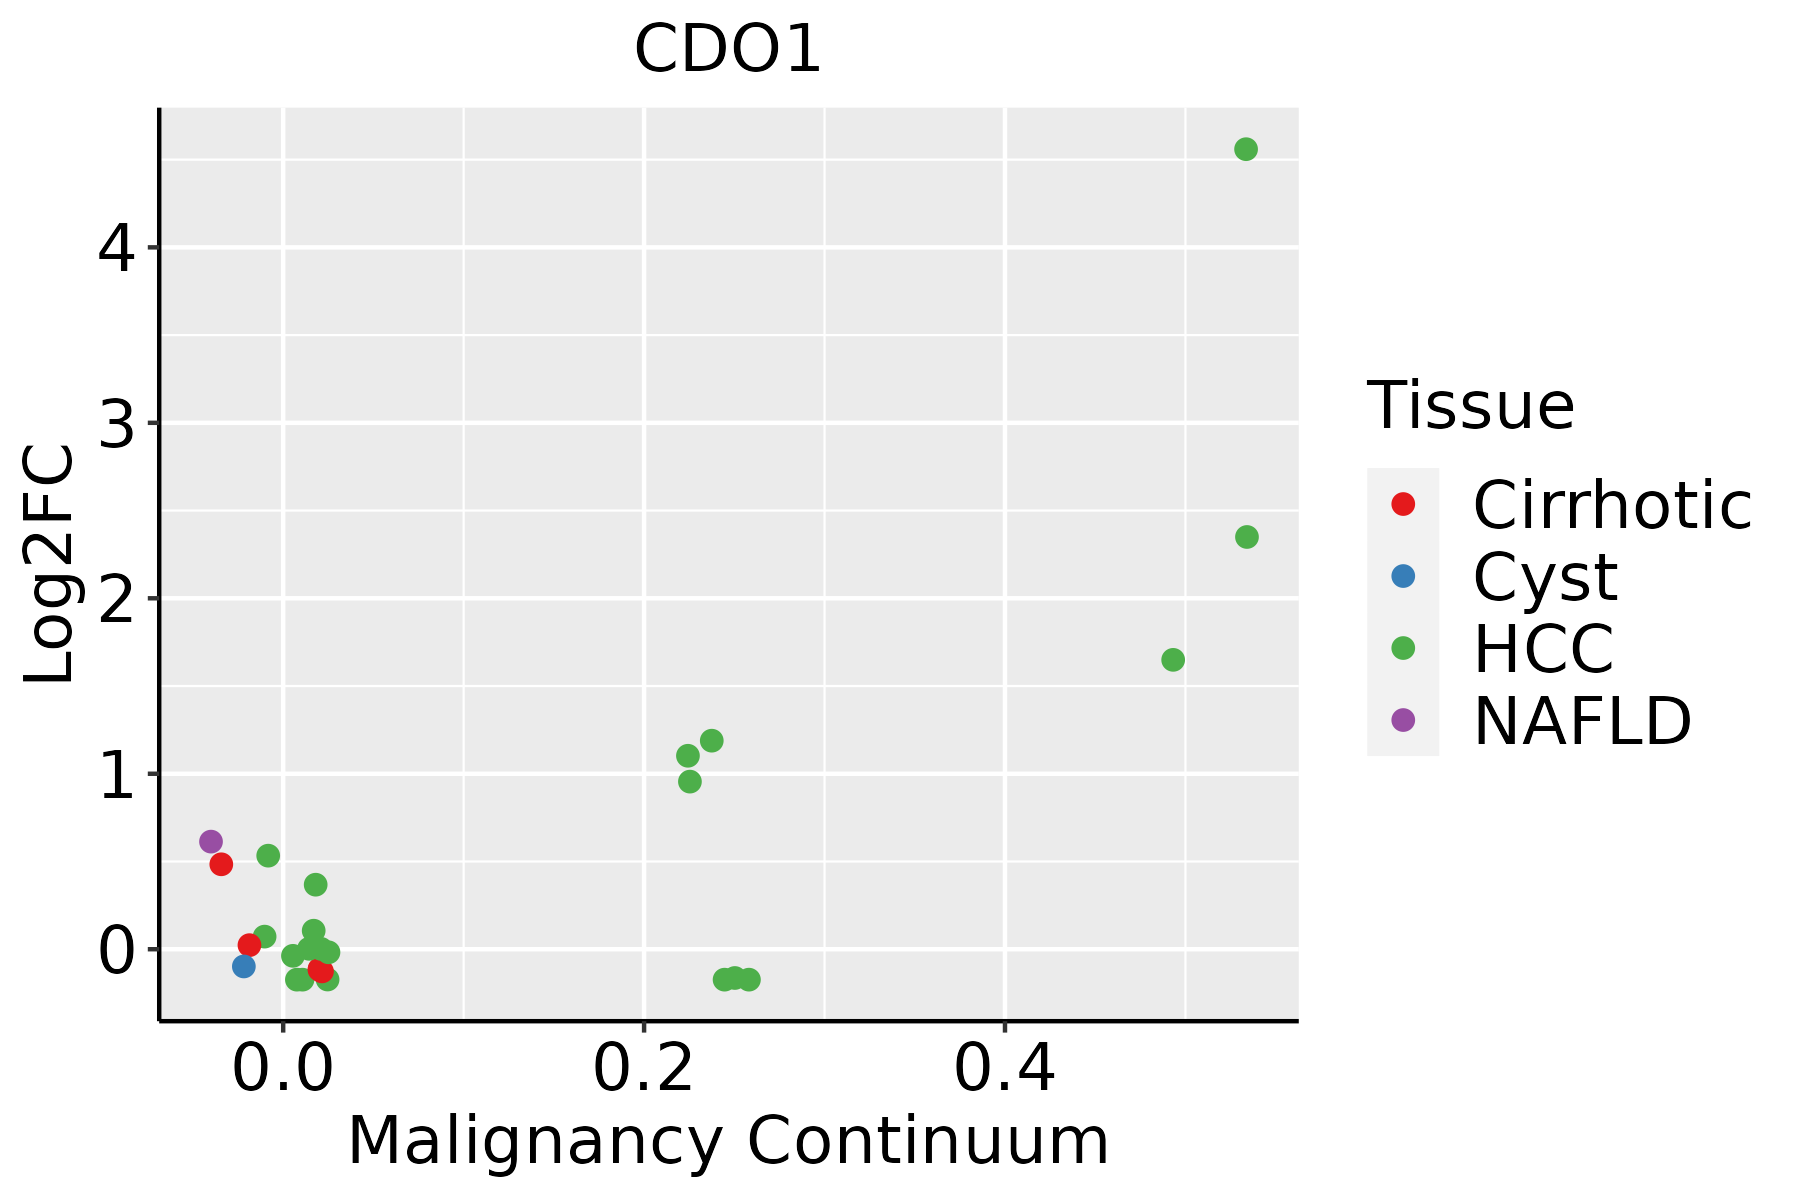 | HCC: Hepatocellular carcinoma |
| NAFLD: Non-alcoholic fatty liver disease |
| ∗log2FC in expression of this searched gene in stem-like cells from each diseased tissue sample relative to stem-like cells in normal samples in each tissue plotted against the malignancy continuum. Samples are colored based on if they are from different disease stage. |
Top |
Malignant transformation related pathway analysis |
| Find out the enriched GO biological processes and KEGG pathways involved in transition from healthy to precancer to cancer |
| Tissue | Disease Stage | Enriched GO biological Processes |
| Colorectum | AD |  |
| Colorectum | SER |  |
| Colorectum | MSS |  |
| Colorectum | MSI-H |  |
| Colorectum | FAP |  |
| ∗Top 15 enriched GO BP terms are showed in the bar plot of each disease state in each tissue. Each row represents a significant GO biological process which is colored according to the -log10(p.adjust). |
| Page: 1 2 3 4 5 6 7 8 9 |
| GO ID | Tissue | Disease Stage | Description | Gene Ratio | Bg Ratio | pvalue | p.adjust | Count |
| GO:00065202 | Liver | HCC | cellular amino acid metabolic process | 167/7958 | 284/18723 | 1.91e-08 | 4.56e-07 | 167 |
| GO:004873222 | Liver | HCC | gland development | 242/7958 | 436/18723 | 2.26e-08 | 5.28e-07 | 242 |
| GO:00442722 | Liver | HCC | sulfur compound biosynthetic process | 95/7958 | 148/18723 | 7.89e-08 | 1.58e-06 | 95 |
| GO:00000962 | Liver | HCC | sulfur amino acid metabolic process | 29/7958 | 34/18723 | 3.26e-07 | 5.62e-06 | 29 |
| GO:005138421 | Liver | HCC | response to glucocorticoid | 90/7958 | 148/18723 | 5.18e-06 | 6.47e-05 | 90 |
| GO:00090632 | Liver | HCC | cellular amino acid catabolic process | 70/7958 | 110/18723 | 6.12e-06 | 7.52e-05 | 70 |
| GO:003196021 | Liver | HCC | response to corticosteroid | 98/7958 | 167/18723 | 1.73e-05 | 1.87e-04 | 98 |
| GO:009730522 | Liver | HCC | response to alcohol | 138/7958 | 253/18723 | 6.91e-05 | 6.26e-04 | 138 |
| GO:00090692 | Liver | HCC | serine family amino acid metabolic process | 29/7958 | 40/18723 | 1.17e-04 | 9.87e-04 | 29 |
| GO:000110111 | Liver | HCC | response to acid chemical | 79/7958 | 135/18723 | 1.24e-04 | 1.03e-03 | 79 |
| GO:00000971 | Liver | HCC | sulfur amino acid biosynthetic process | 15/7958 | 17/18723 | 1.31e-04 | 1.07e-03 | 15 |
| GO:005159121 | Liver | HCC | response to cAMP | 57/7958 | 93/18723 | 1.96e-04 | 1.52e-03 | 57 |
| GO:001407421 | Liver | HCC | response to purine-containing compound | 84/7958 | 148/18723 | 3.19e-04 | 2.26e-03 | 84 |
| GO:004320011 | Liver | HCC | response to amino acid | 68/7958 | 116/18723 | 3.31e-04 | 2.33e-03 | 68 |
| GO:19016062 | Liver | HCC | alpha-amino acid catabolic process | 53/7958 | 87/18723 | 4.01e-04 | 2.71e-03 | 53 |
| GO:005087822 | Liver | HCC | regulation of body fluid levels | 191/7958 | 379/18723 | 1.06e-03 | 6.11e-03 | 191 |
| GO:004668321 | Liver | HCC | response to organophosphorus | 73/7958 | 131/18723 | 1.52e-03 | 8.05e-03 | 73 |
| GO:00308795 | Liver | HCC | mammary gland development | 75/7958 | 137/18723 | 2.52e-03 | 1.22e-02 | 75 |
| GO:00065341 | Liver | HCC | cysteine metabolic process | 10/7958 | 12/18723 | 4.79e-03 | 2.02e-02 | 10 |
| GO:00075951 | Liver | HCC | lactation | 29/7958 | 47/18723 | 6.16e-03 | 2.52e-02 | 29 |
| Page: 1 2 3 4 5 |
| Pathway ID | Tissue | Disease Stage | Description | Gene Ratio | Bg Ratio | pvalue | p.adjust | qvalue | Count |
| hsa00270 | Liver | Cirrhotic | Cysteine and methionine metabolism | 27/2530 | 52/8465 | 6.98e-04 | 4.15e-03 | 2.56e-03 | 27 |
| hsa002701 | Liver | Cirrhotic | Cysteine and methionine metabolism | 27/2530 | 52/8465 | 6.98e-04 | 4.15e-03 | 2.56e-03 | 27 |
| hsa002702 | Liver | HCC | Cysteine and methionine metabolism | 35/4020 | 52/8465 | 3.03e-03 | 9.94e-03 | 5.53e-03 | 35 |
| hsa002703 | Liver | HCC | Cysteine and methionine metabolism | 35/4020 | 52/8465 | 3.03e-03 | 9.94e-03 | 5.53e-03 | 35 |
| Page: 1 |
Top |
Cell-cell communication analysis |
| Identification of potential cell-cell interactions between two cell types and their ligand-receptor pairs for different disease states |
| Ligand | Receptor | LRpair | Pathway | Tissue | Disease Stage |
| Page: 1 |
Top |
Single-cell gene regulatory network inference analysis |
| Find out the significant the regulons (TFs) and the target genes of each regulon across cell types for different disease states |
| TF | Cell Type | Tissue | Disease Stage | Target Gene | RSS | Regulon Activity |
| ∗The dot plots of a searched regulon are shown for all cell subpopulations in each disease state of each tissue based on the regulon specific score inferred using pySCENIC and by calculating the average expression. |
| Page: 1 |
Top |
Somatic mutation of malignant transformation related genes |
| Annotation of somatic variants for genes involved in malignant transformation |
| Hugo Symbol | Variant Class | Variant Classification | dbSNP RS | HGVSc | HGVSp | HGVSp Short | SWISSPROT | BIOTYPE | SIFT | PolyPhen | Tumor Sample Barcode | Tissue | Histology | Sex | Age | Stage | Therapy Types | Drugs | Outcome |
| CDO1 | SNV | Missense_Mutation | c.346N>C | p.Glu116Gln | p.E116Q | Q16878 | protein_coding | tolerated(0.21) | benign(0.139) | TCGA-B6-A0IK-01 | Breast | breast invasive carcinoma | Female | <65 | III/IV | Unknown | Unknown | PD | |
| CDO1 | SNV | Missense_Mutation | c.288N>C | p.Lys96Asn | p.K96N | Q16878 | protein_coding | deleterious(0) | probably_damaging(1) | TCGA-D8-A1J8-01 | Breast | breast invasive carcinoma | Female | >=65 | I/II | Hormone Therapy | nolvadex | SD | |
| CDO1 | SNV | Missense_Mutation | novel | c.123G>C | p.Glu41Asp | p.E41D | Q16878 | protein_coding | tolerated(0.13) | benign(0) | TCGA-EW-A3E8-01 | Breast | breast invasive carcinoma | Female | <65 | I/II | Hormone Therapy | anastrozole | SD |
| CDO1 | SNV | Missense_Mutation | c.391N>T | p.Ala131Ser | p.A131S | Q16878 | protein_coding | tolerated(0.19) | possibly_damaging(0.72) | TCGA-EA-A78R-01 | Cervix | cervical & endocervical cancer | Female | <65 | I/II | Unknown | Unknown | SD | |
| CDO1 | SNV | Missense_Mutation | c.65N>C | p.Leu22Pro | p.L22P | Q16878 | protein_coding | deleterious(0.02) | possibly_damaging(0.672) | TCGA-AA-3844-01 | Colorectum | colon adenocarcinoma | Female | >=65 | III/IV | Chemotherapy | capecitabine | PD | |
| CDO1 | SNV | Missense_Mutation | rs776077445 | c.76G>A | p.Asp26Asn | p.D26N | Q16878 | protein_coding | tolerated(0.21) | benign(0.019) | TCGA-AM-5820-01 | Colorectum | colon adenocarcinoma | Female | <65 | I/II | Unknown | Unknown | SD |
| CDO1 | SNV | Missense_Mutation | rs776077445 | c.76N>A | p.Asp26Asn | p.D26N | Q16878 | protein_coding | tolerated(0.21) | benign(0.019) | TCGA-AZ-4315-01 | Colorectum | colon adenocarcinoma | Male | <65 | I/II | Unknown | Unknown | SD |
| CDO1 | SNV | Missense_Mutation | novel | c.32N>T | p.Thr11Ile | p.T11I | Q16878 | protein_coding | deleterious(0) | possibly_damaging(0.628) | TCGA-G4-6320-01 | Colorectum | colon adenocarcinoma | Male | >=65 | III/IV | Chemotherapy | oxaliplatin | SD |
| CDO1 | SNV | Missense_Mutation | novel | c.431N>G | p.Asn144Ser | p.N144S | Q16878 | protein_coding | deleterious(0) | probably_damaging(0.985) | TCGA-DC-6154-01 | Colorectum | rectum adenocarcinoma | Female | <65 | I/II | Chemotherapy | 5-fluorouracil | SD |
| CDO1 | SNV | Missense_Mutation | rs766064742 | c.581N>T | p.Ser194Leu | p.S194L | Q16878 | protein_coding | tolerated(0.23) | benign(0.003) | TCGA-F5-6814-01 | Colorectum | rectum adenocarcinoma | Male | <65 | I/II | Unknown | Unknown | SD |
| Page: 1 2 3 |
Top |
Related drugs of malignant transformation related genes |
| Identification of chemicals and drugs interact with genes involved in malignant transfromation |
| (DGIdb 4.0) |
| Entrez ID | Symbol | Category | Interaction Types | Drug Claim Name | Drug Name | PMIDs |
| Page: 1 |

Copyright 2023-Present -The University of Texas Health Science Center at Houston |