| Tissue | Expression Dynamics | Abbreviation |
| Colorectum (GSE201348) | 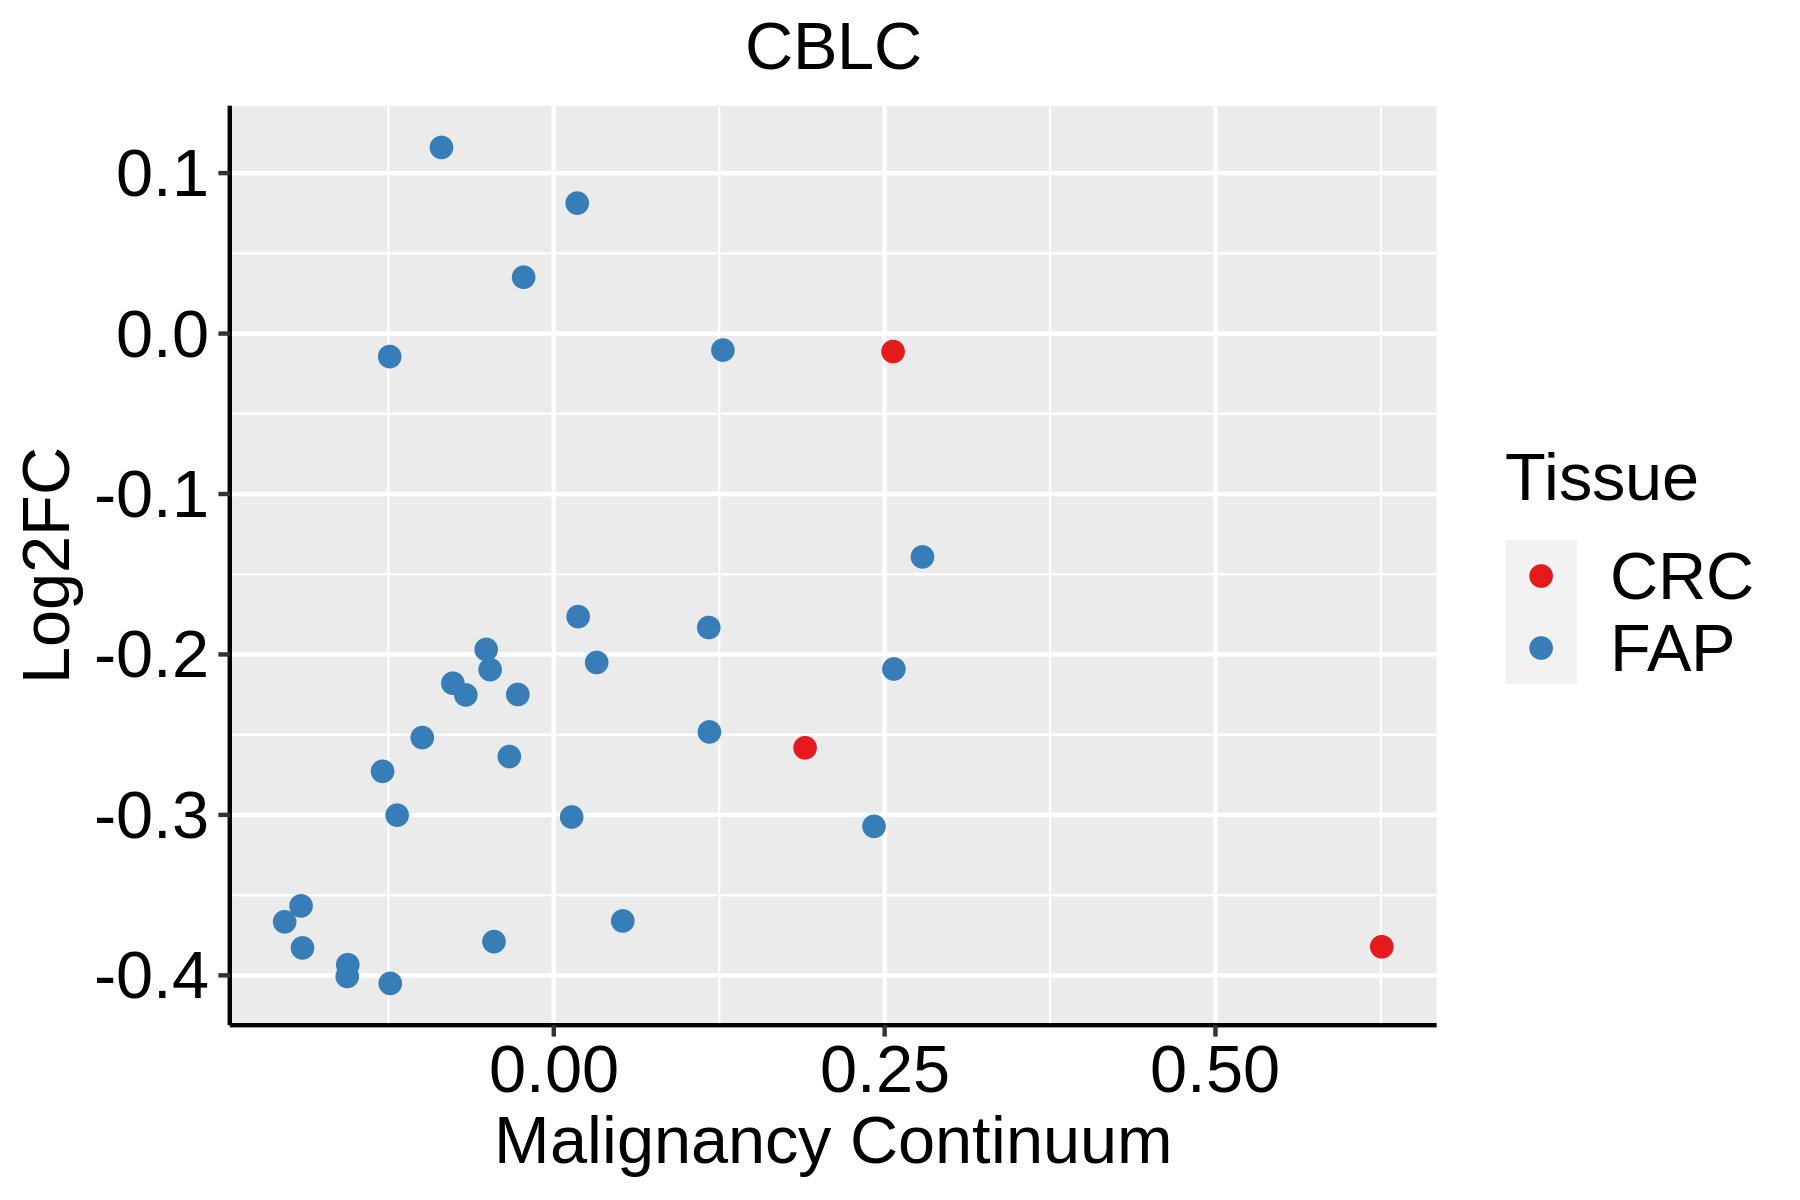 | FAP: Familial adenomatous polyposis |
| CRC: Colorectal cancer |
| Colorectum (HTA11) | 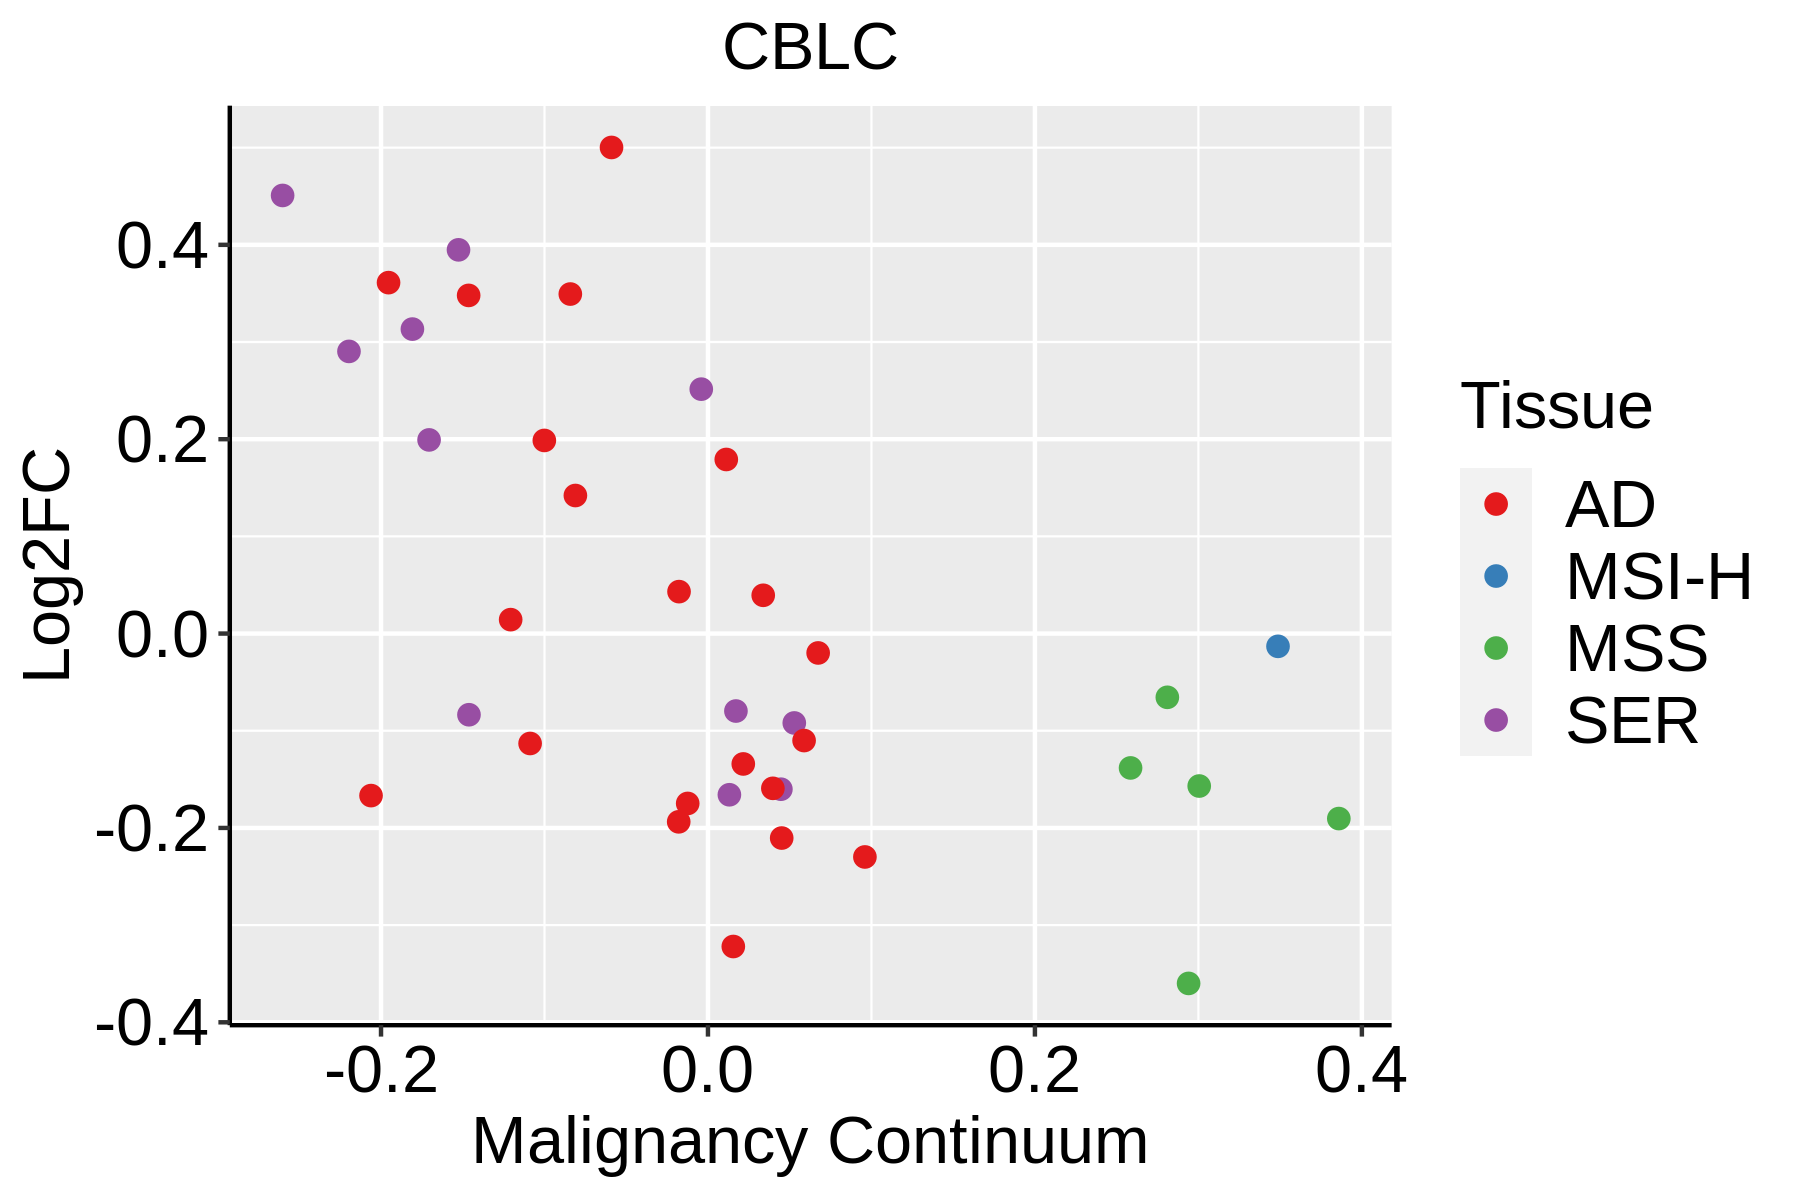 | AD: Adenomas |
| SER: Sessile serrated lesions |
| MSI-H: Microsatellite-high colorectal cancer |
| MSS: Microsatellite stable colorectal cancer |
| Esophagus | 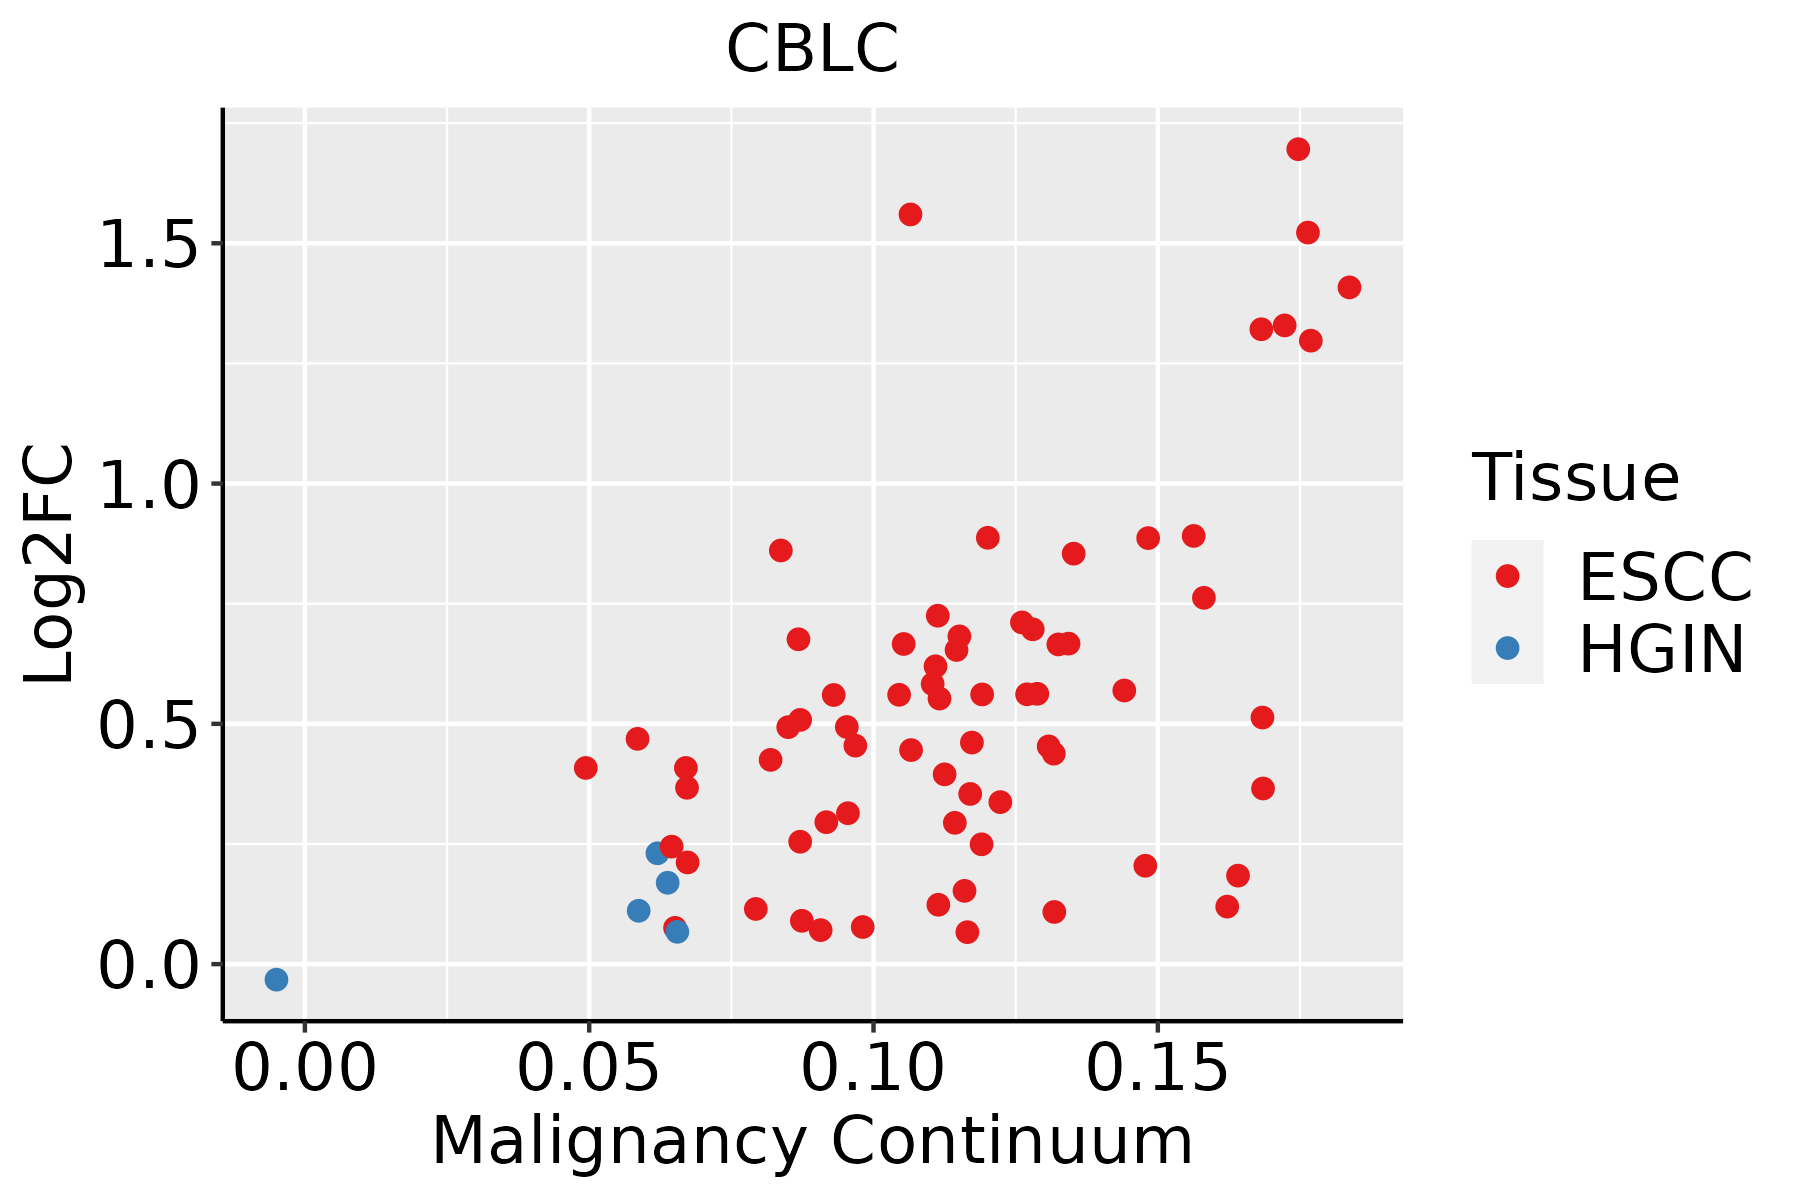 | ESCC: Esophageal squamous cell carcinoma |
| HGIN: High-grade intraepithelial neoplasias |
| LGIN: Low-grade intraepithelial neoplasias |
| GC |  | CAG: Chronic atrophic gastritis |
| CAG with IM: Chronic atrophic gastritis with intestinal metaplasia |
| CSG: Chronic superficial gastritis |
| GC: Gastric cancer |
| SIM: Severe intestinal metaplasia |
| WIM: Wild intestinal metaplasia |
| Oral Cavity | 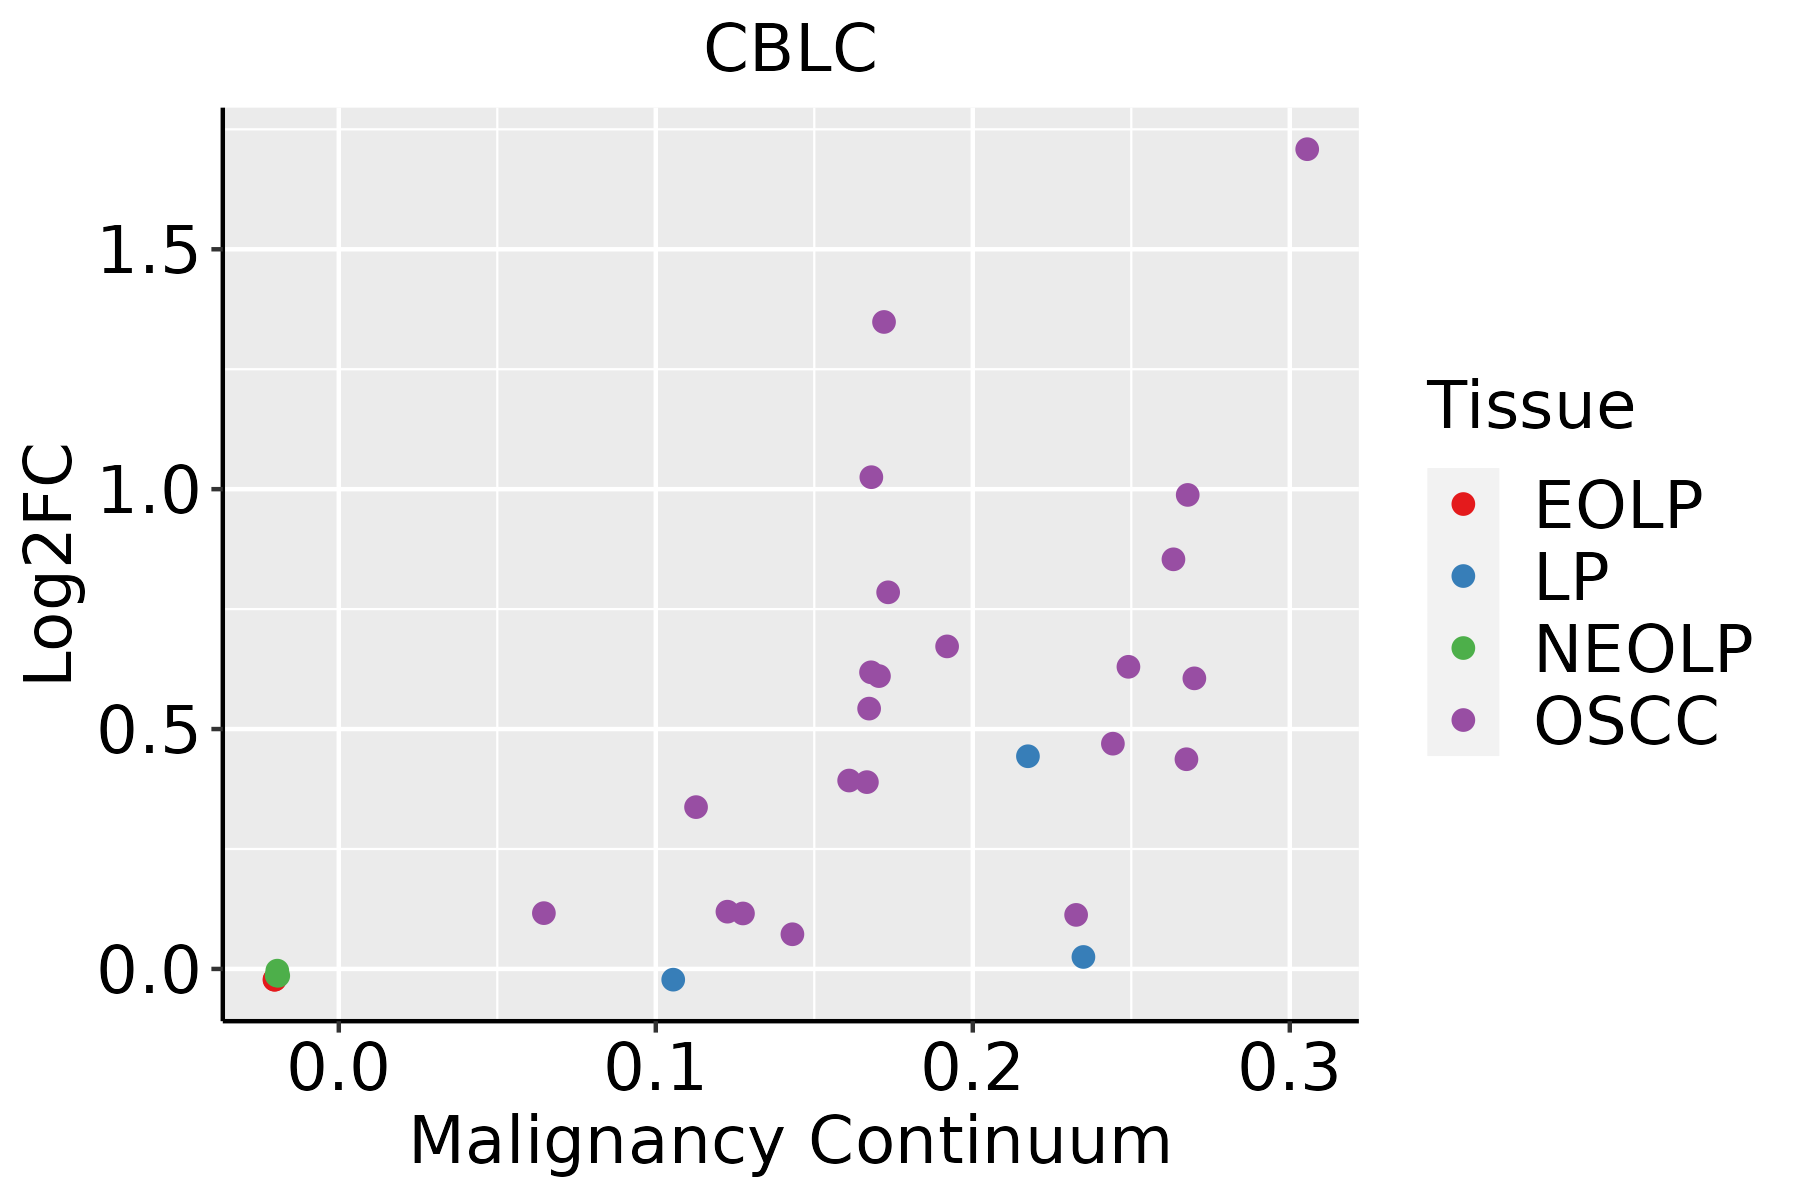 | EOLP: Erosive Oral lichen planus |
| LP: leukoplakia |
| NEOLP: Non-erosive oral lichen planus |
| OSCC: Oral squamous cell carcinoma |
| Skin | 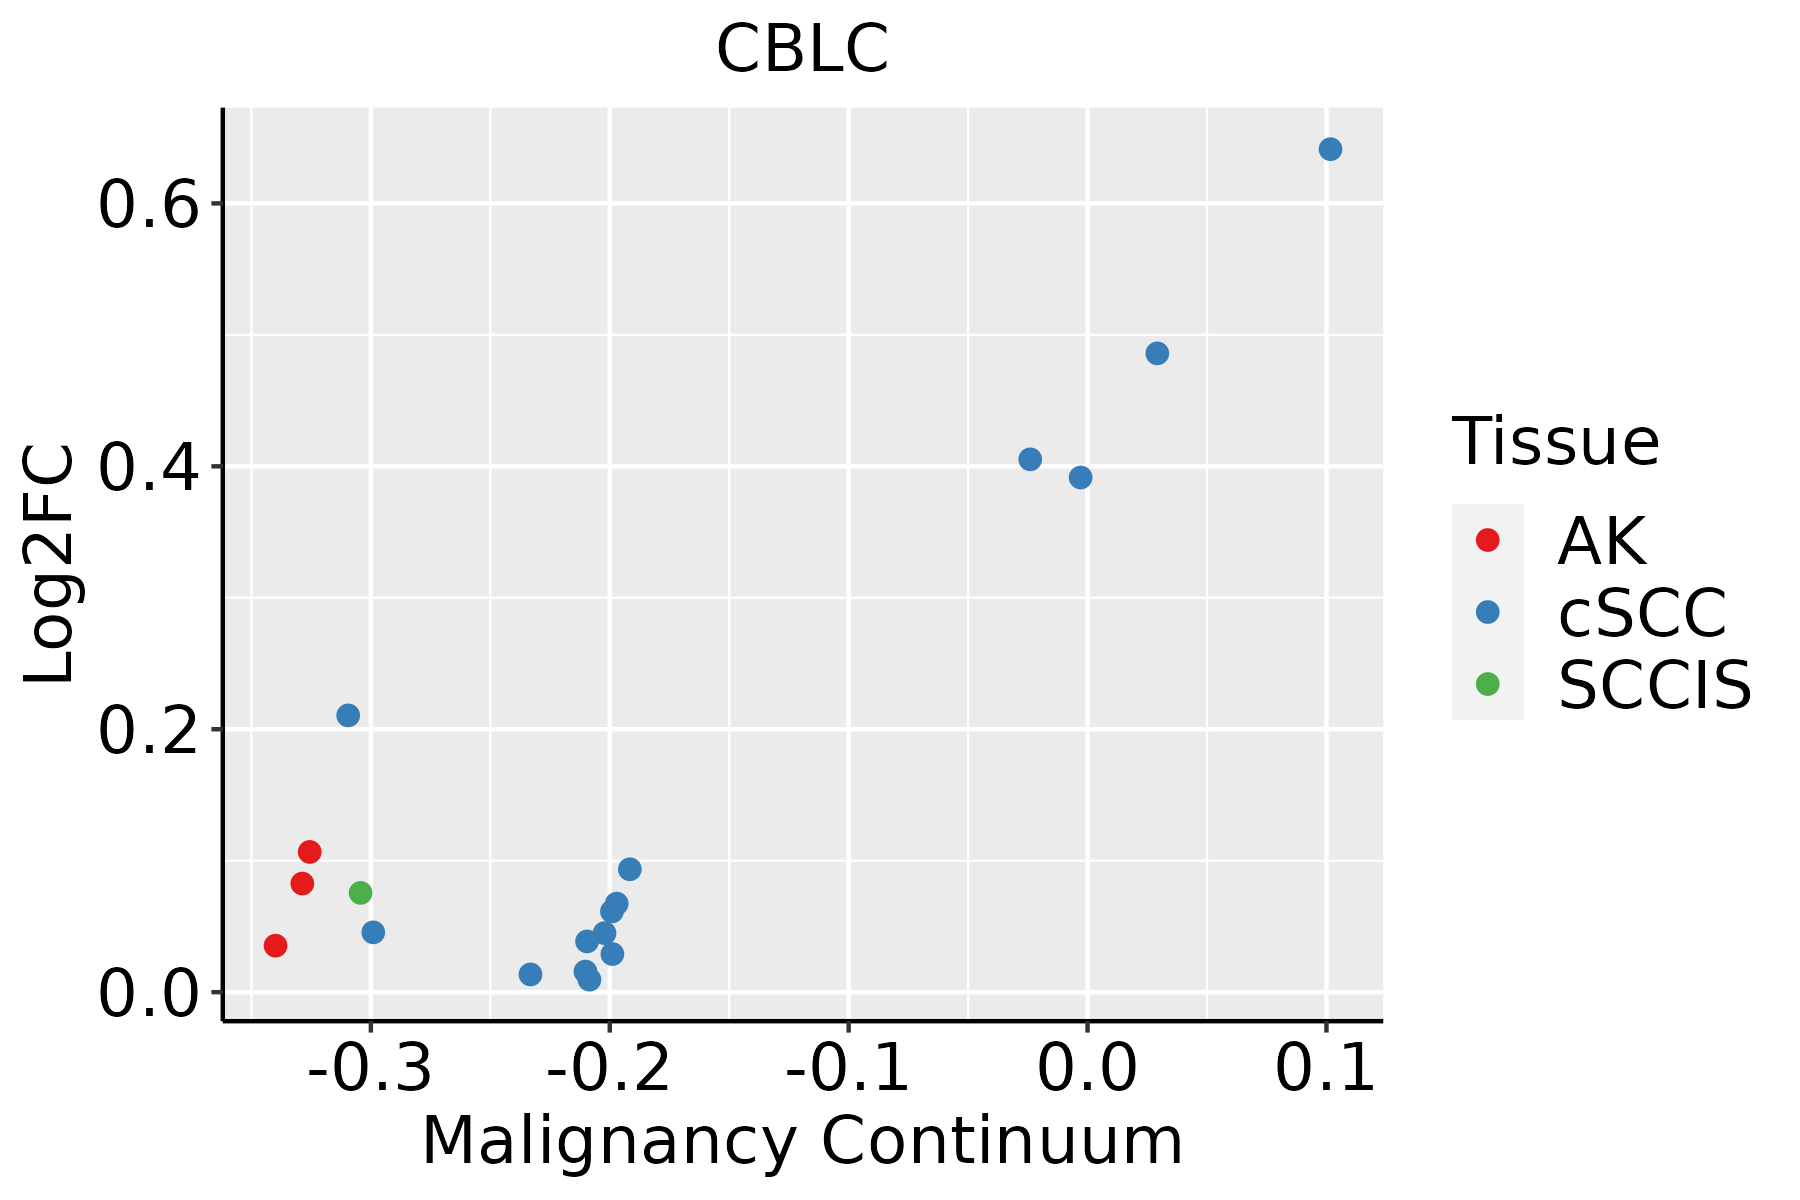 | AK: Actinic keratosis |
| cSCC: Cutaneous squamous cell carcinoma |
| SCCIS:squamous cell carcinoma in situ |
| GO ID | Tissue | Disease Stage | Description | Gene Ratio | Bg Ratio | pvalue | p.adjust | Count |
| GO:0007176 | Colorectum | CRC | regulation of epidermal growth factor-activated receptor activity | 10/2078 | 30/18723 | 1.03e-03 | 1.21e-02 | 10 |
| GO:00064694 | Colorectum | CRC | negative regulation of protein kinase activity | 39/2078 | 212/18723 | 1.04e-03 | 1.22e-02 | 39 |
| GO:00610993 | Colorectum | CRC | negative regulation of protein tyrosine kinase activity | 10/2078 | 31/18723 | 1.37e-03 | 1.50e-02 | 10 |
| GO:00071751 | Colorectum | CRC | negative regulation of epidermal growth factor-activated receptor activity | 6/2078 | 14/18723 | 2.53e-03 | 2.38e-02 | 6 |
| GO:00019335 | Colorectum | CRC | negative regulation of protein phosphorylation | 55/2078 | 342/18723 | 3.05e-03 | 2.72e-02 | 55 |
| GO:00459365 | Colorectum | CRC | negative regulation of phosphate metabolic process | 68/2078 | 441/18723 | 3.15e-03 | 2.78e-02 | 68 |
| GO:00105635 | Colorectum | CRC | negative regulation of phosphorus metabolic process | 68/2078 | 442/18723 | 3.33e-03 | 2.85e-02 | 68 |
| GO:00336734 | Colorectum | CRC | negative regulation of kinase activity | 40/2078 | 237/18723 | 4.58e-03 | 3.57e-02 | 40 |
| GO:00423265 | Colorectum | CRC | negative regulation of phosphorylation | 59/2078 | 385/18723 | 6.45e-03 | 4.67e-02 | 59 |
| GO:0010563111 | Esophagus | ESCC | negative regulation of phosphorus metabolic process | 274/8552 | 442/18723 | 2.32e-12 | 9.41e-11 | 274 |
| GO:0045936111 | Esophagus | ESCC | negative regulation of phosphate metabolic process | 273/8552 | 441/18723 | 3.18e-12 | 1.25e-10 | 273 |
| GO:0051348111 | Esophagus | ESCC | negative regulation of transferase activity | 177/8552 | 268/18723 | 1.08e-11 | 4.00e-10 | 177 |
| GO:007190016 | Esophagus | ESCC | regulation of protein serine/threonine kinase activity | 227/8552 | 359/18723 | 1.12e-11 | 4.10e-10 | 227 |
| GO:0042326111 | Esophagus | ESCC | negative regulation of phosphorylation | 237/8552 | 385/18723 | 1.86e-10 | 5.33e-09 | 237 |
| GO:0001933111 | Esophagus | ESCC | negative regulation of protein phosphorylation | 213/8552 | 342/18723 | 3.54e-10 | 9.76e-09 | 213 |
| GO:003367319 | Esophagus | ESCC | negative regulation of kinase activity | 154/8552 | 237/18723 | 1.38e-09 | 3.27e-08 | 154 |
| GO:000646920 | Esophagus | ESCC | negative regulation of protein kinase activity | 140/8552 | 212/18723 | 1.53e-09 | 3.56e-08 | 140 |
| GO:003812718 | Esophagus | ESCC | ERBB signaling pathway | 82/8552 | 121/18723 | 7.23e-07 | 9.40e-06 | 82 |
| GO:000717318 | Esophagus | ESCC | epidermal growth factor receptor signaling pathway | 73/8552 | 108/18723 | 3.36e-06 | 3.73e-05 | 73 |
| GO:190118413 | Esophagus | ESCC | regulation of ERBB signaling pathway | 54/8552 | 79/18723 | 3.81e-05 | 3.08e-04 | 54 |
| Pathway ID | Tissue | Disease Stage | Description | Gene Ratio | Bg Ratio | pvalue | p.adjust | qvalue | Count |
| hsa04144 | Colorectum | AD | Endocytosis | 111/2092 | 251/8465 | 5.95e-12 | 1.42e-10 | 9.08e-11 | 111 |
| hsa04120 | Colorectum | AD | Ubiquitin mediated proteolysis | 58/2092 | 142/8465 | 1.46e-05 | 1.53e-04 | 9.76e-05 | 58 |
| hsa041441 | Colorectum | AD | Endocytosis | 111/2092 | 251/8465 | 5.95e-12 | 1.42e-10 | 9.08e-11 | 111 |
| hsa041201 | Colorectum | AD | Ubiquitin mediated proteolysis | 58/2092 | 142/8465 | 1.46e-05 | 1.53e-04 | 9.76e-05 | 58 |
| hsa041444 | Colorectum | MSS | Endocytosis | 102/1875 | 251/8465 | 1.85e-11 | 4.43e-10 | 2.71e-10 | 102 |
| hsa041204 | Colorectum | MSS | Ubiquitin mediated proteolysis | 55/1875 | 142/8465 | 5.02e-06 | 6.00e-05 | 3.68e-05 | 55 |
| hsa041445 | Colorectum | MSS | Endocytosis | 102/1875 | 251/8465 | 1.85e-11 | 4.43e-10 | 2.71e-10 | 102 |
| hsa041205 | Colorectum | MSS | Ubiquitin mediated proteolysis | 55/1875 | 142/8465 | 5.02e-06 | 6.00e-05 | 3.68e-05 | 55 |
| hsa041446 | Colorectum | FAP | Endocytosis | 78/1404 | 251/8465 | 6.20e-09 | 2.96e-07 | 1.80e-07 | 78 |
| hsa041206 | Colorectum | FAP | Ubiquitin mediated proteolysis | 51/1404 | 142/8465 | 1.55e-08 | 5.84e-07 | 3.55e-07 | 51 |
| hsa041447 | Colorectum | FAP | Endocytosis | 78/1404 | 251/8465 | 6.20e-09 | 2.96e-07 | 1.80e-07 | 78 |
| hsa041207 | Colorectum | FAP | Ubiquitin mediated proteolysis | 51/1404 | 142/8465 | 1.55e-08 | 5.84e-07 | 3.55e-07 | 51 |
| hsa041448 | Colorectum | CRC | Endocytosis | 65/1091 | 251/8465 | 1.27e-08 | 1.06e-06 | 7.19e-07 | 65 |
| hsa041208 | Colorectum | CRC | Ubiquitin mediated proteolysis | 42/1091 | 142/8465 | 9.98e-08 | 6.67e-06 | 4.52e-06 | 42 |
| hsa041449 | Colorectum | CRC | Endocytosis | 65/1091 | 251/8465 | 1.27e-08 | 1.06e-06 | 7.19e-07 | 65 |
| hsa041209 | Colorectum | CRC | Ubiquitin mediated proteolysis | 42/1091 | 142/8465 | 9.98e-08 | 6.67e-06 | 4.52e-06 | 42 |
| hsa0412027 | Esophagus | ESCC | Ubiquitin mediated proteolysis | 122/4205 | 142/8465 | 6.53e-20 | 7.29e-18 | 3.74e-18 | 122 |
| hsa04144210 | Esophagus | ESCC | Endocytosis | 186/4205 | 251/8465 | 9.74e-16 | 4.66e-14 | 2.39e-14 | 186 |
| hsa0412036 | Esophagus | ESCC | Ubiquitin mediated proteolysis | 122/4205 | 142/8465 | 6.53e-20 | 7.29e-18 | 3.74e-18 | 122 |
| hsa0414437 | Esophagus | ESCC | Endocytosis | 186/4205 | 251/8465 | 9.74e-16 | 4.66e-14 | 2.39e-14 | 186 |
| Hugo Symbol | Variant Class | Variant Classification | dbSNP RS | HGVSc | HGVSp | HGVSp Short | SWISSPROT | BIOTYPE | SIFT | PolyPhen | Tumor Sample Barcode | Tissue | Histology | Sex | Age | Stage | Therapy Types | Drugs | Outcome |
| CBLC | SNV | Missense_Mutation | novel | c.740N>C | p.Val247Ala | p.V247A | Q9ULV8 | protein_coding | deleterious(0.02) | probably_damaging(0.999) | TCGA-AN-A046-01 | Breast | breast invasive carcinoma | Female | >=65 | I/II | Unknown | Unknown | SD |
| CBLC | SNV | Missense_Mutation | | c.1387C>G | p.Pro463Ala | p.P463A | Q9ULV8 | protein_coding | tolerated_low_confidence(0.15) | benign(0.003) | TCGA-AR-A1AY-01 | Breast | breast invasive carcinoma | Female | >=65 | I/II | Unspecific | Doxorubicin | SD |
| CBLC | SNV | Missense_Mutation | rs752145860 | c.499N>G | p.Arg167Gly | p.R167G | Q9ULV8 | protein_coding | deleterious(0.01) | probably_damaging(0.985) | TCGA-B6-A400-01 | Breast | breast invasive carcinoma | Female | <65 | III/IV | Unknown | Unknown | SD |
| CBLC | insertion | Nonsense_Mutation | novel | c.860_861insACCCAGGACCCCAGAGAGTTGATAACTCAGAGG | p.Thr287_Ile288insProArgThrProGluSerTerTerLeuArgGly | p.T287_I288insPRTPES**LRG | Q9ULV8 | protein_coding | | | TCGA-A8-A09Q-01 | Breast | breast invasive carcinoma | Female | >=65 | III/IV | Hormone Therapy | anastrozole | SD |
| CBLC | deletion | Frame_Shift_Del | novel | c.1407delN | p.Asp470ThrfsTer? | p.D470Tfs*? | Q9ULV8 | protein_coding | | | TCGA-EW-A2FV-01 | Breast | breast invasive carcinoma | Female | <65 | III/IV | Chemotherapy | docetaxel | SD |
| CBLC | SNV | Missense_Mutation | rs770372319 | c.40N>A | p.Glu14Lys | p.E14K | Q9ULV8 | protein_coding | deleterious(0.03) | benign(0.003) | TCGA-C5-A1MK-01 | Cervix | cervical & endocervical cancer | Female | >=65 | III/IV | Chemotherapy | carboplatin | PD |
| CBLC | SNV | Missense_Mutation | rs763654909 | c.1066G>A | p.Glu356Lys | p.E356K | Q9ULV8 | protein_coding | deleterious(0) | probably_damaging(0.96) | TCGA-Q1-A73O-01 | Cervix | cervical & endocervical cancer | Female | <65 | I/II | Chemotherapy | cisplatin | CR |
| CBLC | SNV | Missense_Mutation | novel | c.1186N>C | p.Trp396Arg | p.W396R | Q9ULV8 | protein_coding | tolerated(0.37) | benign(0) | TCGA-AD-A5EJ-01 | Colorectum | colon adenocarcinoma | Female | >=65 | I/II | Unknown | Unknown | SD |
| CBLC | SNV | Missense_Mutation | | c.706N>T | p.Pro236Ser | p.P236S | Q9ULV8 | protein_coding | deleterious(0.02) | probably_damaging(0.998) | TCGA-AU-6004-01 | Colorectum | colon adenocarcinoma | Female | >=65 | I/II | Unknown | Unknown | SD |
| CBLC | SNV | Missense_Mutation | rs745556828 | c.1295N>T | p.Ser432Leu | p.S432L | Q9ULV8 | protein_coding | deleterious(0.04) | benign(0) | TCGA-AZ-6598-01 | Colorectum | colon adenocarcinoma | Female | >=65 | I/II | Unknown | Unknown | SD |


