
|
|||||
|
 | |
| |
| |
| |
| |
| |
|
Gene: CARHSP1 |
Gene summary for CARHSP1 |
| Gene information | Species | Human | Gene symbol | CARHSP1 | Gene ID | 23589 |
| Gene name | calcium regulated heat stable protein 1 | |
| Gene Alias | CRHSP-24 | |
| Cytomap | 16p13.2 | |
| Gene Type | protein-coding | GO ID | GO:0006139 | UniProtAcc | Q9Y2V2 |
Top |
Malignant transformation analysis |
| Identification of the aberrant gene expression in precancerous and cancerous lesions by comparing the gene expression of stem-like cells in diseased tissues with normal stem cells |
| Entrez ID | Symbol | Replicates | Species | Organ | Tissue | Adj P-value | Log2FC | Malignancy |
| 23589 | CARHSP1 | GSM4909280 | Human | Breast | Precancer | 2.26e-02 | -6.95e-01 | 0.0305 |
| 23589 | CARHSP1 | GSM4909281 | Human | Breast | IDC | 2.20e-12 | -3.39e-01 | 0.21 |
| 23589 | CARHSP1 | GSM4909282 | Human | Breast | IDC | 2.35e-05 | 2.99e-01 | -0.0288 |
| 23589 | CARHSP1 | GSM4909285 | Human | Breast | IDC | 7.55e-25 | -6.17e-01 | 0.21 |
| 23589 | CARHSP1 | GSM4909286 | Human | Breast | IDC | 4.64e-26 | -6.84e-01 | 0.1081 |
| 23589 | CARHSP1 | GSM4909290 | Human | Breast | IDC | 6.64e-08 | -4.40e-01 | 0.2096 |
| 23589 | CARHSP1 | GSM4909291 | Human | Breast | IDC | 1.05e-02 | -3.74e-01 | 0.1753 |
| 23589 | CARHSP1 | GSM4909292 | Human | Breast | IDC | 4.37e-04 | -8.38e-01 | 0.1236 |
| 23589 | CARHSP1 | GSM4909293 | Human | Breast | IDC | 3.58e-20 | -5.83e-01 | 0.1581 |
| 23589 | CARHSP1 | GSM4909294 | Human | Breast | IDC | 1.12e-12 | -6.31e-01 | 0.2022 |
| 23589 | CARHSP1 | GSM4909295 | Human | Breast | IDC | 3.23e-06 | -4.46e-01 | 0.0898 |
| 23589 | CARHSP1 | GSM4909296 | Human | Breast | IDC | 2.26e-16 | -6.20e-01 | 0.1524 |
| 23589 | CARHSP1 | GSM4909297 | Human | Breast | IDC | 4.69e-24 | -6.93e-01 | 0.1517 |
| 23589 | CARHSP1 | GSM4909298 | Human | Breast | IDC | 1.76e-17 | -4.67e-01 | 0.1551 |
| 23589 | CARHSP1 | GSM4909299 | Human | Breast | IDC | 1.30e-12 | -4.78e-01 | 0.035 |
| 23589 | CARHSP1 | GSM4909301 | Human | Breast | IDC | 3.58e-05 | -3.16e-01 | 0.1577 |
| 23589 | CARHSP1 | GSM4909302 | Human | Breast | IDC | 3.79e-09 | -5.02e-01 | 0.1545 |
| 23589 | CARHSP1 | GSM4909303 | Human | Breast | IDC | 1.41e-03 | -5.96e-01 | 0.0438 |
| 23589 | CARHSP1 | GSM4909304 | Human | Breast | IDC | 1.49e-13 | -4.17e-01 | 0.1636 |
| 23589 | CARHSP1 | GSM4909305 | Human | Breast | IDC | 2.72e-08 | -3.31e-01 | 0.0436 |
| Page: 1 2 3 4 5 6 7 8 9 10 11 |
| Tissue | Expression Dynamics | Abbreviation |
| Breast |  | IDC: Invasive ductal carcinoma |
| DCIS: Ductal carcinoma in situ | ||
| Precancer(BRCA1-mut): Precancerous lesion from BRCA1 mutation carriers | ||
| Colorectum (GSE201348) |  | FAP: Familial adenomatous polyposis |
| CRC: Colorectal cancer | ||
| Colorectum (HTA11) |  | AD: Adenomas |
| SER: Sessile serrated lesions | ||
| MSI-H: Microsatellite-high colorectal cancer | ||
| MSS: Microsatellite stable colorectal cancer | ||
| Endometrium | 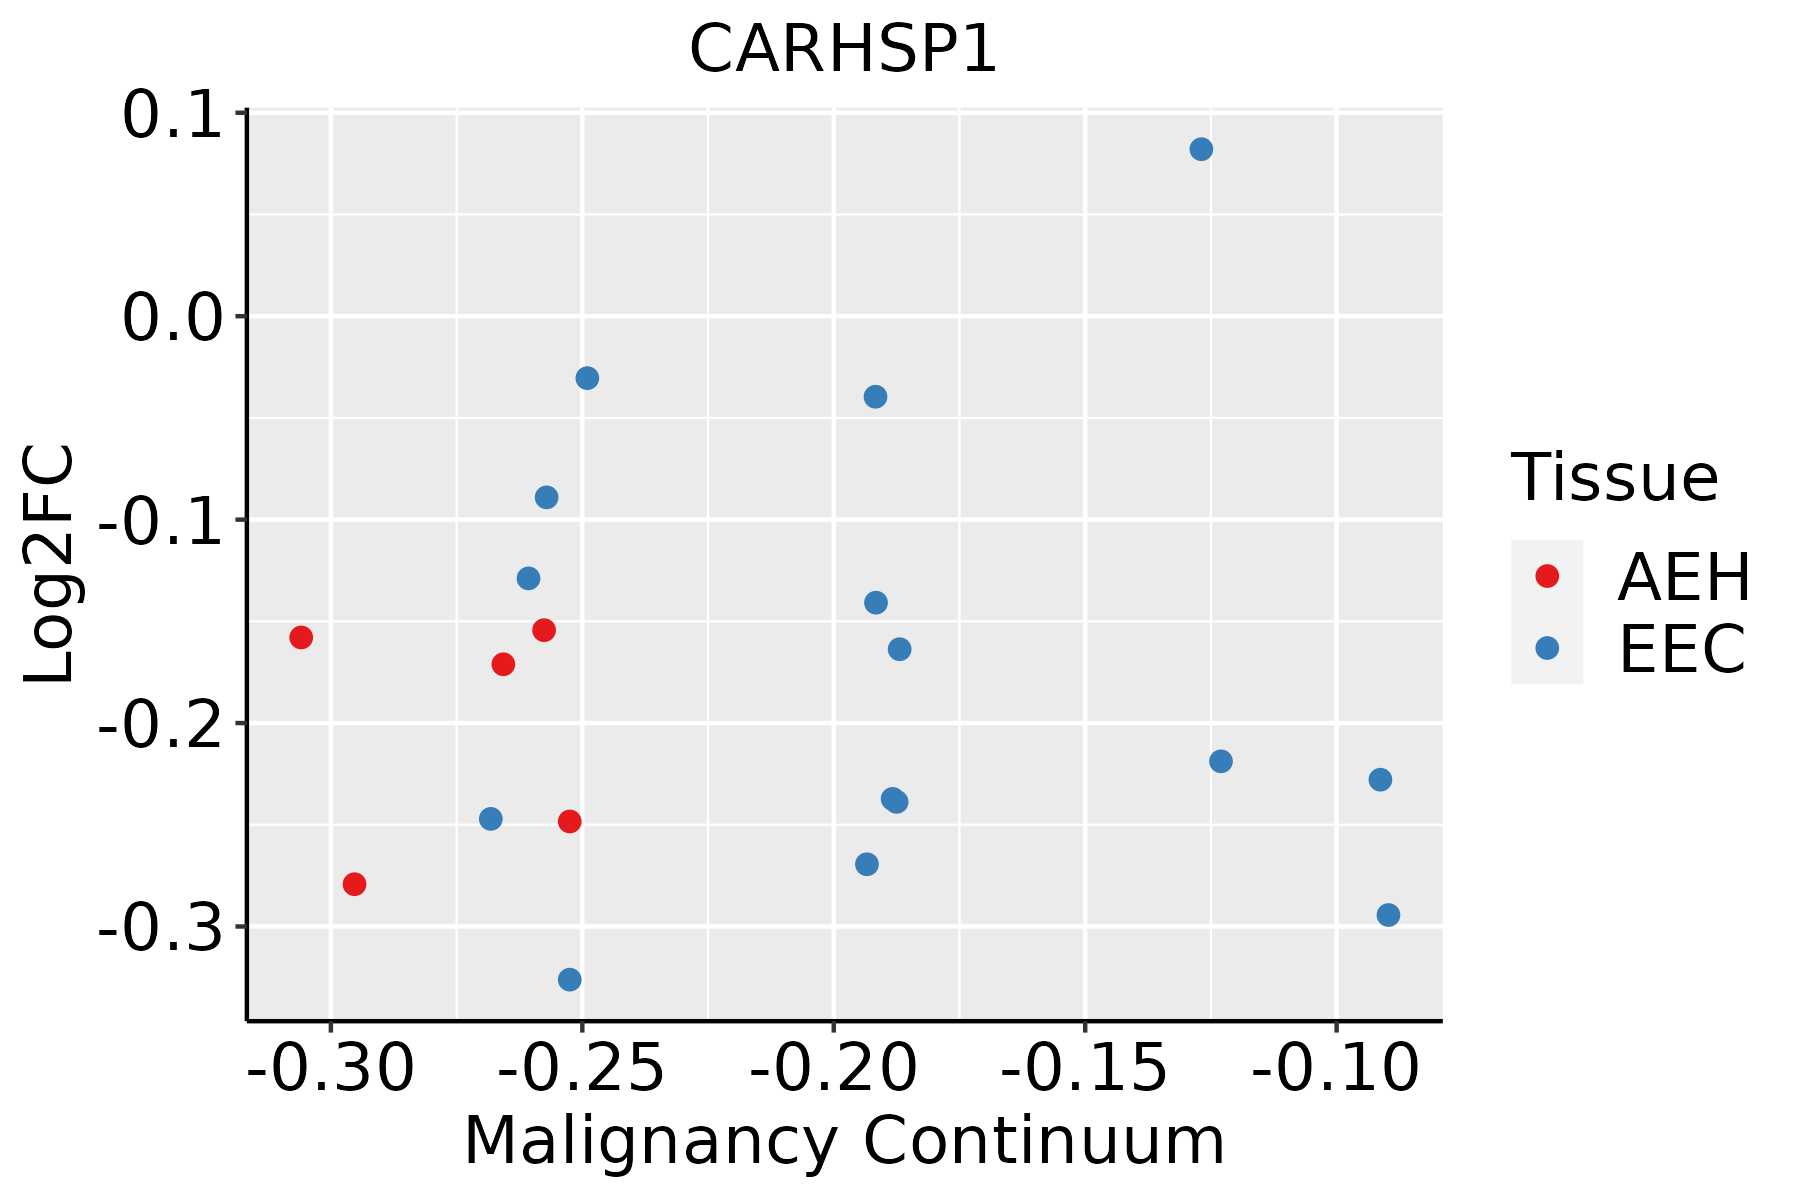 | AEH: Atypical endometrial hyperplasia |
| EEC: Endometrioid Cancer | ||
| Esophagus | 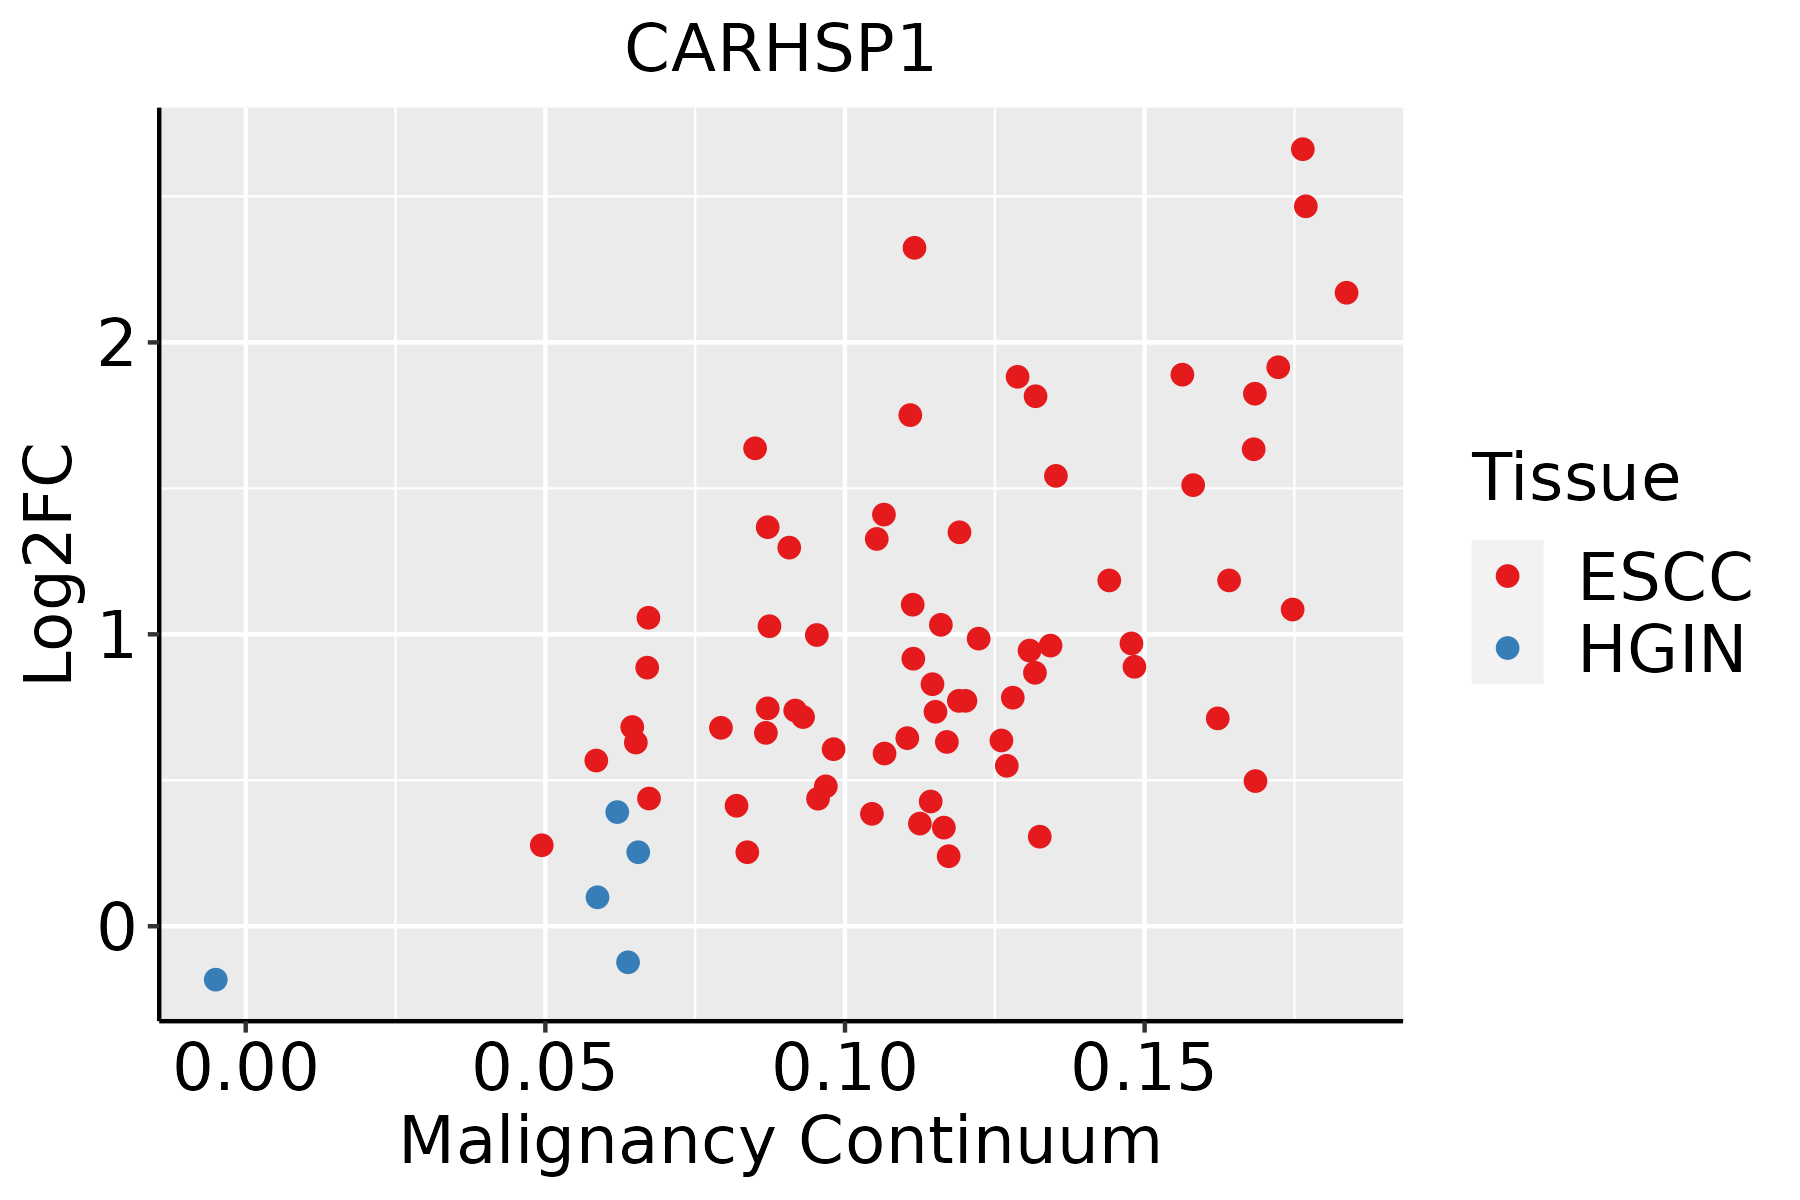 | ESCC: Esophageal squamous cell carcinoma |
| HGIN: High-grade intraepithelial neoplasias | ||
| LGIN: Low-grade intraepithelial neoplasias | ||
| Liver | 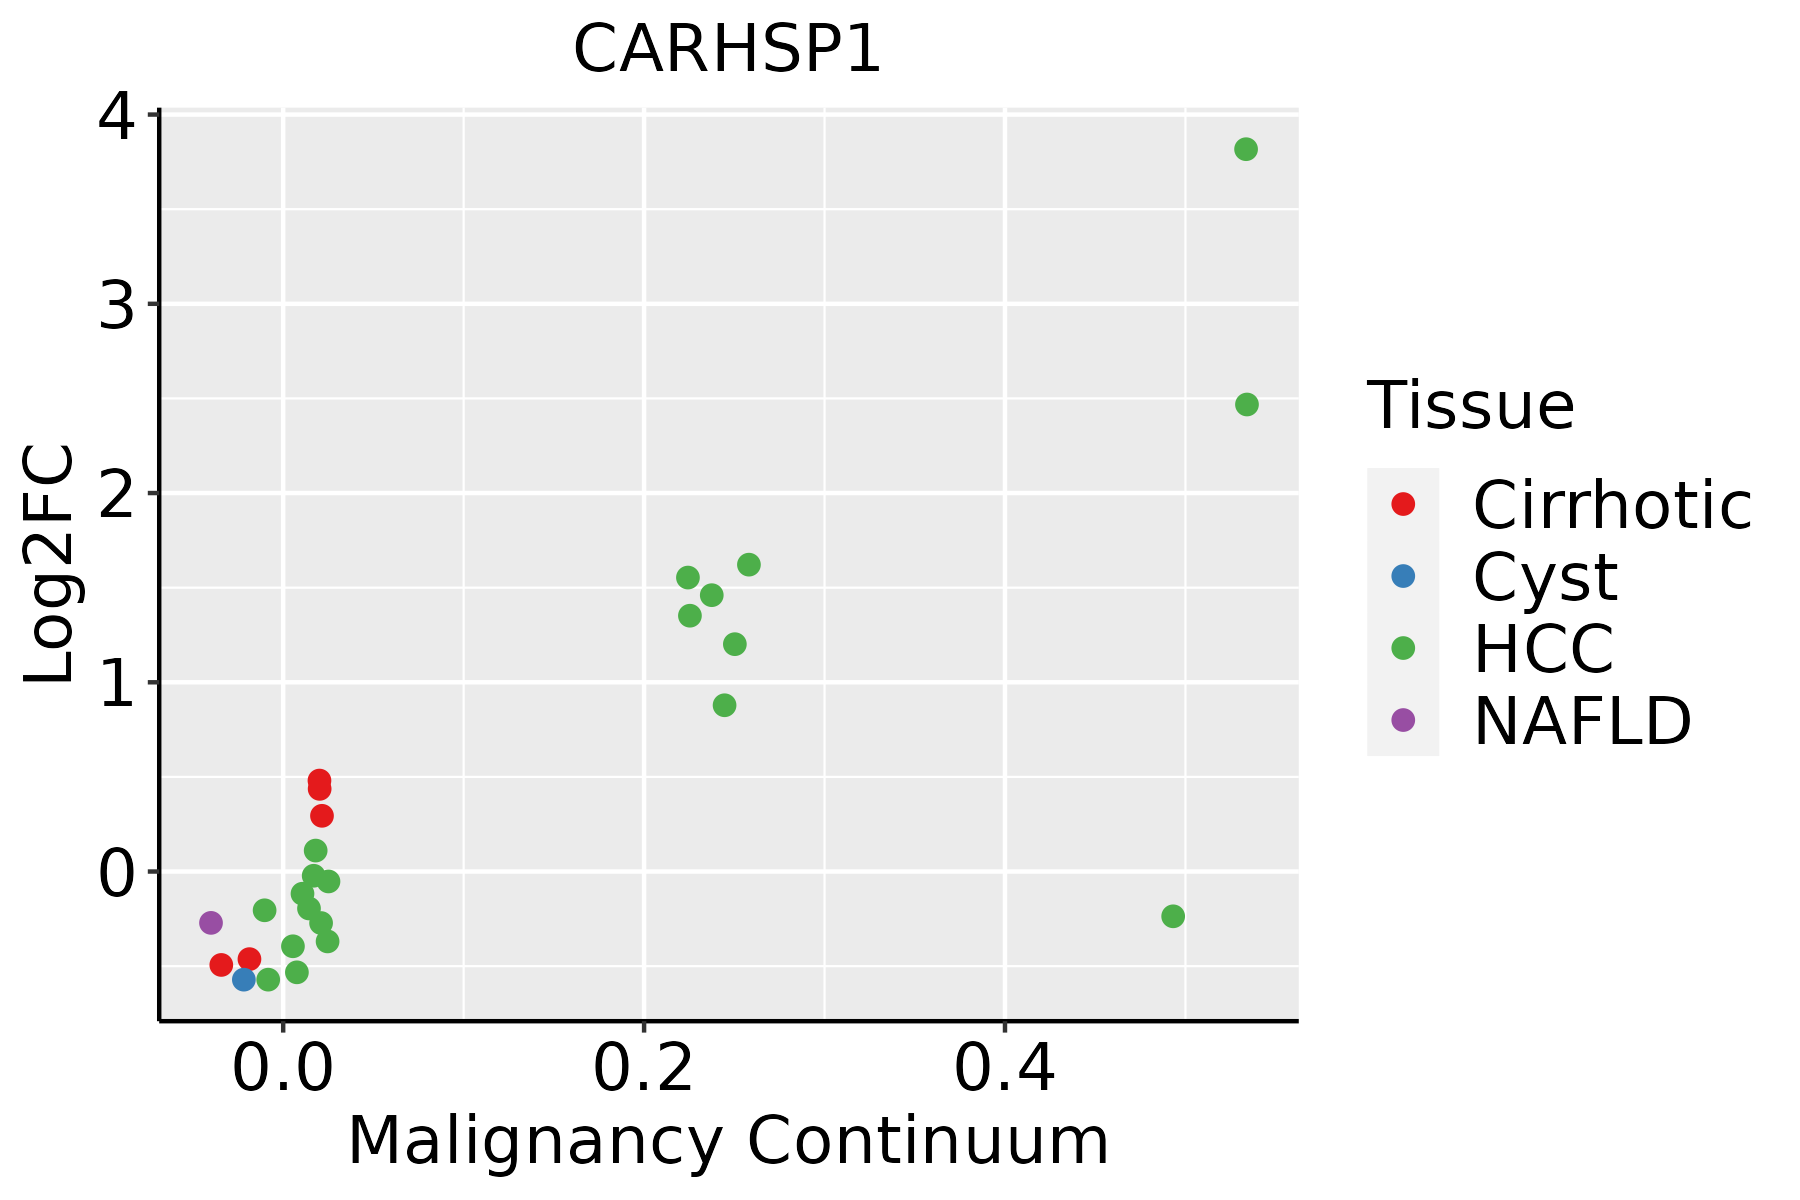 | HCC: Hepatocellular carcinoma |
| NAFLD: Non-alcoholic fatty liver disease | ||
| Oral Cavity | 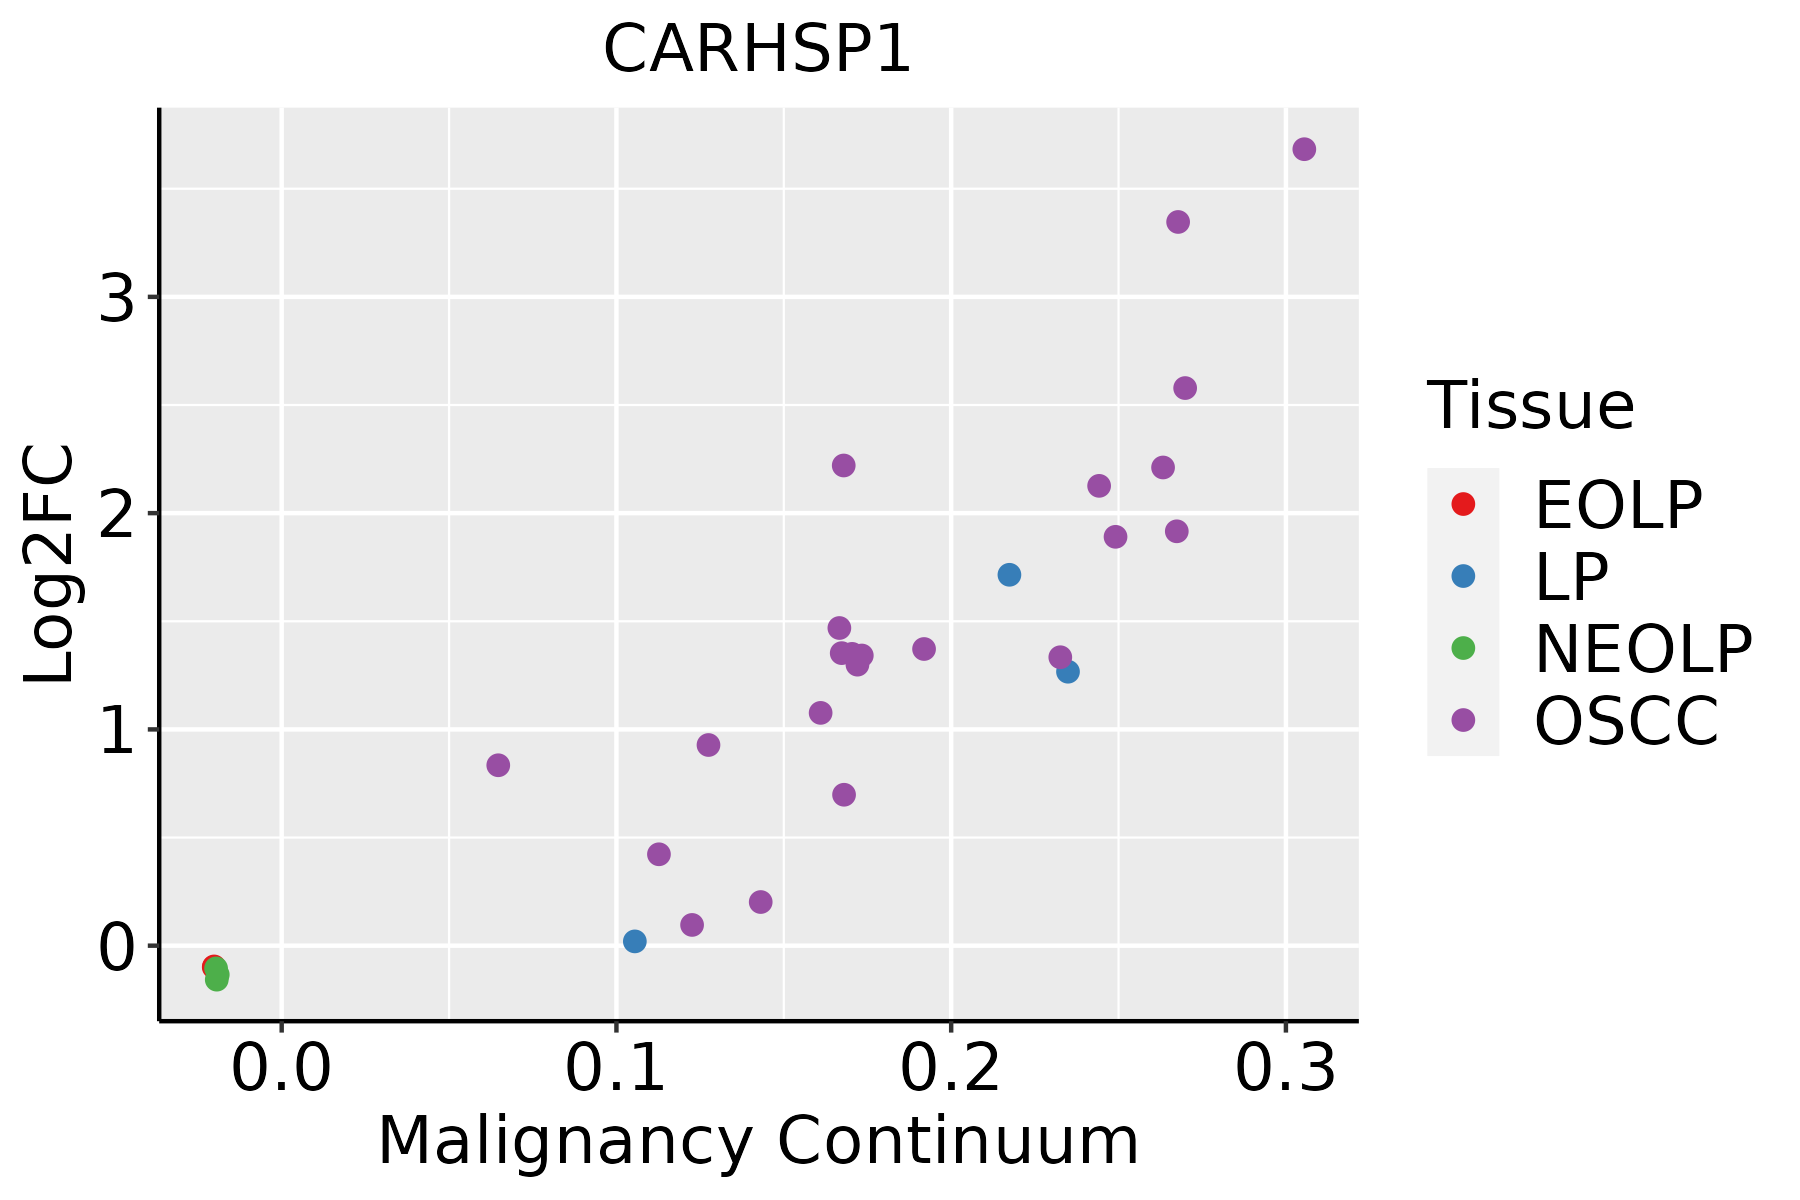 | EOLP: Erosive Oral lichen planus |
| LP: leukoplakia | ||
| NEOLP: Non-erosive oral lichen planus | ||
| OSCC: Oral squamous cell carcinoma | ||
| Skin | 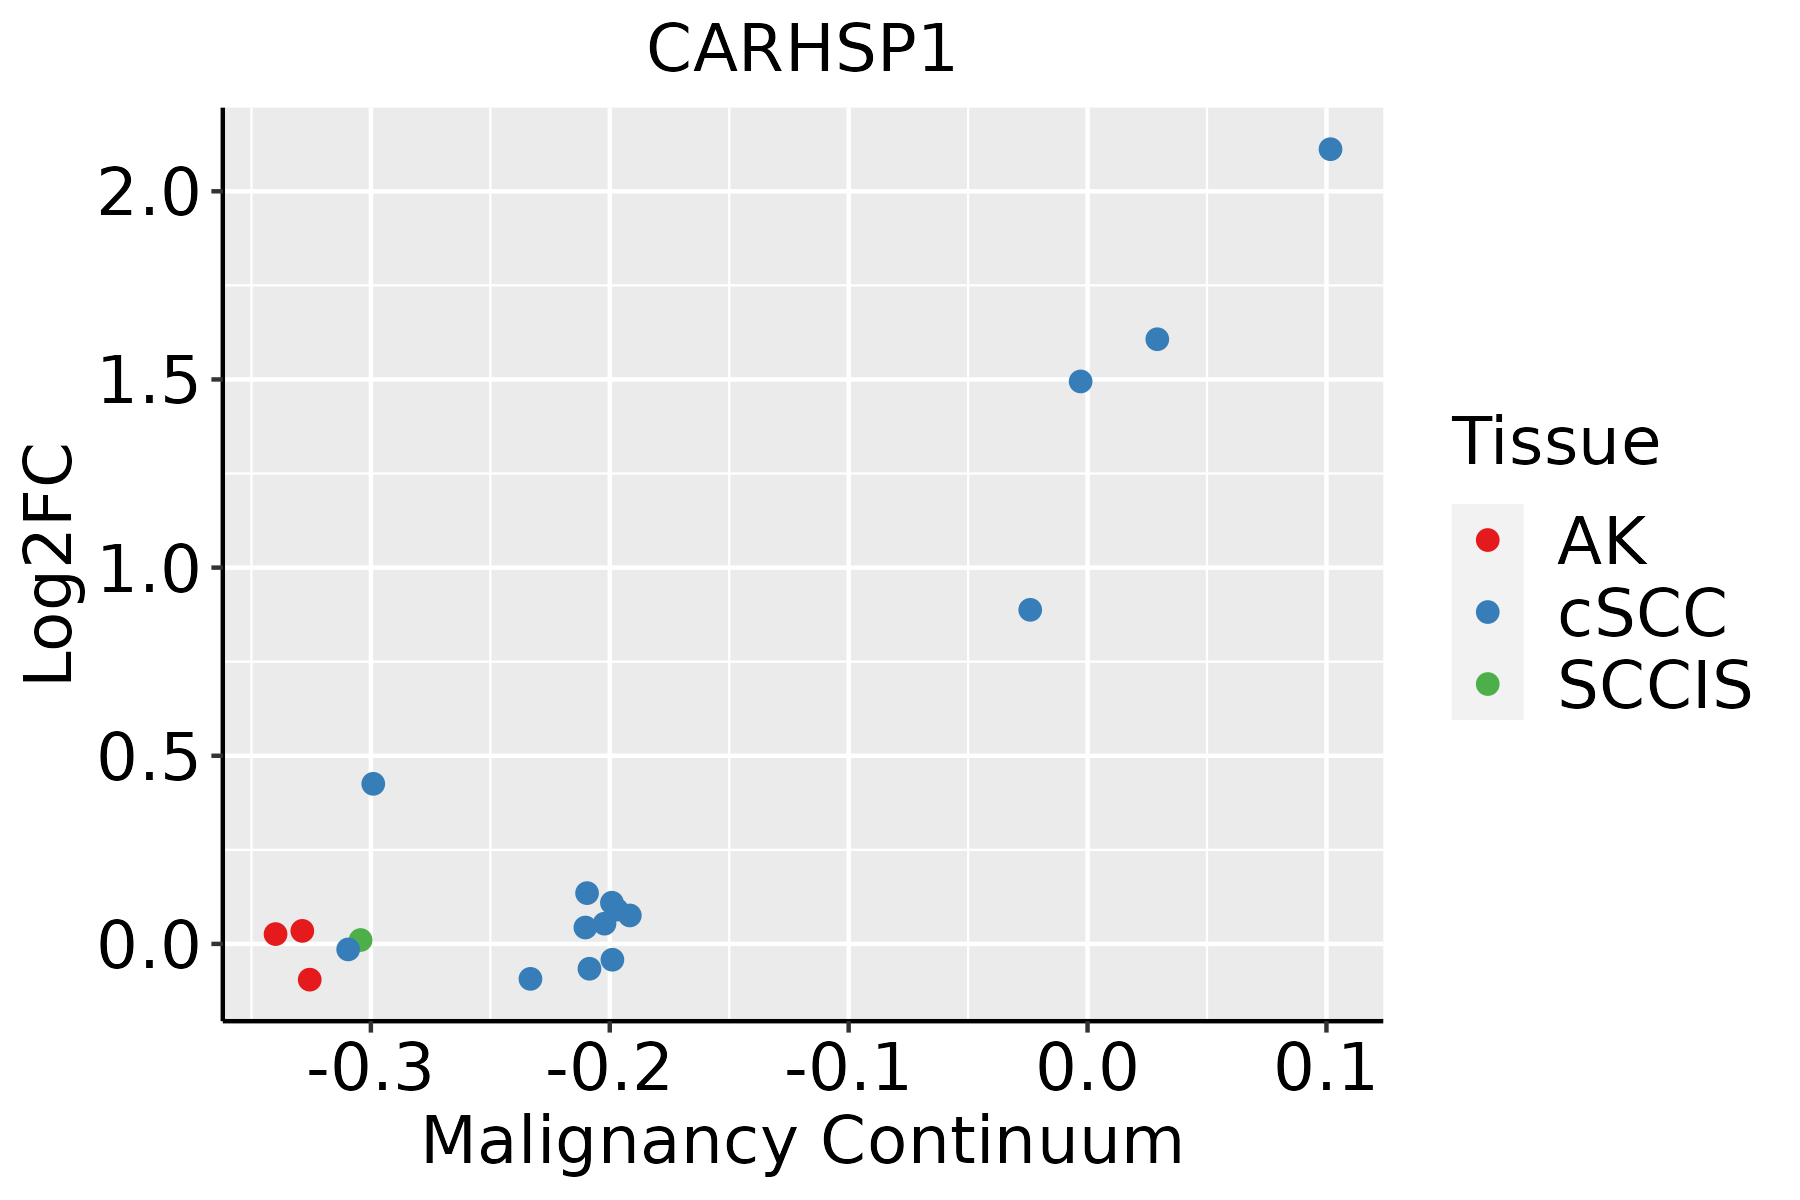 | AK: Actinic keratosis |
| cSCC: Cutaneous squamous cell carcinoma | ||
| SCCIS:squamous cell carcinoma in situ | ||
| Thyroid | 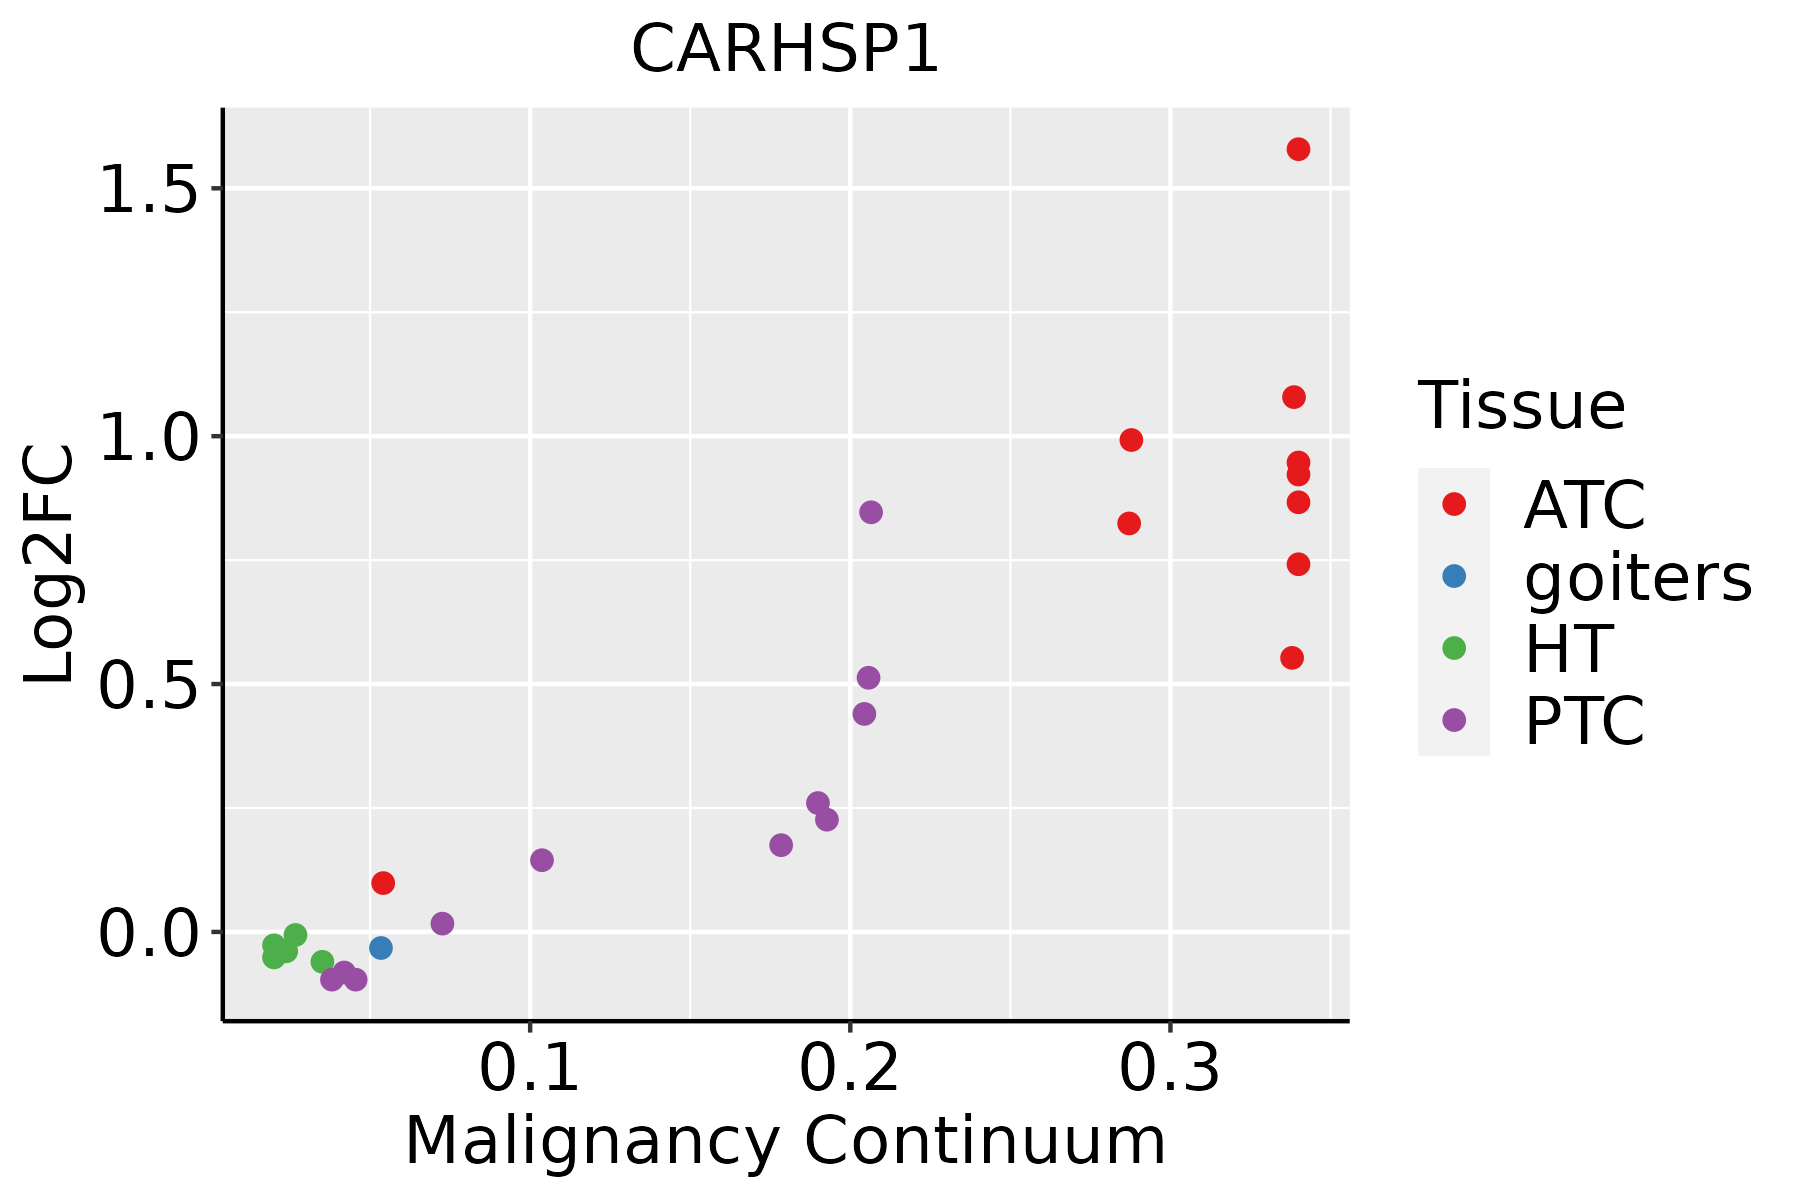 | ATC: Anaplastic thyroid cancer |
| HT: Hashimoto's thyroiditis | ||
| PTC: Papillary thyroid cancer |
| ∗log2FC in expression of this searched gene in stem-like cells from each diseased tissue sample relative to stem-like cells in normal samples in each tissue plotted against the malignancy continuum. Samples are colored based on if they are from different disease stage. |
Top |
Malignant transformation related pathway analysis |
| Find out the enriched GO biological processes and KEGG pathways involved in transition from healthy to precancer to cancer |
| Tissue | Disease Stage | Enriched GO biological Processes |
| Colorectum | AD |  |
| Colorectum | SER |  |
| Colorectum | MSS |  |
| Colorectum | MSI-H |  |
| Colorectum | FAP |  |
| ∗Top 15 enriched GO BP terms are showed in the bar plot of each disease state in each tissue. Each row represents a significant GO biological process which is colored according to the -log10(p.adjust). |
| Page: 1 2 3 4 5 6 7 8 9 |
| GO ID | Tissue | Disease Stage | Description | Gene Ratio | Bg Ratio | pvalue | p.adjust | Count |
| GO:19033114 | Colorectum | FAP | regulation of mRNA metabolic process | 97/2622 | 288/18723 | 1.35e-17 | 4.13e-14 | 97 |
| GO:00610134 | Colorectum | FAP | regulation of mRNA catabolic process | 54/2622 | 166/18723 | 8.64e-10 | 1.96e-07 | 54 |
| GO:00064024 | Colorectum | FAP | mRNA catabolic process | 68/2622 | 232/18723 | 9.87e-10 | 2.16e-07 | 68 |
| GO:00064014 | Colorectum | FAP | RNA catabolic process | 77/2622 | 278/18723 | 1.42e-09 | 2.77e-07 | 77 |
| GO:00434874 | Colorectum | FAP | regulation of RNA stability | 53/2622 | 170/18723 | 6.61e-09 | 1.00e-06 | 53 |
| GO:00434884 | Colorectum | FAP | regulation of mRNA stability | 50/2622 | 158/18723 | 1.01e-08 | 1.27e-06 | 50 |
| GO:00442704 | Colorectum | FAP | cellular nitrogen compound catabolic process | 101/2622 | 451/18723 | 7.42e-07 | 3.44e-05 | 101 |
| GO:00346554 | Colorectum | FAP | nucleobase-containing compound catabolic process | 92/2622 | 407/18723 | 1.50e-06 | 6.49e-05 | 92 |
| GO:00467004 | Colorectum | FAP | heterocycle catabolic process | 98/2622 | 445/18723 | 2.36e-06 | 9.21e-05 | 98 |
| GO:00194394 | Colorectum | FAP | aromatic compound catabolic process | 100/2622 | 467/18723 | 6.75e-06 | 2.08e-04 | 100 |
| GO:19013614 | Colorectum | FAP | organic cyclic compound catabolic process | 101/2622 | 495/18723 | 4.87e-05 | 9.93e-04 | 101 |
| GO:190331110 | Endometrium | AEH | regulation of mRNA metabolic process | 77/2100 | 288/18723 | 1.69e-13 | 4.40e-11 | 77 |
| GO:000640210 | Endometrium | AEH | mRNA catabolic process | 59/2100 | 232/18723 | 9.51e-10 | 8.52e-08 | 59 |
| GO:000640110 | Endometrium | AEH | RNA catabolic process | 63/2100 | 278/18723 | 3.28e-08 | 1.87e-06 | 63 |
| GO:006101310 | Endometrium | AEH | regulation of mRNA catabolic process | 39/2100 | 166/18723 | 5.21e-06 | 1.33e-04 | 39 |
| GO:004348810 | Endometrium | AEH | regulation of mRNA stability | 37/2100 | 158/18723 | 9.73e-06 | 2.24e-04 | 37 |
| GO:003465510 | Endometrium | AEH | nucleobase-containing compound catabolic process | 74/2100 | 407/18723 | 1.78e-05 | 3.65e-04 | 74 |
| GO:004427010 | Endometrium | AEH | cellular nitrogen compound catabolic process | 80/2100 | 451/18723 | 2.09e-05 | 4.13e-04 | 80 |
| GO:00467009 | Endometrium | AEH | heterocycle catabolic process | 79/2100 | 445/18723 | 2.27e-05 | 4.35e-04 | 79 |
| GO:004348710 | Endometrium | AEH | regulation of RNA stability | 38/2100 | 170/18723 | 2.30e-05 | 4.38e-04 | 38 |
| Page: 1 2 3 4 5 6 7 8 9 10 |
| Pathway ID | Tissue | Disease Stage | Description | Gene Ratio | Bg Ratio | pvalue | p.adjust | qvalue | Count |
| Page: 1 |
Top |
Cell-cell communication analysis |
| Identification of potential cell-cell interactions between two cell types and their ligand-receptor pairs for different disease states |
| Ligand | Receptor | LRpair | Pathway | Tissue | Disease Stage |
| Page: 1 |
Top |
Single-cell gene regulatory network inference analysis |
| Find out the significant the regulons (TFs) and the target genes of each regulon across cell types for different disease states |
| TF | Cell Type | Tissue | Disease Stage | Target Gene | RSS | Regulon Activity |
| ∗The dot plots of a searched regulon are shown for all cell subpopulations in each disease state of each tissue based on the regulon specific score inferred using pySCENIC and by calculating the average expression. |
| Page: 1 |
Top |
Somatic mutation of malignant transformation related genes |
| Annotation of somatic variants for genes involved in malignant transformation |
| Hugo Symbol | Variant Class | Variant Classification | dbSNP RS | HGVSc | HGVSp | HGVSp Short | SWISSPROT | BIOTYPE | SIFT | PolyPhen | Tumor Sample Barcode | Tissue | Histology | Sex | Age | Stage | Therapy Types | Drugs | Outcome |
| CARHSP1 | SNV | Missense_Mutation | rs201523233 | c.316N>A | p.Glu106Lys | p.E106K | Q9Y2V2 | protein_coding | deleterious(0.03) | possibly_damaging(0.58) | TCGA-5L-AAT1-01 | Breast | breast invasive carcinoma | Female | <65 | III/IV | Hormone Therapy | letrozol | SD |
| CARHSP1 | SNV | Missense_Mutation | rs770141066 | c.73N>T | p.Arg25Trp | p.R25W | Q9Y2V2 | protein_coding | tolerated(0.07) | possibly_damaging(0.652) | TCGA-MA-AA41-01 | Cervix | cervical & endocervical cancer | Female | <65 | I/II | Unknown | Unknown | SD |
| CARHSP1 | SNV | Missense_Mutation | rs368130205 | c.79N>T | p.Arg27Cys | p.R27C | Q9Y2V2 | protein_coding | deleterious(0) | benign(0.18) | TCGA-AD-6964-01 | Colorectum | colon adenocarcinoma | Male | <65 | III/IV | Chemotherapy | folfox | PD |
| CARHSP1 | deletion | Frame_Shift_Del | c.258delC | p.Asp87ThrfsTer140 | p.D87Tfs*140 | Q9Y2V2 | protein_coding | TCGA-CK-4951-01 | Colorectum | colon adenocarcinoma | Female | >=65 | I/II | Unknown | Unknown | PD | |||
| CARHSP1 | SNV | Missense_Mutation | rs201523233 | c.316N>A | p.Glu106Lys | p.E106K | Q9Y2V2 | protein_coding | deleterious(0.03) | possibly_damaging(0.58) | TCGA-A5-A2K3-01 | Endometrium | uterine corpus endometrioid carcinoma | Female | >=65 | I/II | Chemotherapy | carboplatin | SD |
| CARHSP1 | SNV | Missense_Mutation | c.281N>C | p.Asp94Ala | p.D94A | Q9Y2V2 | protein_coding | deleterious(0) | probably_damaging(1) | TCGA-D1-A17D-01 | Endometrium | uterine corpus endometrioid carcinoma | Female | <65 | I/II | Chemotherapy | carboplatin | SD | |
| CARHSP1 | SNV | Missense_Mutation | rs201523233 | c.316N>A | p.Glu106Lys | p.E106K | Q9Y2V2 | protein_coding | deleterious(0.03) | possibly_damaging(0.58) | TCGA-FI-A2D0-01 | Endometrium | uterine corpus endometrioid carcinoma | Female | <65 | I/II | Unknown | Unknown | SD |
| CARHSP1 | SNV | Missense_Mutation | c.8N>G | p.Ser3Cys | p.S3C | Q9Y2V2 | protein_coding | deleterious_low_confidence(0) | benign(0.358) | TCGA-18-4083-01 | Lung | lung squamous cell carcinoma | Male | <65 | I/II | Chemotherapy | cisplatin | SD | |
| CARHSP1 | deletion | Frame_Shift_Del | novel | c.296_299delNNNN | p.Tyr99SerfsTer127 | p.Y99Sfs*127 | Q9Y2V2 | protein_coding | TCGA-TP-A8TT-01 | Prostate | prostate adenocarcinoma | Male | <65 | 7 | Unknown | Unknown | SD | ||
| CARHSP1 | SNV | Missense_Mutation | rs201523233 | c.316N>A | p.Glu106Lys | p.E106K | Q9Y2V2 | protein_coding | deleterious(0.03) | possibly_damaging(0.58) | TCGA-BR-4371-01 | Stomach | stomach adenocarcinoma | Female | >=65 | I/II | Unknown | Unknown | SD |
| Page: 1 2 |
Top |
Related drugs of malignant transformation related genes |
| Identification of chemicals and drugs interact with genes involved in malignant transfromation |
| (DGIdb 4.0) |
| Entrez ID | Symbol | Category | Interaction Types | Drug Claim Name | Drug Name | PMIDs |
| Page: 1 |

Copyright 2023-Present -The University of Texas Health Science Center at Houston |