
|
|||||
|
 | |
| |
| |
| |
| |
| |
|
Gene: C6orf89 |
Gene summary for C6ORF89 |
| Gene information | Species | Human | Gene symbol | C6orf89 | Gene ID | 221477 |
| Gene name | chromosome 6 open reading frame 89 | |
| Gene Alias | BRAP | |
| Cytomap | 6p21.2 | |
| Gene Type | protein-coding | GO ID | GO:0006464 | UniProtAcc | A0A024RCY0 |
Top |
Malignant transformation analysis |
| Identification of the aberrant gene expression in precancerous and cancerous lesions by comparing the gene expression of stem-like cells in diseased tissues with normal stem cells |
| Entrez ID | Symbol | Replicates | Species | Organ | Tissue | Adj P-value | Log2FC | Malignancy |
| 221477 | C6orf89 | LZE2T | Human | Esophagus | ESCC | 1.59e-04 | 7.28e-01 | 0.082 |
| 221477 | C6orf89 | LZE4T | Human | Esophagus | ESCC | 4.93e-12 | 3.68e-01 | 0.0811 |
| 221477 | C6orf89 | LZE7T | Human | Esophagus | ESCC | 1.30e-04 | 2.78e-01 | 0.0667 |
| 221477 | C6orf89 | LZE8T | Human | Esophagus | ESCC | 3.06e-11 | 3.45e-01 | 0.067 |
| 221477 | C6orf89 | LZE20T | Human | Esophagus | ESCC | 5.01e-09 | 4.54e-01 | 0.0662 |
| 221477 | C6orf89 | LZE22T | Human | Esophagus | ESCC | 1.66e-02 | 2.19e-01 | 0.068 |
| 221477 | C6orf89 | LZE24T | Human | Esophagus | ESCC | 3.44e-22 | 5.50e-01 | 0.0596 |
| 221477 | C6orf89 | LZE6T | Human | Esophagus | ESCC | 4.60e-05 | 1.77e-01 | 0.0845 |
| 221477 | C6orf89 | P1T-E | Human | Esophagus | ESCC | 3.16e-08 | 4.81e-01 | 0.0875 |
| 221477 | C6orf89 | P2T-E | Human | Esophagus | ESCC | 3.03e-45 | 7.72e-01 | 0.1177 |
| 221477 | C6orf89 | P4T-E | Human | Esophagus | ESCC | 6.00e-25 | 5.74e-01 | 0.1323 |
| 221477 | C6orf89 | P5T-E | Human | Esophagus | ESCC | 2.55e-13 | 3.81e-01 | 0.1327 |
| 221477 | C6orf89 | P8T-E | Human | Esophagus | ESCC | 5.15e-23 | 4.66e-01 | 0.0889 |
| 221477 | C6orf89 | P9T-E | Human | Esophagus | ESCC | 5.01e-13 | 2.90e-01 | 0.1131 |
| 221477 | C6orf89 | P10T-E | Human | Esophagus | ESCC | 1.06e-25 | 4.08e-01 | 0.116 |
| 221477 | C6orf89 | P11T-E | Human | Esophagus | ESCC | 1.55e-20 | 8.50e-01 | 0.1426 |
| 221477 | C6orf89 | P12T-E | Human | Esophagus | ESCC | 2.20e-22 | 4.38e-01 | 0.1122 |
| 221477 | C6orf89 | P15T-E | Human | Esophagus | ESCC | 4.43e-28 | 5.77e-01 | 0.1149 |
| 221477 | C6orf89 | P16T-E | Human | Esophagus | ESCC | 2.11e-23 | 4.81e-01 | 0.1153 |
| 221477 | C6orf89 | P17T-E | Human | Esophagus | ESCC | 2.68e-13 | 6.70e-01 | 0.1278 |
| Page: 1 2 3 4 5 6 7 |
| Tissue | Expression Dynamics | Abbreviation |
| Esophagus | 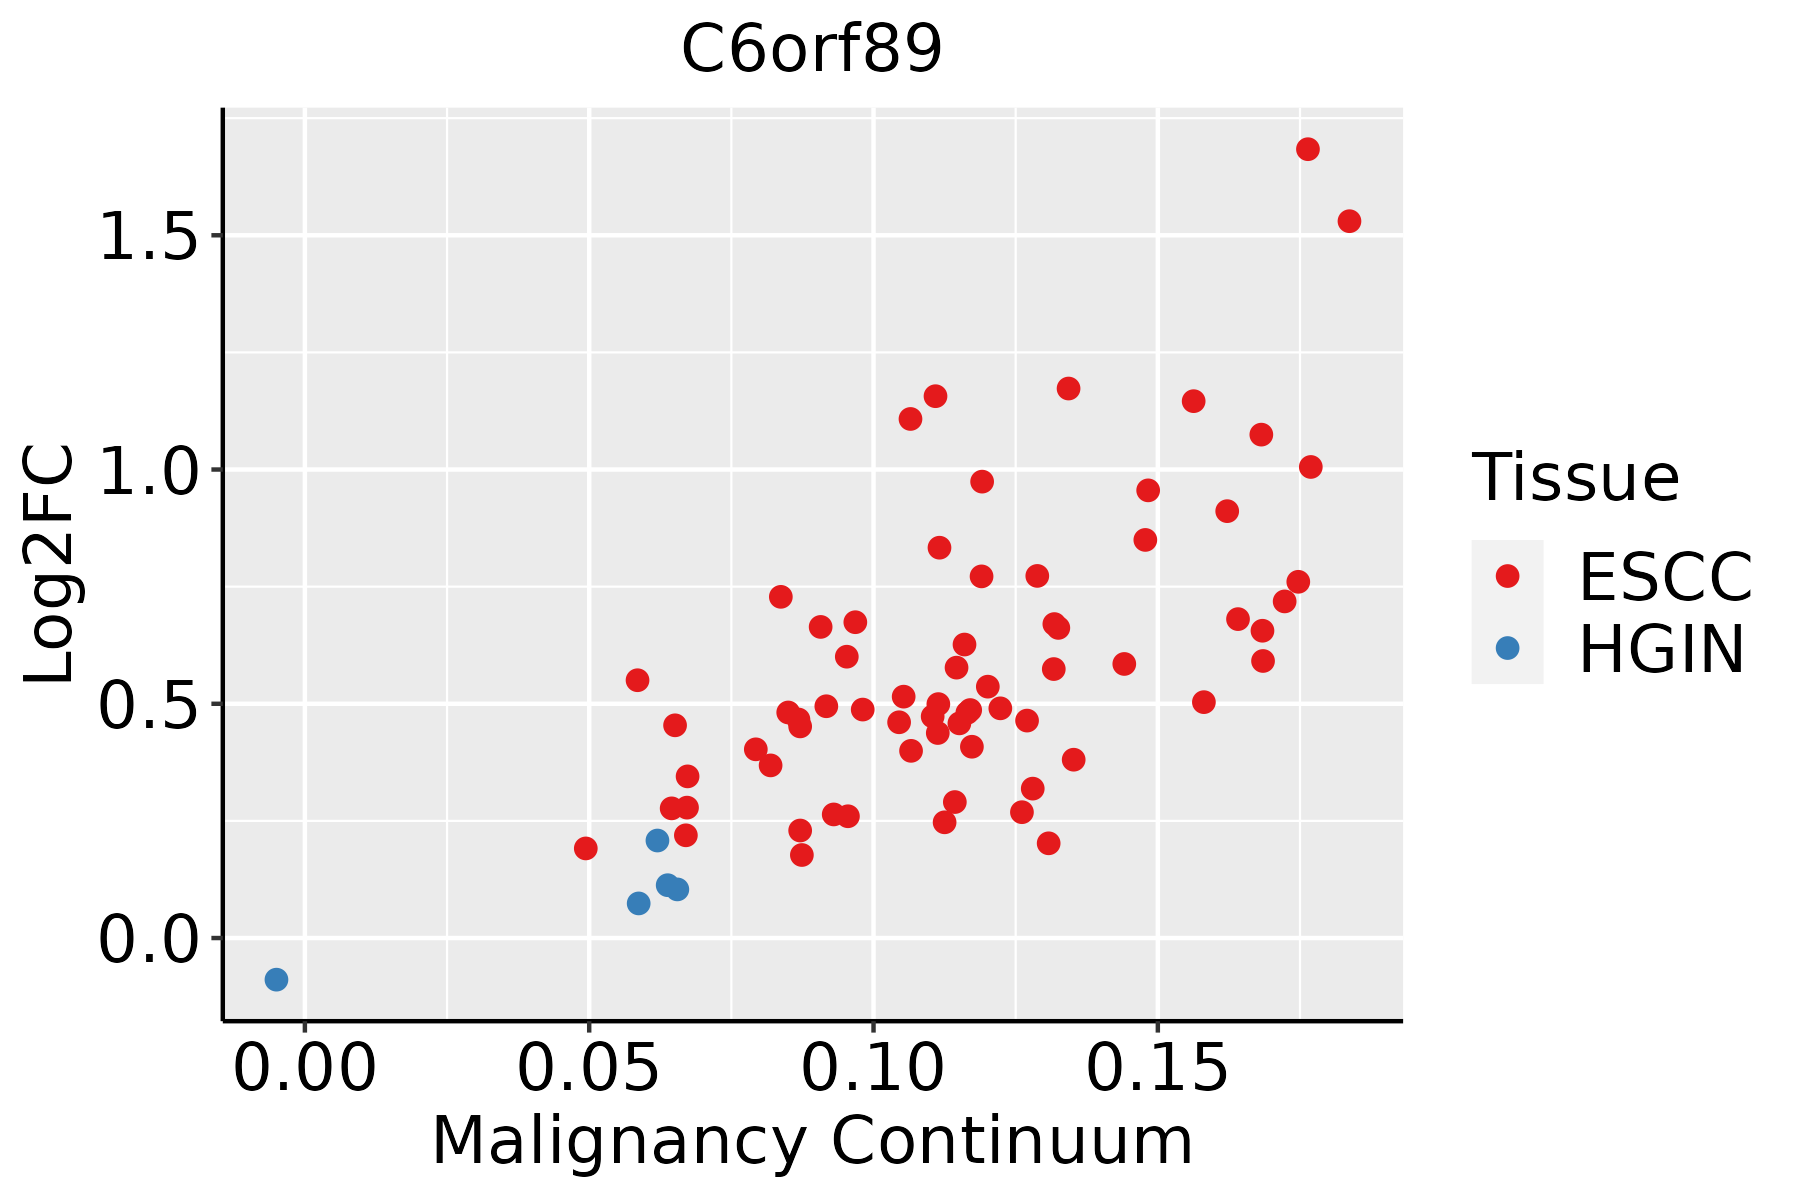 | ESCC: Esophageal squamous cell carcinoma |
| HGIN: High-grade intraepithelial neoplasias | ||
| LGIN: Low-grade intraepithelial neoplasias | ||
| Liver | 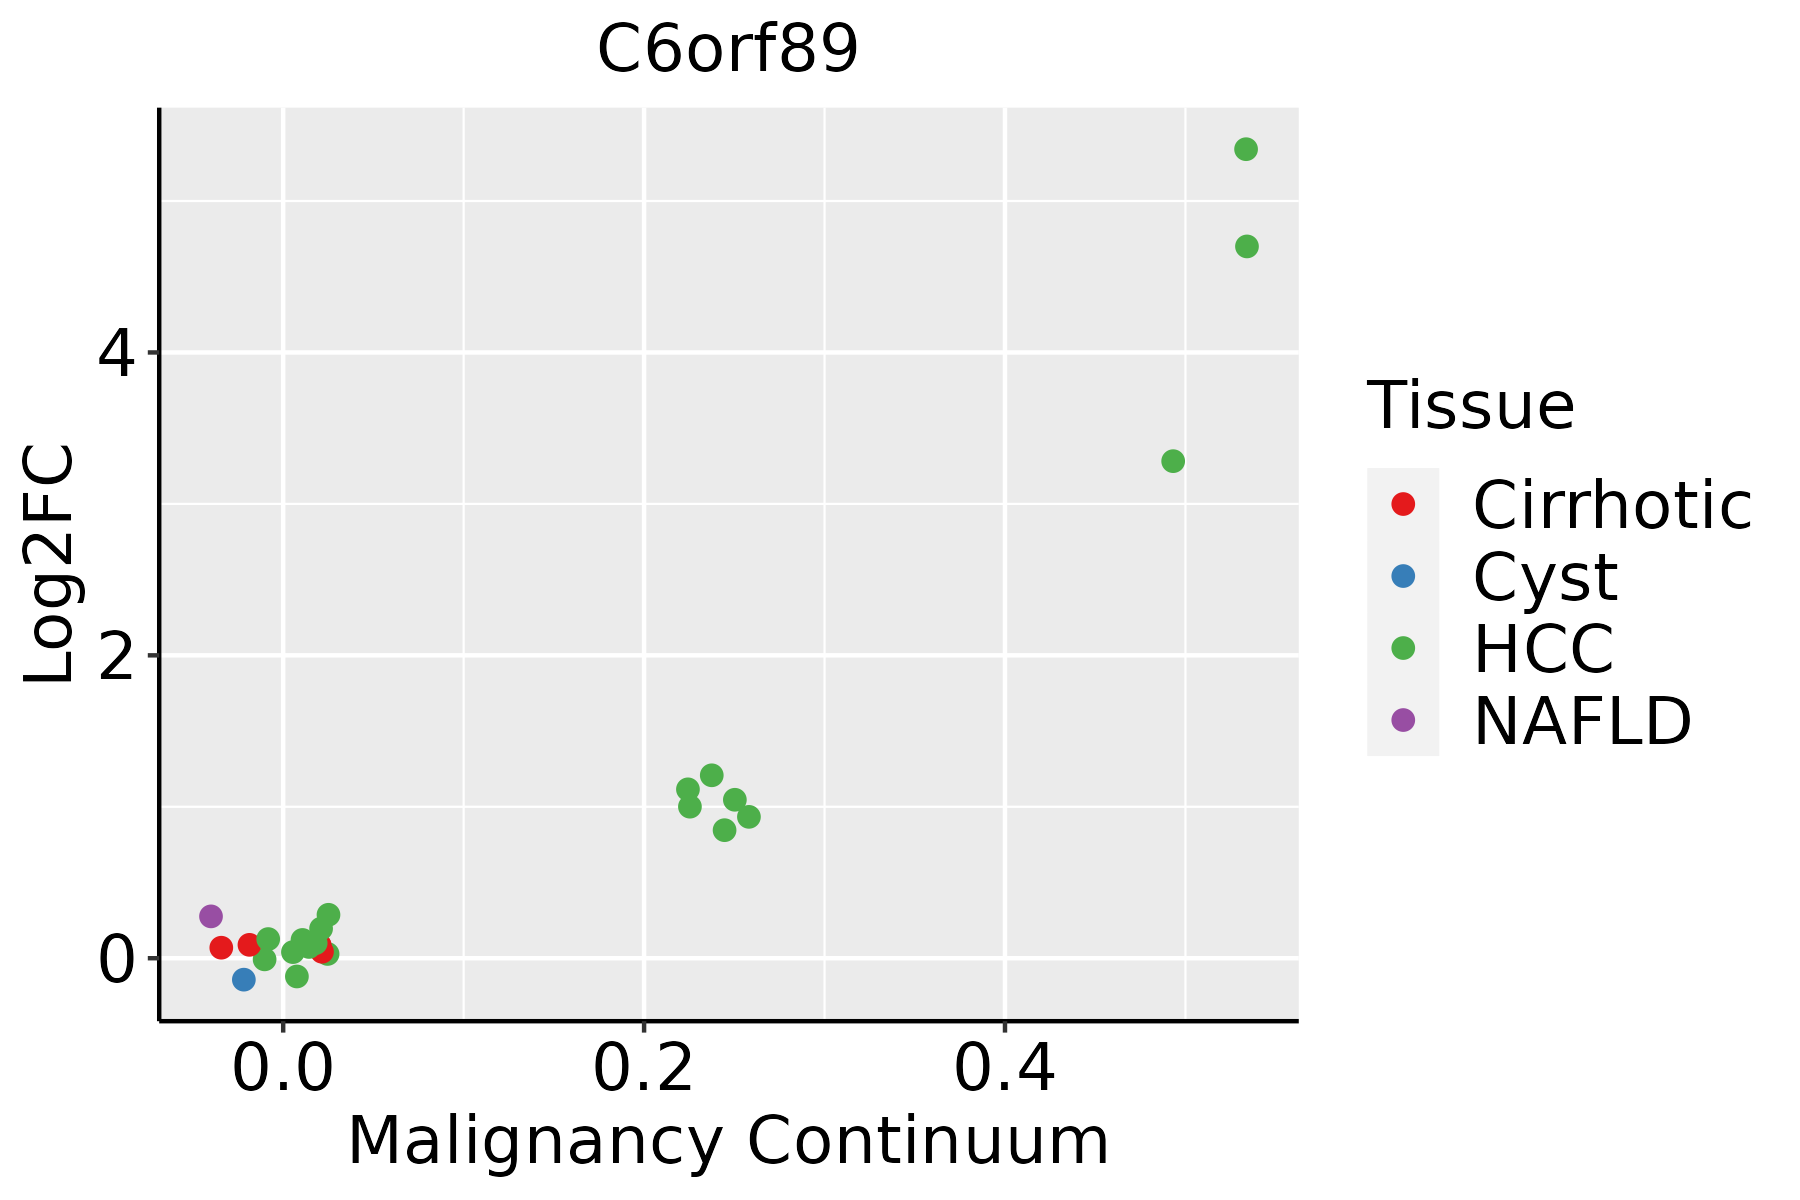 | HCC: Hepatocellular carcinoma |
| NAFLD: Non-alcoholic fatty liver disease | ||
| Oral Cavity |  | EOLP: Erosive Oral lichen planus |
| LP: leukoplakia | ||
| NEOLP: Non-erosive oral lichen planus | ||
| OSCC: Oral squamous cell carcinoma | ||
| Prostate | 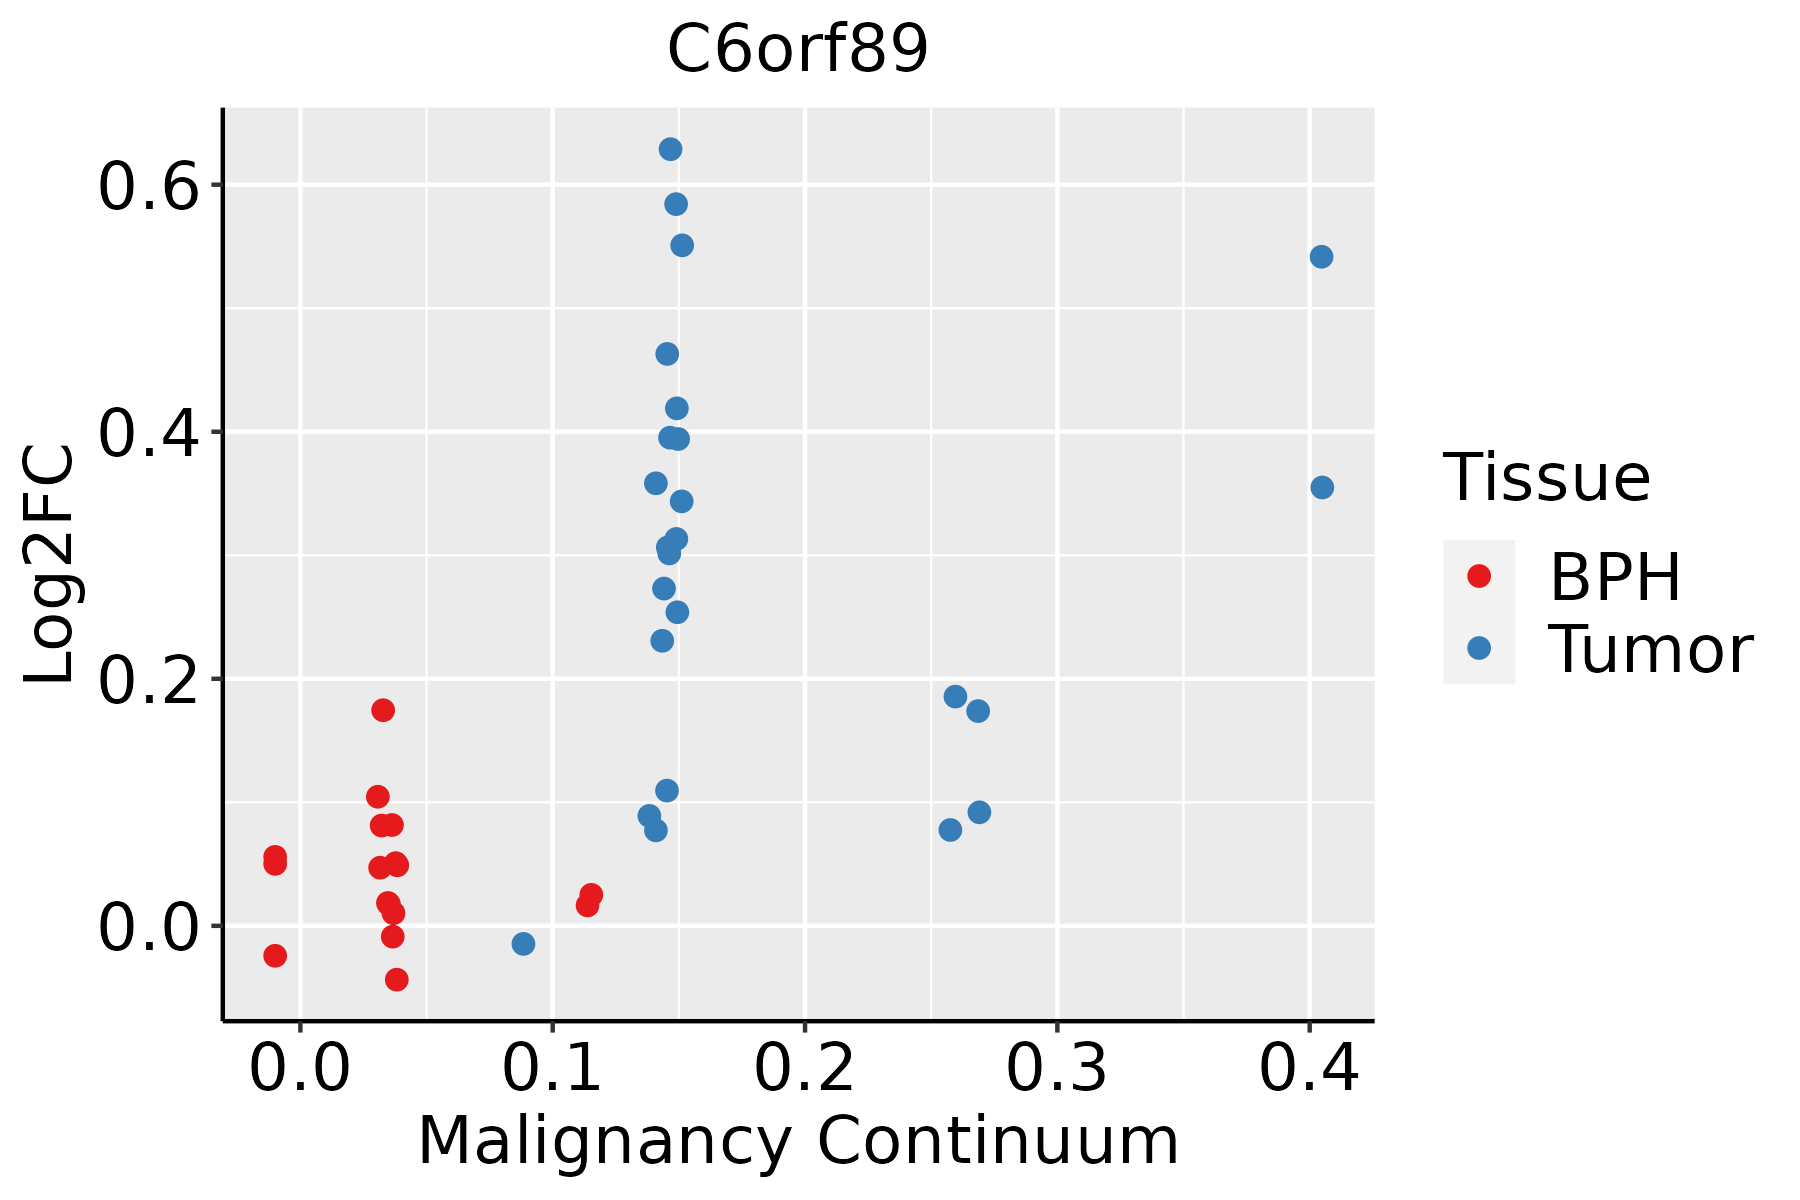 | BPH: Benign Prostatic Hyperplasia |
| Skin | 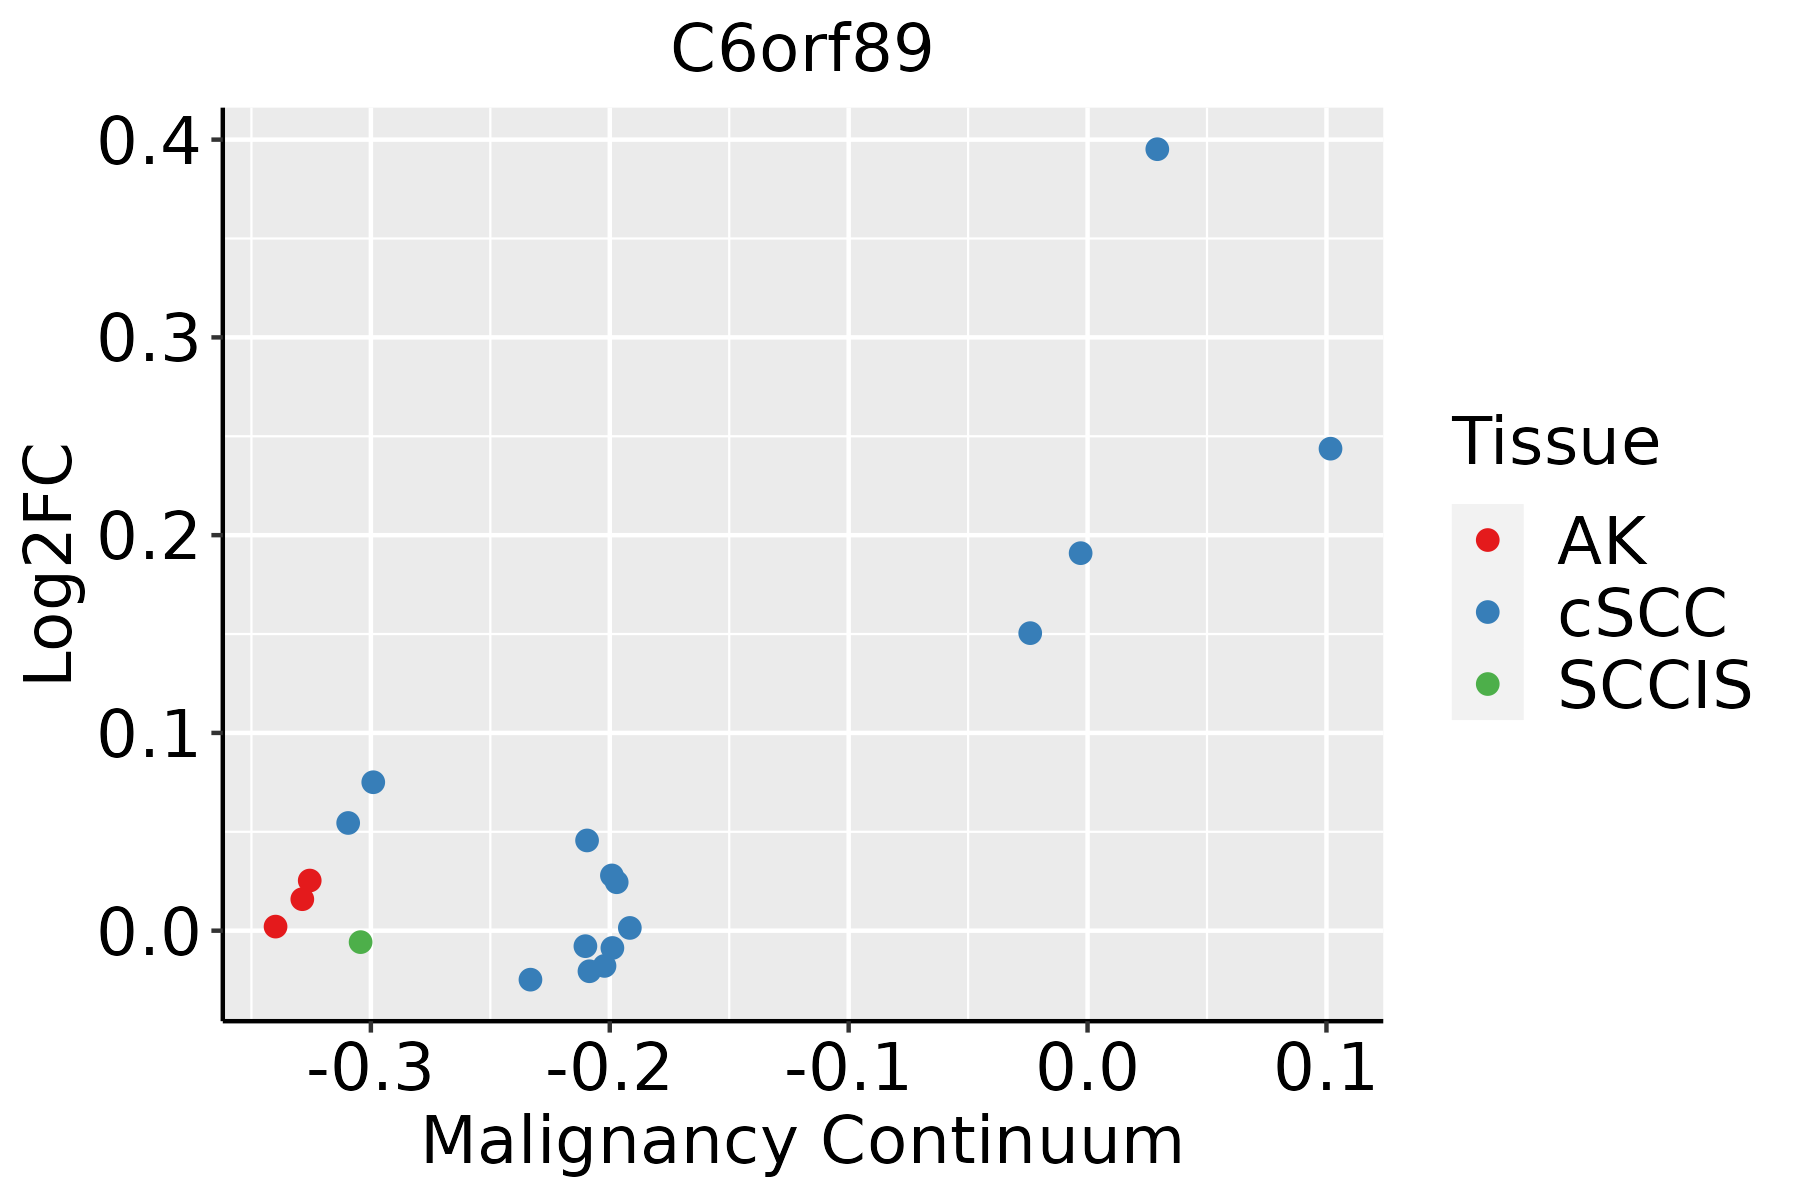 | AK: Actinic keratosis |
| cSCC: Cutaneous squamous cell carcinoma | ||
| SCCIS:squamous cell carcinoma in situ | ||
| Thyroid | 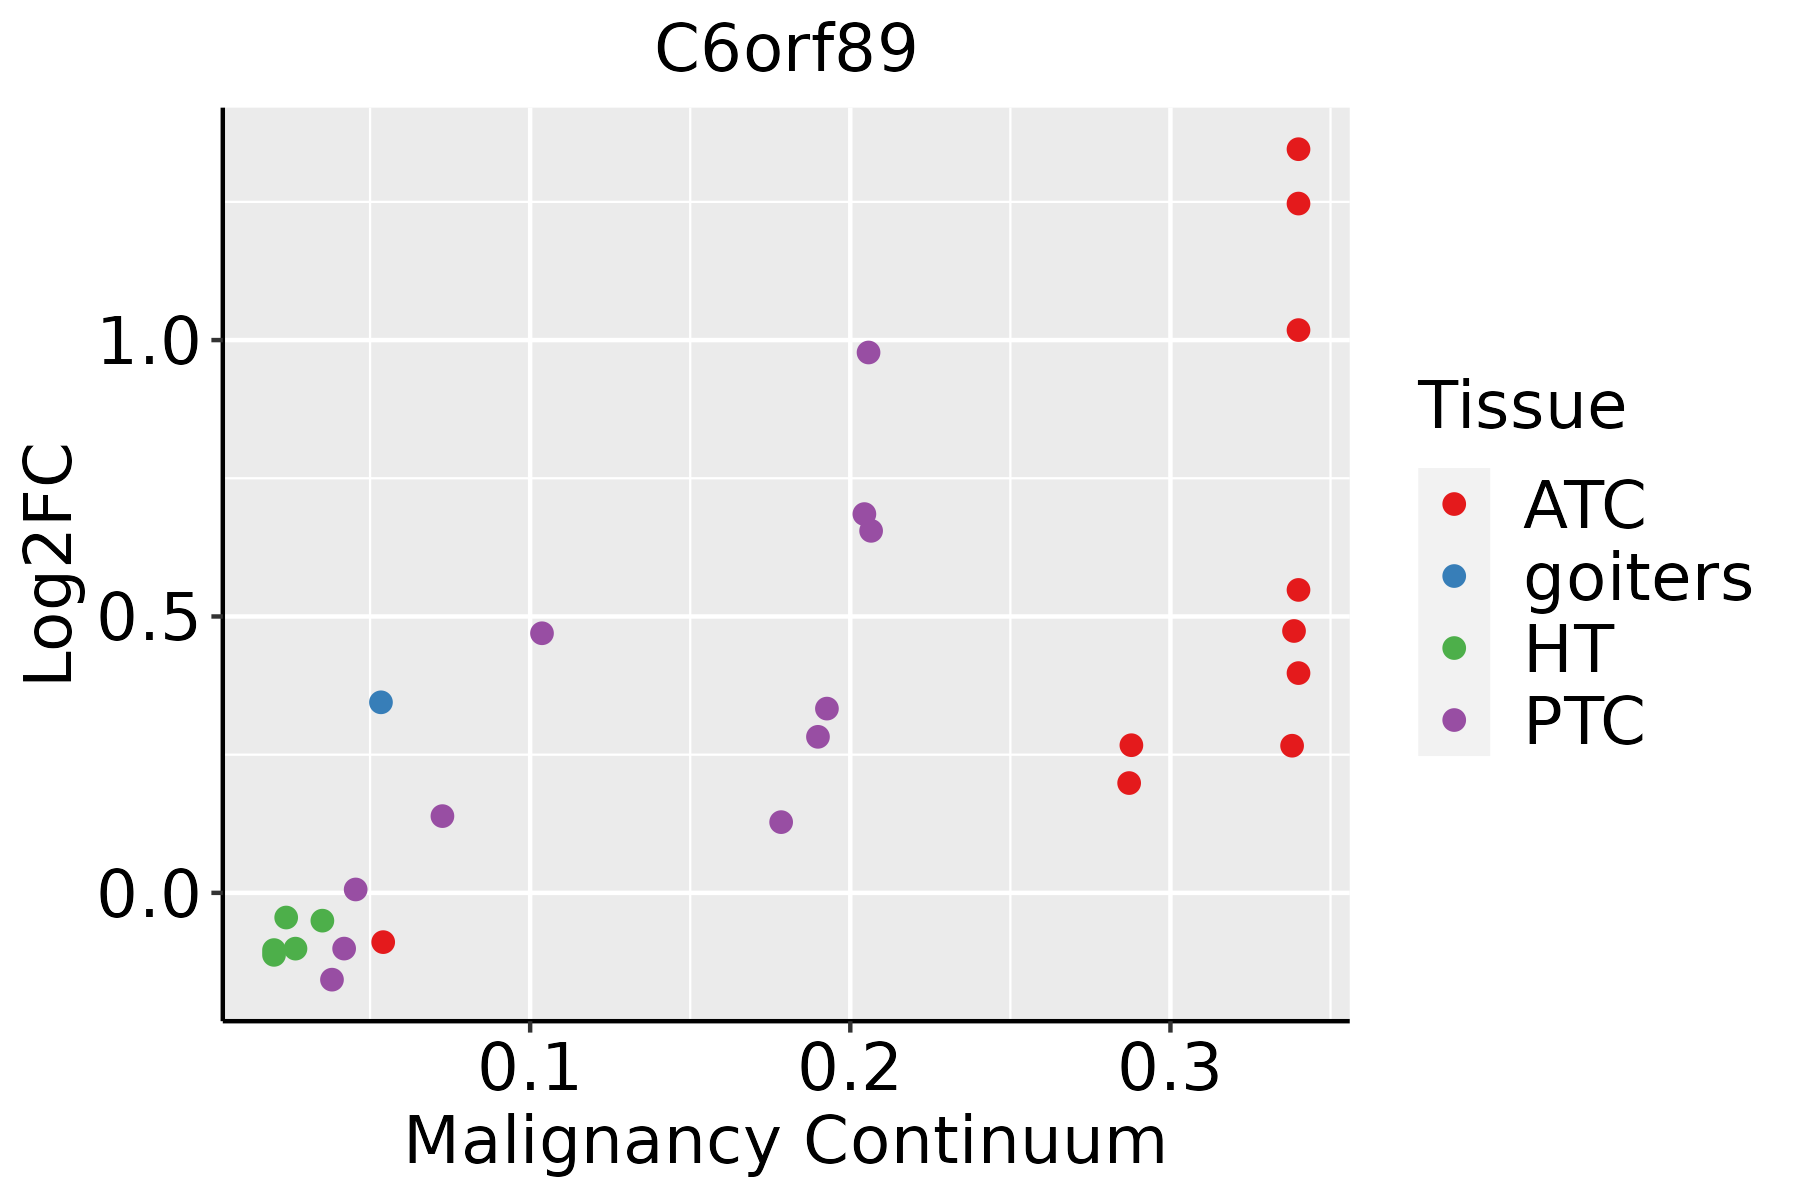 | ATC: Anaplastic thyroid cancer |
| HT: Hashimoto's thyroiditis | ||
| PTC: Papillary thyroid cancer |
| ∗log2FC in expression of this searched gene in stem-like cells from each diseased tissue sample relative to stem-like cells in normal samples in each tissue plotted against the malignancy continuum. Samples are colored based on if they are from different disease stage. |
Top |
Malignant transformation related pathway analysis |
| Find out the enriched GO biological processes and KEGG pathways involved in transition from healthy to precancer to cancer |
| Tissue | Disease Stage | Enriched GO biological Processes |
| Colorectum | AD |  |
| Colorectum | SER |  |
| Colorectum | MSS |  |
| Colorectum | MSI-H |  |
| Colorectum | FAP |  |
| ∗Top 15 enriched GO BP terms are showed in the bar plot of each disease state in each tissue. Each row represents a significant GO biological process which is colored according to the -log10(p.adjust). |
| Page: 1 2 3 4 5 6 7 8 9 |
| GO ID | Tissue | Disease Stage | Description | Gene Ratio | Bg Ratio | pvalue | p.adjust | Count |
| GO:009873211 | Prostate | Tumor | macromolecule deacylation | 33/3246 | 116/18723 | 2.00e-03 | 1.16e-02 | 33 |
| GO:00165752 | Prostate | Tumor | histone deacetylation | 23/3246 | 82/18723 | 1.07e-02 | 4.42e-02 | 23 |
| GO:001657024 | Skin | cSCC | histone modification | 179/4864 | 463/18723 | 9.65e-10 | 3.74e-08 | 179 |
| GO:003105615 | Skin | cSCC | regulation of histone modification | 68/4864 | 152/18723 | 4.07e-07 | 7.93e-06 | 68 |
| GO:004578717 | Skin | cSCC | positive regulation of cell cycle | 120/4864 | 313/18723 | 8.95e-07 | 1.64e-05 | 120 |
| GO:00310584 | Skin | cSCC | positive regulation of histone modification | 45/4864 | 92/18723 | 1.92e-06 | 3.17e-05 | 45 |
| GO:004206029 | Skin | cSCC | wound healing | 152/4864 | 422/18723 | 2.66e-06 | 4.26e-05 | 152 |
| GO:00165755 | Skin | cSCC | histone deacetylation | 40/4864 | 82/18723 | 7.62e-06 | 1.04e-04 | 40 |
| GO:00903123 | Skin | cSCC | positive regulation of protein deacetylation | 17/4864 | 25/18723 | 1.27e-05 | 1.60e-04 | 17 |
| GO:00356016 | Skin | cSCC | protein deacylation | 50/4864 | 112/18723 | 1.42e-05 | 1.77e-04 | 50 |
| GO:00064766 | Skin | cSCC | protein deacetylation | 45/4864 | 101/18723 | 3.97e-05 | 4.26e-04 | 45 |
| GO:00987326 | Skin | cSCC | macromolecule deacylation | 50/4864 | 116/18723 | 4.47e-05 | 4.69e-04 | 50 |
| GO:00310653 | Skin | cSCC | positive regulation of histone deacetylation | 13/4864 | 19/18723 | 1.27e-04 | 1.16e-03 | 13 |
| GO:00310632 | Skin | cSCC | regulation of histone deacetylation | 17/4864 | 31/18723 | 5.90e-04 | 4.27e-03 | 17 |
| GO:005067324 | Skin | cSCC | epithelial cell proliferation | 144/4864 | 437/18723 | 6.07e-04 | 4.38e-03 | 144 |
| GO:00903115 | Skin | cSCC | regulation of protein deacetylation | 22/4864 | 48/18723 | 2.31e-03 | 1.35e-02 | 22 |
| GO:001657010 | Thyroid | PTC | histone modification | 235/5968 | 463/18723 | 1.17e-17 | 1.15e-15 | 235 |
| GO:003105610 | Thyroid | PTC | regulation of histone modification | 83/5968 | 152/18723 | 5.19e-09 | 1.34e-07 | 83 |
| GO:0042060112 | Thyroid | PTC | wound healing | 190/5968 | 422/18723 | 7.72e-09 | 1.92e-07 | 190 |
| GO:004578718 | Thyroid | PTC | positive regulation of cell cycle | 144/5968 | 313/18723 | 9.93e-08 | 1.99e-06 | 144 |
| Page: 1 2 3 4 5 |
| Pathway ID | Tissue | Disease Stage | Description | Gene Ratio | Bg Ratio | pvalue | p.adjust | qvalue | Count |
| Page: 1 |
Top |
Cell-cell communication analysis |
| Identification of potential cell-cell interactions between two cell types and their ligand-receptor pairs for different disease states |
| Ligand | Receptor | LRpair | Pathway | Tissue | Disease Stage |
| Page: 1 |
Top |
Single-cell gene regulatory network inference analysis |
| Find out the significant the regulons (TFs) and the target genes of each regulon across cell types for different disease states |
| TF | Cell Type | Tissue | Disease Stage | Target Gene | RSS | Regulon Activity |
| ∗The dot plots of a searched regulon are shown for all cell subpopulations in each disease state of each tissue based on the regulon specific score inferred using pySCENIC and by calculating the average expression. |
| Page: 1 |
Top |
Somatic mutation of malignant transformation related genes |
| Annotation of somatic variants for genes involved in malignant transformation |
| Hugo Symbol | Variant Class | Variant Classification | dbSNP RS | HGVSc | HGVSp | HGVSp Short | SWISSPROT | BIOTYPE | SIFT | PolyPhen | Tumor Sample Barcode | Tissue | Histology | Sex | Age | Stage | Therapy Types | Drugs | Outcome |
| C6orf89 | SNV | Missense_Mutation | rs143348146 | c.748N>T | p.Arg250Cys | p.R250C | Q6UWU4 | protein_coding | deleterious(0) | possibly_damaging(0.736) | TCGA-A2-A0YJ-01 | Breast | breast invasive carcinoma | Female | <65 | III/IV | Chemotherapy | cytoxan | PD |
| C6orf89 | SNV | Missense_Mutation | c.655N>A | p.Gly219Arg | p.G219R | Q6UWU4 | protein_coding | tolerated(0.08) | benign(0.441) | TCGA-AO-A124-01 | Breast | breast invasive carcinoma | Female | <65 | I/II | Chemotherapy | doxorubicin | SD | |
| C6orf89 | SNV | Missense_Mutation | c.772N>G | p.His258Asp | p.H258D | Q6UWU4 | protein_coding | tolerated(0.21) | benign(0.023) | TCGA-D8-A27F-01 | Breast | breast invasive carcinoma | Female | <65 | I/II | Chemotherapy | adriamycin+cyclophosphamide | SD | |
| C6orf89 | SNV | Missense_Mutation | rs779924954 | c.218N>A | p.Ala73Glu | p.A73E | Q6UWU4 | protein_coding | deleterious(0) | benign(0.086) | TCGA-ZJ-AAXU-01 | Cervix | cervical & endocervical cancer | Female | <65 | I/II | Unknown | Unknown | SD |
| C6orf89 | SNV | Missense_Mutation | c.353N>G | p.Ile118Ser | p.I118S | Q6UWU4 | protein_coding | deleterious(0) | probably_damaging(0.998) | TCGA-AA-3811-01 | Colorectum | colon adenocarcinoma | Female | >=65 | III/IV | Unknown | Unknown | PD | |
| C6orf89 | SNV | Missense_Mutation | rs79686273 | c.979N>A | p.Asp327Asn | p.D327N | Q6UWU4 | protein_coding | tolerated(0.85) | benign(0.001) | TCGA-AA-3984-01 | Colorectum | colon adenocarcinoma | Female | <65 | I/II | Unknown | Unknown | SD |
| C6orf89 | SNV | Missense_Mutation | rs751486634 | c.923N>A | p.Arg308Gln | p.R308Q | Q6UWU4 | protein_coding | tolerated(0.33) | possibly_damaging(0.525) | TCGA-AG-A002-01 | Colorectum | rectum adenocarcinoma | Male | <65 | I/II | Unknown | Unknown | SD |
| C6orf89 | SNV | Missense_Mutation | rs571648523 | c.313N>T | p.Arg105Cys | p.R105C | Q6UWU4 | protein_coding | tolerated(0.13) | benign(0.007) | TCGA-EI-6882-01 | Colorectum | rectum adenocarcinoma | Male | <65 | I/II | Unknown | Unknown | SD |
| C6orf89 | SNV | Missense_Mutation | novel | c.664N>C | p.Ala222Pro | p.A222P | Q6UWU4 | protein_coding | tolerated(0.06) | benign(0.417) | TCGA-A5-A0G2-01 | Endometrium | uterine corpus endometrioid carcinoma | Female | <65 | III/IV | Unknown | Unknown | SD |
| C6orf89 | SNV | Missense_Mutation | novel | c.794N>T | p.Ala265Val | p.A265V | Q6UWU4 | protein_coding | tolerated(0.69) | benign(0.015) | TCGA-AP-A1DK-01 | Endometrium | uterine corpus endometrioid carcinoma | Female | <65 | I/II | Unknown | Unknown | SD |
| Page: 1 2 3 4 |
Top |
Related drugs of malignant transformation related genes |
| Identification of chemicals and drugs interact with genes involved in malignant transfromation |
| (DGIdb 4.0) |
| Entrez ID | Symbol | Category | Interaction Types | Drug Claim Name | Drug Name | PMIDs |
| Page: 1 |

Copyright 2023-Present -The University of Texas Health Science Center at Houston |