
|
|||||
|
 | |
| |
| |
| |
| |
| |
|
Gene: BICD1 |
Gene summary for BICD1 |
| Gene information | Species | Human | Gene symbol | BICD1 | Gene ID | 636 |
| Gene name | BICD cargo adaptor 1 | |
| Gene Alias | BICD | |
| Cytomap | 12p11.21 | |
| Gene Type | protein-coding | GO ID | GO:0000226 | UniProtAcc | Q96G01 |
Top |
Malignant transformation analysis |
| Identification of the aberrant gene expression in precancerous and cancerous lesions by comparing the gene expression of stem-like cells in diseased tissues with normal stem cells |
| Entrez ID | Symbol | Replicates | Species | Organ | Tissue | Adj P-value | Log2FC | Malignancy |
| 636 | BICD1 | HTA11_1391_2000001011 | Human | Colorectum | AD | 3.29e-05 | 5.53e-01 | -0.059 |
| 636 | BICD1 | HTA11_7696_3000711011 | Human | Colorectum | AD | 2.94e-06 | 3.01e-01 | 0.0674 |
| 636 | BICD1 | HTA11_99999965062_69753 | Human | Colorectum | MSI-H | 3.88e-06 | 1.25e+00 | 0.3487 |
| 636 | BICD1 | HTA11_99999974143_84620 | Human | Colorectum | MSS | 1.95e-03 | 2.81e-01 | 0.3005 |
| 636 | BICD1 | A002-C-203 | Human | Colorectum | FAP | 5.56e-03 | 4.10e-01 | 0.2786 |
| 636 | BICD1 | CRC-1-8810 | Human | Colorectum | CRC | 4.42e-06 | 4.55e-01 | 0.6257 |
| 636 | BICD1 | AEH-subject1 | Human | Endometrium | AEH | 1.55e-29 | 7.17e-01 | -0.3059 |
| 636 | BICD1 | AEH-subject2 | Human | Endometrium | AEH | 5.14e-05 | 2.49e-01 | -0.2525 |
| 636 | BICD1 | EEC-subject1 | Human | Endometrium | EEC | 9.66e-19 | 5.88e-01 | -0.2682 |
| 636 | BICD1 | EEC-subject3 | Human | Endometrium | EEC | 1.46e-10 | 2.18e-01 | -0.2525 |
| 636 | BICD1 | EEC-subject5 | Human | Endometrium | EEC | 1.35e-10 | 4.36e-01 | -0.249 |
| 636 | BICD1 | GSM6177620_NYU_UCEC1_lib1_lib1 | Human | Endometrium | EEC | 1.58e-08 | -3.37e-02 | -0.1869 |
| 636 | BICD1 | GSM6177620_NYU_UCEC1_lib2_lib2 | Human | Endometrium | EEC | 2.59e-07 | -4.26e-02 | -0.1875 |
| 636 | BICD1 | GSM6177620_NYU_UCEC1_lib3_lib3 | Human | Endometrium | EEC | 9.35e-11 | -6.70e-02 | -0.1883 |
| 636 | BICD1 | GSM6177621_NYU_UCEC2_lib1_lib1 | Human | Endometrium | EEC | 5.85e-10 | -2.08e-01 | -0.1934 |
| 636 | BICD1 | GSM6177622_NYU_UCEC3_lib1_lib1 | Human | Endometrium | EEC | 5.84e-12 | -1.98e-01 | -0.1917 |
| 636 | BICD1 | GSM6177622_NYU_UCEC3_lib2_lib2 | Human | Endometrium | EEC | 6.08e-13 | -1.51e-01 | -0.1916 |
| 636 | BICD1 | LZE4T | Human | Esophagus | ESCC | 1.15e-07 | 2.17e-01 | 0.0811 |
| 636 | BICD1 | LZE7T | Human | Esophagus | ESCC | 1.01e-06 | 3.90e-01 | 0.0667 |
| 636 | BICD1 | LZE20T | Human | Esophagus | ESCC | 4.34e-03 | 1.40e-01 | 0.0662 |
| Page: 1 2 3 4 5 6 |
| Tissue | Expression Dynamics | Abbreviation |
| Colorectum (GSE201348) | 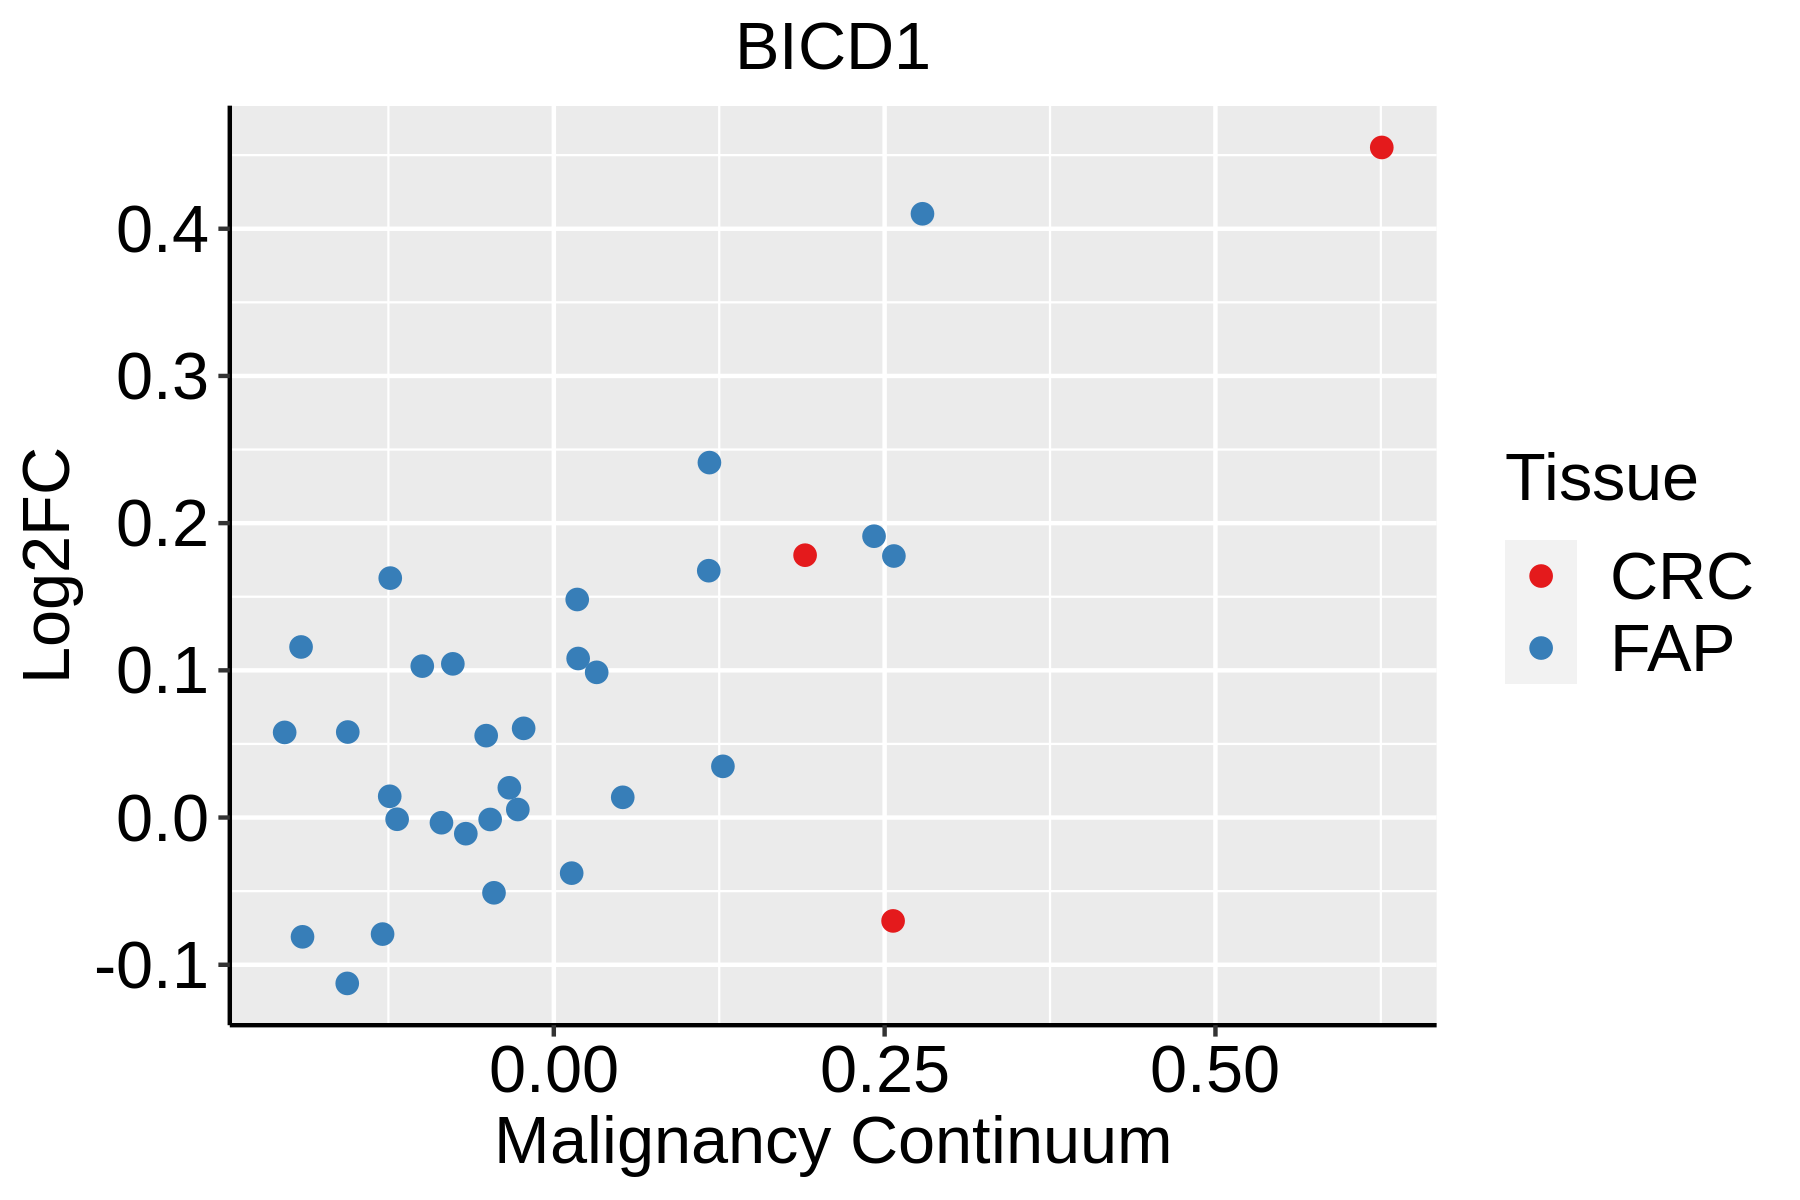 | FAP: Familial adenomatous polyposis |
| CRC: Colorectal cancer | ||
| Colorectum (HTA11) | 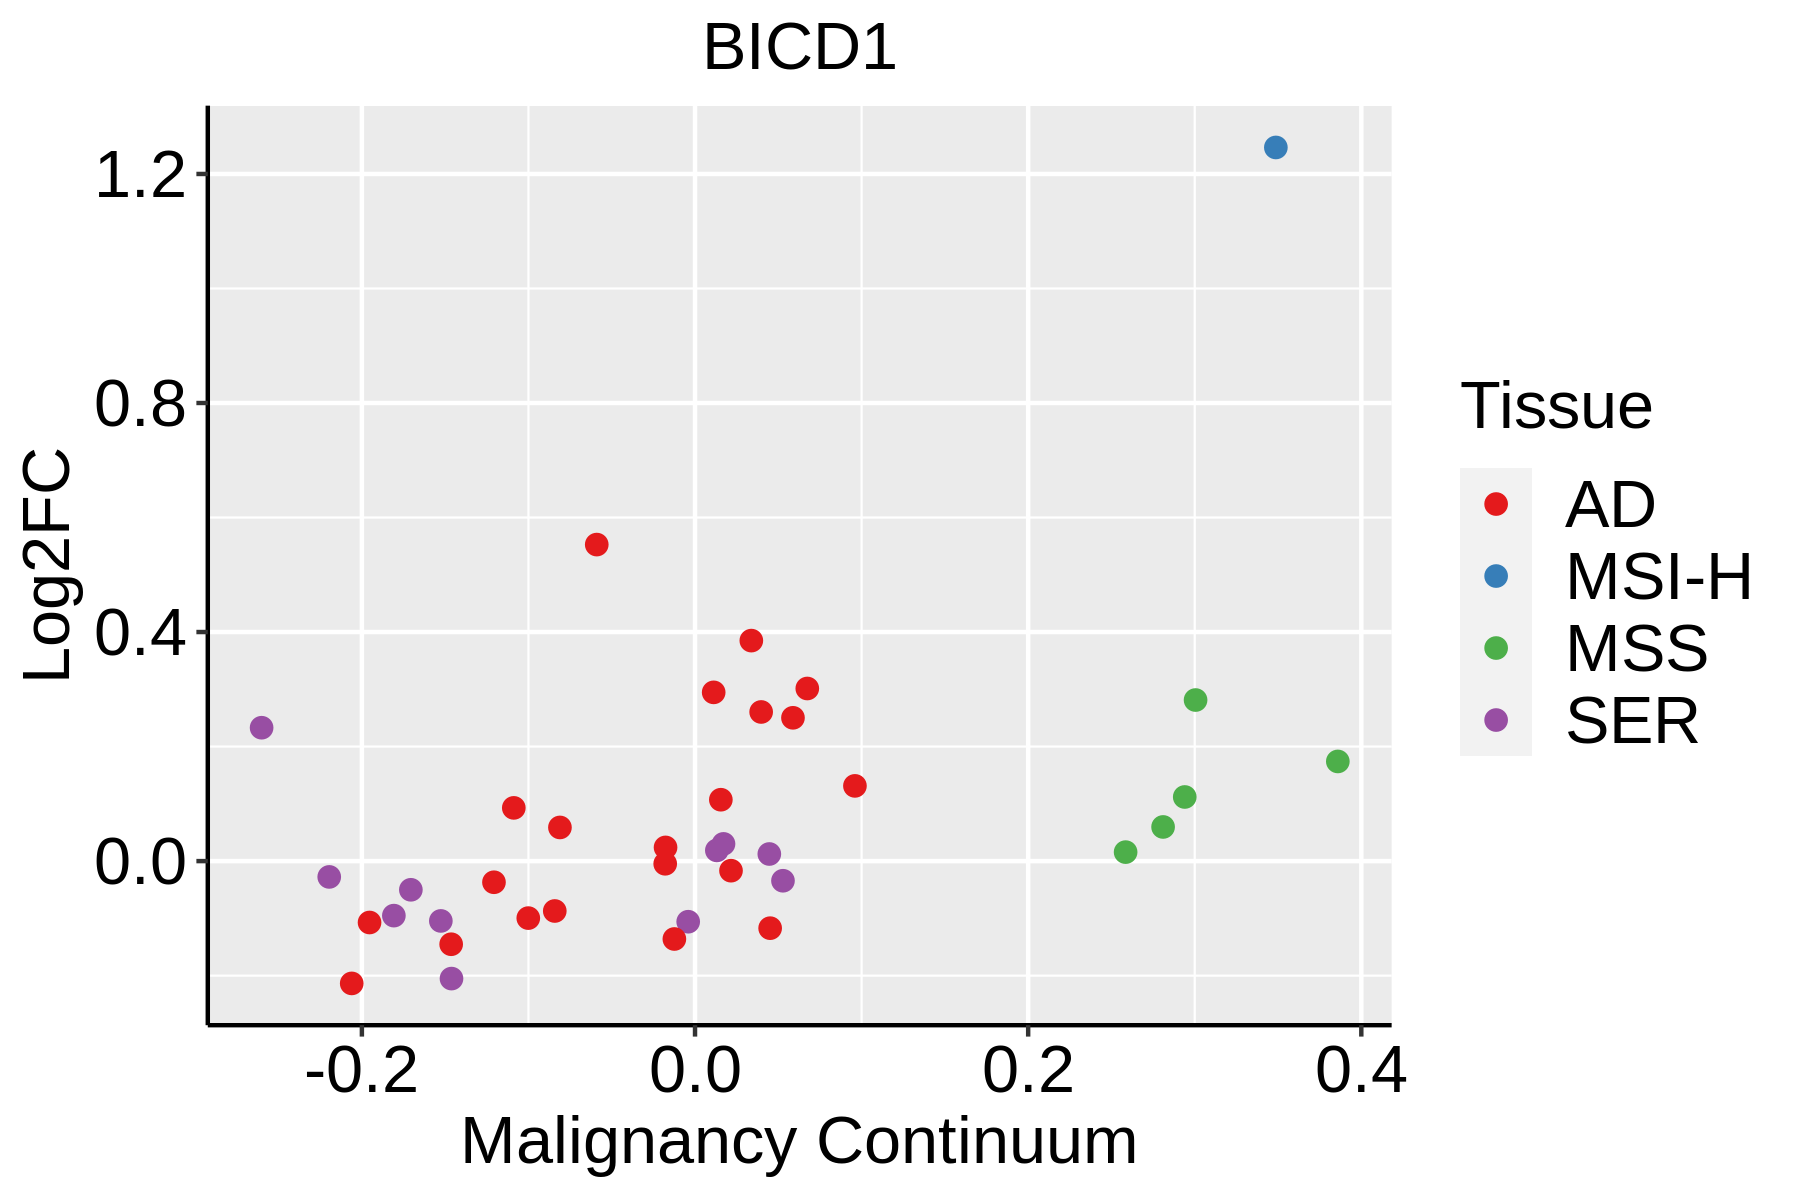 | AD: Adenomas |
| SER: Sessile serrated lesions | ||
| MSI-H: Microsatellite-high colorectal cancer | ||
| MSS: Microsatellite stable colorectal cancer | ||
| Endometrium |  | AEH: Atypical endometrial hyperplasia |
| EEC: Endometrioid Cancer | ||
| Esophagus |  | ESCC: Esophageal squamous cell carcinoma |
| HGIN: High-grade intraepithelial neoplasias | ||
| LGIN: Low-grade intraepithelial neoplasias | ||
| Lung | 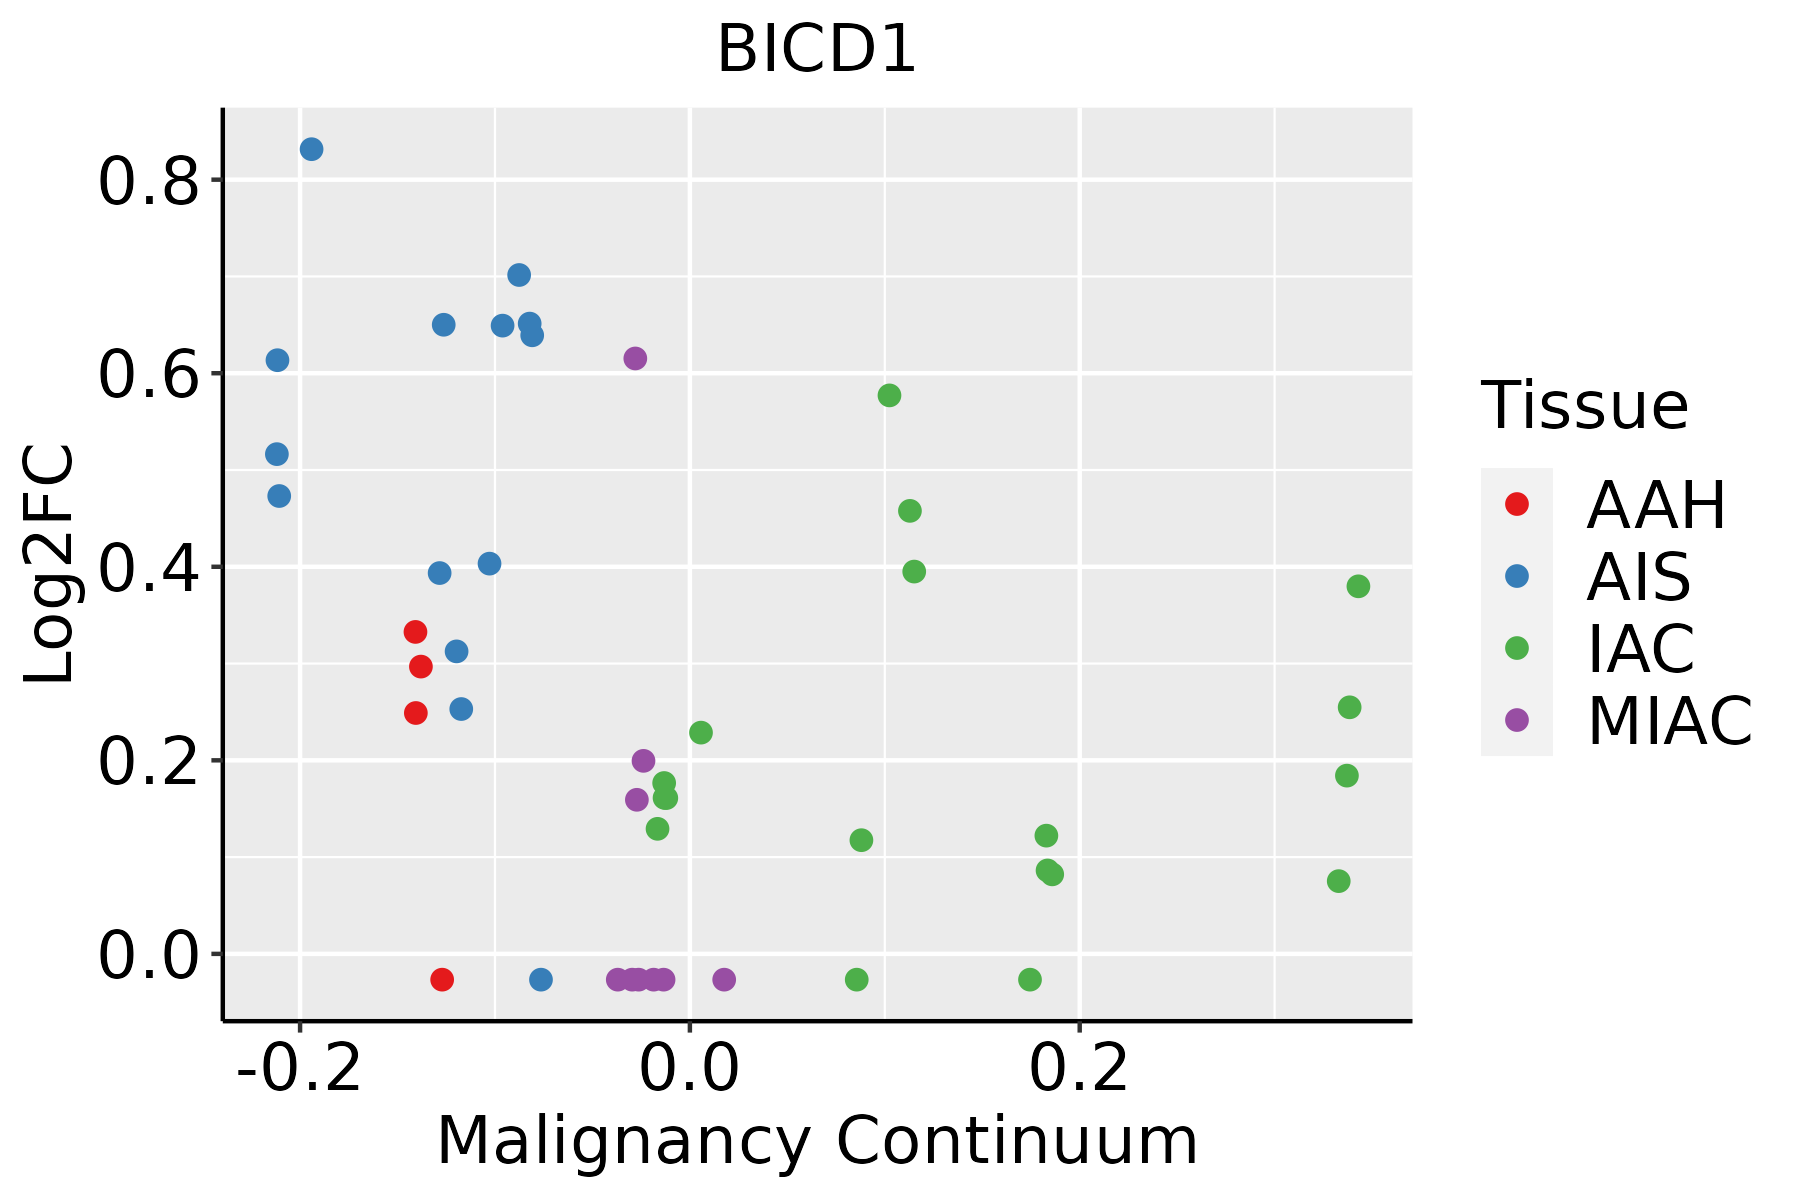 | AAH: Atypical adenomatous hyperplasia |
| AIS: Adenocarcinoma in situ | ||
| IAC: Invasive lung adenocarcinoma | ||
| MIA: Minimally invasive adenocarcinoma | ||
| Thyroid | 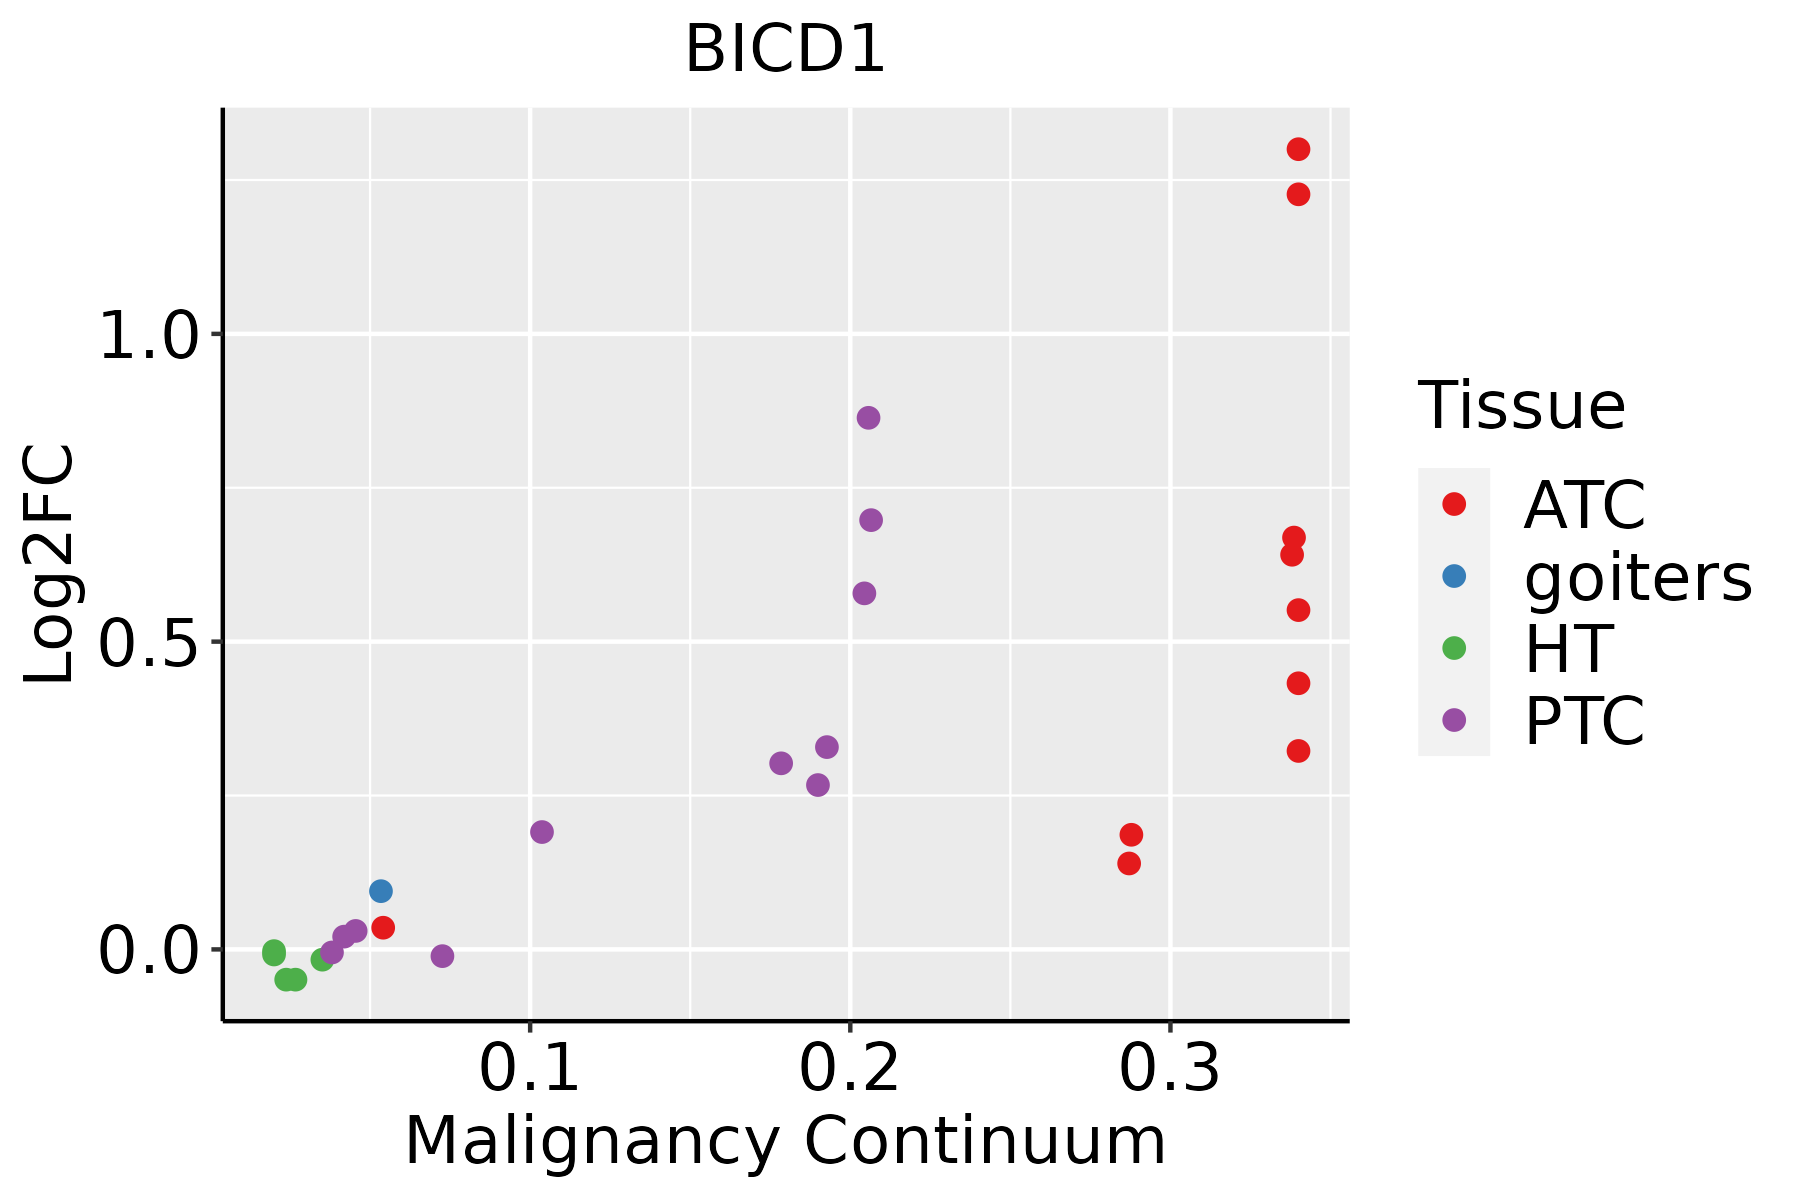 | ATC: Anaplastic thyroid cancer |
| HT: Hashimoto's thyroiditis | ||
| PTC: Papillary thyroid cancer |
| ∗log2FC in expression of this searched gene in stem-like cells from each diseased tissue sample relative to stem-like cells in normal samples in each tissue plotted against the malignancy continuum. Samples are colored based on if they are from different disease stage. |
Top |
Malignant transformation related pathway analysis |
| Find out the enriched GO biological processes and KEGG pathways involved in transition from healthy to precancer to cancer |
| Tissue | Disease Stage | Enriched GO biological Processes |
| Colorectum | AD |  |
| Colorectum | SER |  |
| Colorectum | MSS |  |
| Colorectum | MSI-H |  |
| Colorectum | FAP |  |
| ∗Top 15 enriched GO BP terms are showed in the bar plot of each disease state in each tissue. Each row represents a significant GO biological process which is colored according to the -log10(p.adjust). |
| Page: 1 2 3 4 5 6 7 8 9 |
| GO ID | Tissue | Disease Stage | Description | Gene Ratio | Bg Ratio | pvalue | p.adjust | Count |
| GO:0010970 | Colorectum | CRC | transport along microtubule | 30/2078 | 155/18723 | 1.67e-03 | 1.73e-02 | 30 |
| GO:00482593 | Colorectum | CRC | regulation of receptor-mediated endocytosis | 23/2078 | 110/18723 | 1.98e-03 | 1.98e-02 | 23 |
| GO:00723842 | Colorectum | CRC | organelle transport along microtubule | 19/2078 | 85/18723 | 2.12e-03 | 2.09e-02 | 19 |
| GO:00064035 | Colorectum | CRC | RNA localization | 35/2078 | 201/18723 | 4.64e-03 | 3.61e-02 | 35 |
| GO:00726982 | Colorectum | CRC | protein localization to microtubule cytoskeleton | 13/2078 | 54/18723 | 5.25e-03 | 3.98e-02 | 13 |
| GO:00340631 | Colorectum | CRC | stress granule assembly | 8/2078 | 26/18723 | 5.65e-03 | 4.24e-02 | 8 |
| GO:001603216 | Endometrium | AEH | viral process | 110/2100 | 415/18723 | 1.99e-18 | 1.09e-15 | 110 |
| GO:190382916 | Endometrium | AEH | positive regulation of cellular protein localization | 66/2100 | 276/18723 | 1.57e-09 | 1.36e-07 | 66 |
| GO:000640314 | Endometrium | AEH | RNA localization | 51/2100 | 201/18723 | 1.39e-08 | 8.98e-07 | 51 |
| GO:00516568 | Endometrium | AEH | establishment of organelle localization | 77/2100 | 390/18723 | 4.89e-07 | 1.94e-05 | 77 |
| GO:00482598 | Endometrium | AEH | regulation of receptor-mediated endocytosis | 28/2100 | 110/18723 | 2.28e-05 | 4.35e-04 | 28 |
| GO:00301009 | Endometrium | AEH | regulation of endocytosis | 44/2100 | 211/18723 | 3.39e-05 | 6.05e-04 | 44 |
| GO:00068988 | Endometrium | AEH | receptor-mediated endocytosis | 49/2100 | 244/18723 | 3.54e-05 | 6.24e-04 | 49 |
| GO:00482608 | Endometrium | AEH | positive regulation of receptor-mediated endocytosis | 16/2100 | 52/18723 | 1.18e-04 | 1.66e-03 | 16 |
| GO:00458078 | Endometrium | AEH | positive regulation of endocytosis | 24/2100 | 100/18723 | 2.27e-04 | 2.75e-03 | 24 |
| GO:005134610 | Endometrium | AEH | negative regulation of hydrolase activity | 65/2100 | 379/18723 | 3.18e-04 | 3.57e-03 | 65 |
| GO:00307058 | Endometrium | AEH | cytoskeleton-dependent intracellular transport | 38/2100 | 195/18723 | 4.72e-04 | 4.91e-03 | 38 |
| GO:00705075 | Endometrium | AEH | regulation of microtubule cytoskeleton organization | 27/2100 | 148/18723 | 7.34e-03 | 4.18e-02 | 27 |
| GO:001603217 | Endometrium | EEC | viral process | 112/2168 | 415/18723 | 2.48e-18 | 1.35e-15 | 112 |
| GO:190382917 | Endometrium | EEC | positive regulation of cellular protein localization | 67/2168 | 276/18723 | 2.27e-09 | 1.84e-07 | 67 |
| Page: 1 2 3 4 5 6 7 8 9 |
| Pathway ID | Tissue | Disease Stage | Description | Gene Ratio | Bg Ratio | pvalue | p.adjust | qvalue | Count |
| hsa032509 | Esophagus | ESCC | Viral life cycle - HIV-1 | 54/4205 | 63/8465 | 2.01e-09 | 2.17e-08 | 1.11e-08 | 54 |
| hsa0325014 | Esophagus | ESCC | Viral life cycle - HIV-1 | 54/4205 | 63/8465 | 2.01e-09 | 2.17e-08 | 1.11e-08 | 54 |
| Page: 1 |
Top |
Cell-cell communication analysis |
| Identification of potential cell-cell interactions between two cell types and their ligand-receptor pairs for different disease states |
| Ligand | Receptor | LRpair | Pathway | Tissue | Disease Stage |
| Page: 1 |
Top |
Single-cell gene regulatory network inference analysis |
| Find out the significant the regulons (TFs) and the target genes of each regulon across cell types for different disease states |
| TF | Cell Type | Tissue | Disease Stage | Target Gene | RSS | Regulon Activity |
| ∗The dot plots of a searched regulon are shown for all cell subpopulations in each disease state of each tissue based on the regulon specific score inferred using pySCENIC and by calculating the average expression. |
| Page: 1 |
Top |
Somatic mutation of malignant transformation related genes |
| Annotation of somatic variants for genes involved in malignant transformation |
| Hugo Symbol | Variant Class | Variant Classification | dbSNP RS | HGVSc | HGVSp | HGVSp Short | SWISSPROT | BIOTYPE | SIFT | PolyPhen | Tumor Sample Barcode | Tissue | Histology | Sex | Age | Stage | Therapy Types | Drugs | Outcome |
| BICD1 | SNV | Missense_Mutation | c.316N>G | p.Leu106Val | p.L106V | Q96G01 | protein_coding | tolerated(0.38) | possibly_damaging(0.468) | TCGA-A2-A0CX-01 | Breast | breast invasive carcinoma | Female | <65 | I/II | Chemotherapy | adriamycin | SD | |
| BICD1 | SNV | Missense_Mutation | c.751N>C | p.Glu251Gln | p.E251Q | Q96G01 | protein_coding | deleterious(0.01) | possibly_damaging(0.809) | TCGA-AC-A23H-01 | Breast | breast invasive carcinoma | Female | >=65 | I/II | Unknown | Unknown | PD | |
| BICD1 | SNV | Missense_Mutation | c.1861G>C | p.Glu621Gln | p.E621Q | Q96G01 | protein_coding | deleterious(0) | probably_damaging(0.998) | TCGA-BH-A0BA-01 | Breast | breast invasive carcinoma | Female | <65 | III/IV | Chemotherapy | cytoxan | SD | |
| BICD1 | deletion | Frame_Shift_Del | novel | c.1190delN | p.Asp398ThrfsTer16 | p.D398Tfs*16 | Q96G01 | protein_coding | TCGA-D8-A27V-01 | Breast | breast invasive carcinoma | Female | <65 | I/II | Hormone Therapy | tamoxiphen | SD | ||
| BICD1 | SNV | Missense_Mutation | rs756217437 | c.490N>T | p.Arg164Trp | p.R164W | Q96G01 | protein_coding | deleterious(0) | probably_damaging(1) | TCGA-2W-A8YY-01 | Cervix | cervical & endocervical cancer | Female | <65 | I/II | Chemotherapy | cisplatin | CR |
| BICD1 | SNV | Missense_Mutation | c.1958N>C | p.Arg653Thr | p.R653T | Q96G01 | protein_coding | deleterious(0) | possibly_damaging(0.572) | TCGA-EK-A2RB-01 | Cervix | cervical & endocervical cancer | Female | <65 | I/II | Unknown | Unknown | SD | |
| BICD1 | SNV | Missense_Mutation | rs757213231 | c.2792N>T | p.Pro931Leu | p.P931L | Q96G01 | protein_coding | tolerated_low_confidence(0.06) | benign(0.198) | TCGA-MA-AA42-01 | Cervix | cervical & endocervical cancer | Female | >=65 | I/II | Unknown | Unknown | SD |
| BICD1 | SNV | Missense_Mutation | c.58C>A | p.Leu20Ile | p.L20I | Q96G01 | protein_coding | deleterious(0) | probably_damaging(0.952) | TCGA-AA-3663-01 | Colorectum | colon adenocarcinoma | Male | <65 | I/II | Unknown | Unknown | SD | |
| BICD1 | SNV | Missense_Mutation | c.1813N>G | p.Thr605Ala | p.T605A | Q96G01 | protein_coding | tolerated(0.56) | benign(0.009) | TCGA-AA-3811-01 | Colorectum | colon adenocarcinoma | Female | >=65 | III/IV | Unknown | Unknown | PD | |
| BICD1 | SNV | Missense_Mutation | c.2528N>C | p.Gln843Pro | p.Q843P | Q96G01 | protein_coding | tolerated_low_confidence(0.1) | benign(0.374) | TCGA-AA-3815-01 | Colorectum | colon adenocarcinoma | Female | >=65 | I/II | Unknown | Unknown | SD |
| Page: 1 2 3 4 5 6 7 8 9 10 11 |
Top |
Related drugs of malignant transformation related genes |
| Identification of chemicals and drugs interact with genes involved in malignant transfromation |
| (DGIdb 4.0) |
| Entrez ID | Symbol | Category | Interaction Types | Drug Claim Name | Drug Name | PMIDs |
| Page: 1 |

Copyright 2023-Present -The University of Texas Health Science Center at Houston |