
|
|||||
|
 | |
| |
| |
| |
| |
| |
|
Gene: B4GALT5 |
Gene summary for B4GALT5 |
| Gene information | Species | Human | Gene symbol | B4GALT5 | Gene ID | 9334 |
| Gene name | beta-1,4-galactosyltransferase 5 | |
| Gene Alias | B4Gal-T5 | |
| Cytomap | 20q13.13 | |
| Gene Type | protein-coding | GO ID | GO:0000271 | UniProtAcc | O43286 |
Top |
Malignant transformation analysis |
| Identification of the aberrant gene expression in precancerous and cancerous lesions by comparing the gene expression of stem-like cells in diseased tissues with normal stem cells |
| Entrez ID | Symbol | Replicates | Species | Organ | Tissue | Adj P-value | Log2FC | Malignancy |
| 9334 | B4GALT5 | HTA11_3410_2000001011 | Human | Colorectum | AD | 3.04e-06 | -3.95e-01 | 0.0155 |
| 9334 | B4GALT5 | HTA11_347_2000001011 | Human | Colorectum | AD | 1.87e-02 | 2.49e-01 | -0.1954 |
| 9334 | B4GALT5 | HTA11_7696_3000711011 | Human | Colorectum | AD | 6.11e-04 | -3.04e-01 | 0.0674 |
| 9334 | B4GALT5 | HTA11_99999971662_82457 | Human | Colorectum | MSS | 1.43e-02 | 5.77e-01 | 0.3859 |
| 9334 | B4GALT5 | A015-C-203 | Human | Colorectum | FAP | 4.36e-22 | -2.98e-01 | -0.1294 |
| 9334 | B4GALT5 | A015-C-204 | Human | Colorectum | FAP | 4.29e-04 | -9.65e-02 | -0.0228 |
| 9334 | B4GALT5 | A002-C-201 | Human | Colorectum | FAP | 1.67e-10 | -2.49e-01 | 0.0324 |
| 9334 | B4GALT5 | A002-C-203 | Human | Colorectum | FAP | 7.14e-03 | -6.78e-02 | 0.2786 |
| 9334 | B4GALT5 | A001-C-119 | Human | Colorectum | FAP | 6.79e-04 | -3.47e-01 | -0.1557 |
| 9334 | B4GALT5 | A001-C-108 | Human | Colorectum | FAP | 2.17e-10 | -2.06e-01 | -0.0272 |
| 9334 | B4GALT5 | A002-C-205 | Human | Colorectum | FAP | 1.24e-17 | -4.65e-01 | -0.1236 |
| 9334 | B4GALT5 | A001-C-104 | Human | Colorectum | FAP | 1.25e-03 | -1.76e-01 | 0.0184 |
| 9334 | B4GALT5 | A015-C-005 | Human | Colorectum | FAP | 4.63e-02 | -2.50e-01 | -0.0336 |
| 9334 | B4GALT5 | A015-C-006 | Human | Colorectum | FAP | 5.21e-14 | -4.83e-01 | -0.0994 |
| 9334 | B4GALT5 | A015-C-106 | Human | Colorectum | FAP | 9.73e-08 | -2.10e-01 | -0.0511 |
| 9334 | B4GALT5 | A002-C-114 | Human | Colorectum | FAP | 5.08e-18 | -5.70e-01 | -0.1561 |
| 9334 | B4GALT5 | A015-C-104 | Human | Colorectum | FAP | 8.24e-26 | -4.30e-01 | -0.1899 |
| 9334 | B4GALT5 | A001-C-014 | Human | Colorectum | FAP | 5.02e-07 | -2.19e-01 | 0.0135 |
| 9334 | B4GALT5 | A002-C-016 | Human | Colorectum | FAP | 1.29e-18 | -2.97e-01 | 0.0521 |
| 9334 | B4GALT5 | A015-C-002 | Human | Colorectum | FAP | 1.43e-08 | -2.61e-01 | -0.0763 |
| Page: 1 2 3 4 5 6 7 8 9 |
| Tissue | Expression Dynamics | Abbreviation |
| Colorectum (GSE201348) |  | FAP: Familial adenomatous polyposis |
| CRC: Colorectal cancer | ||
| Colorectum (HTA11) |  | AD: Adenomas |
| SER: Sessile serrated lesions | ||
| MSI-H: Microsatellite-high colorectal cancer | ||
| MSS: Microsatellite stable colorectal cancer | ||
| Endometrium | 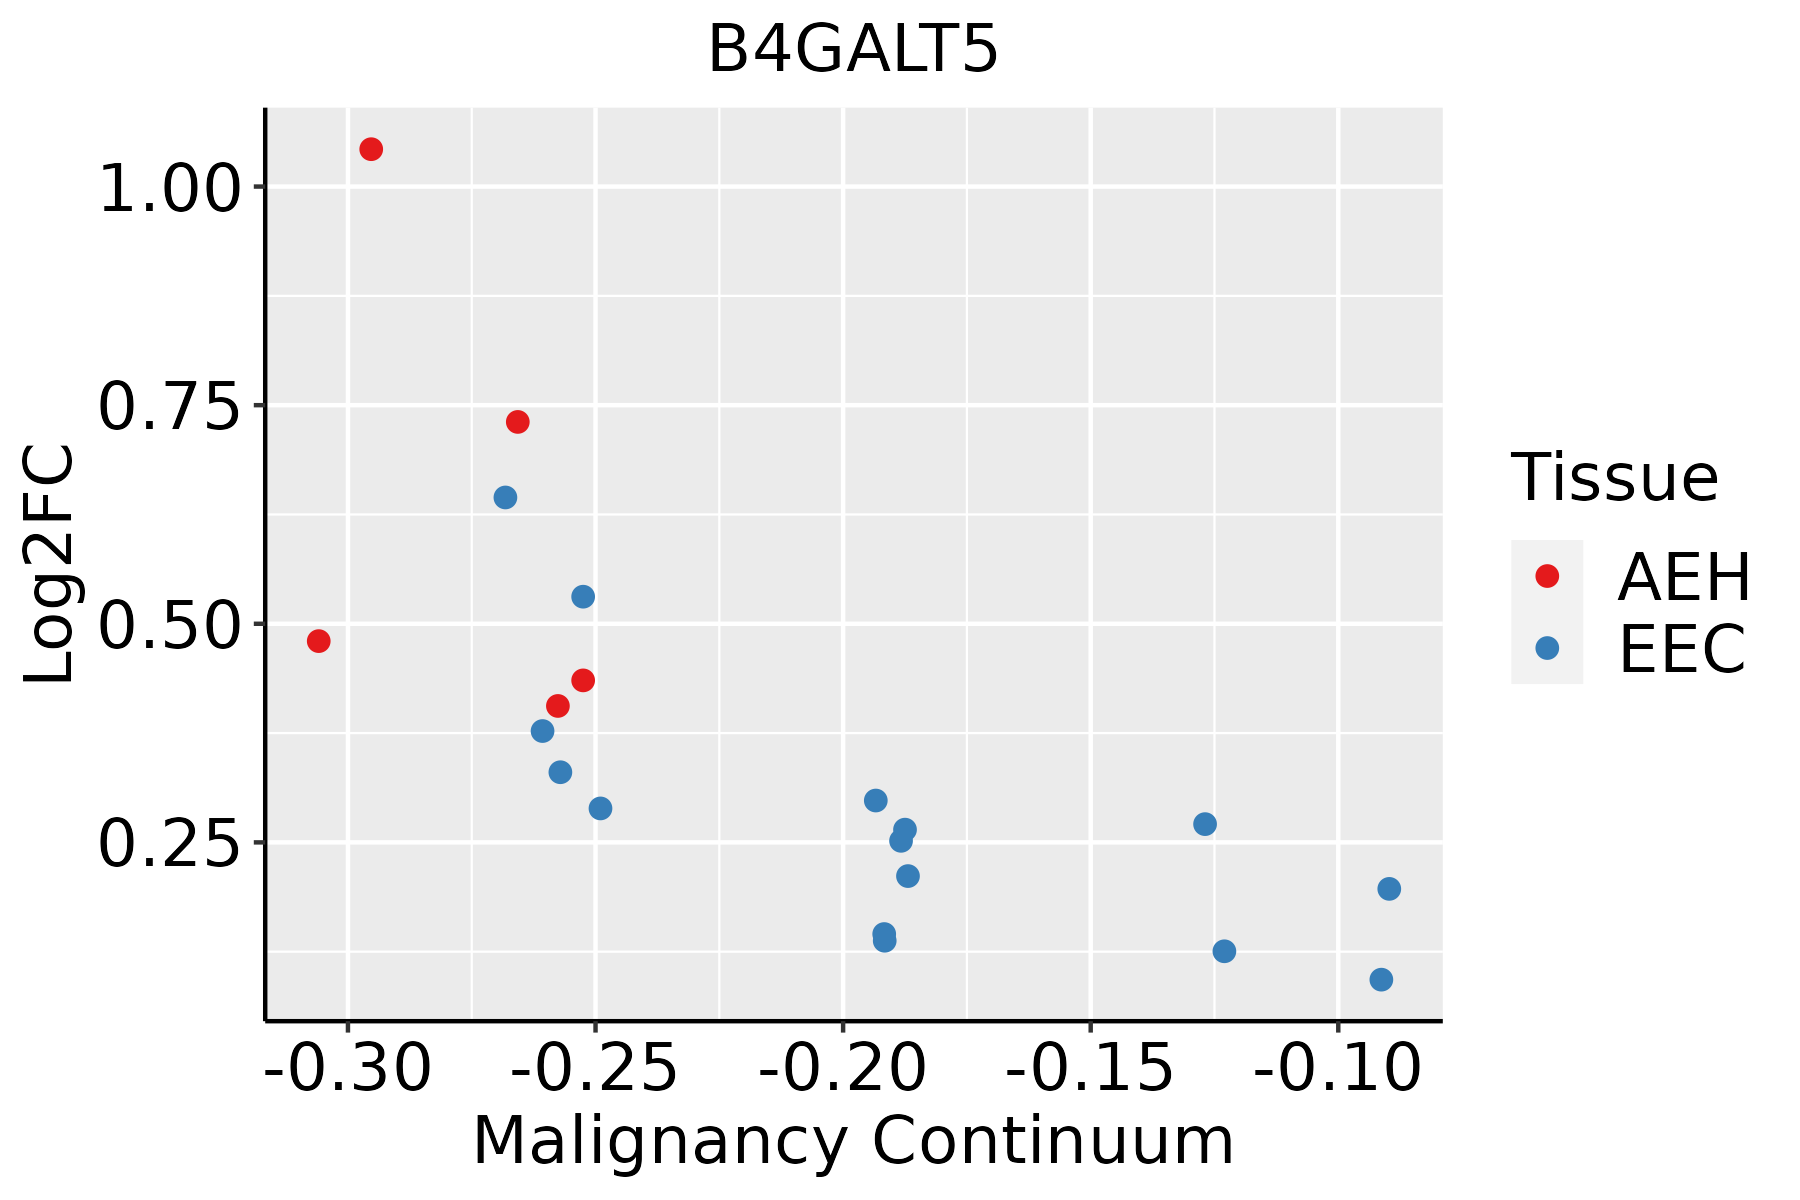 | AEH: Atypical endometrial hyperplasia |
| EEC: Endometrioid Cancer | ||
| Esophagus | 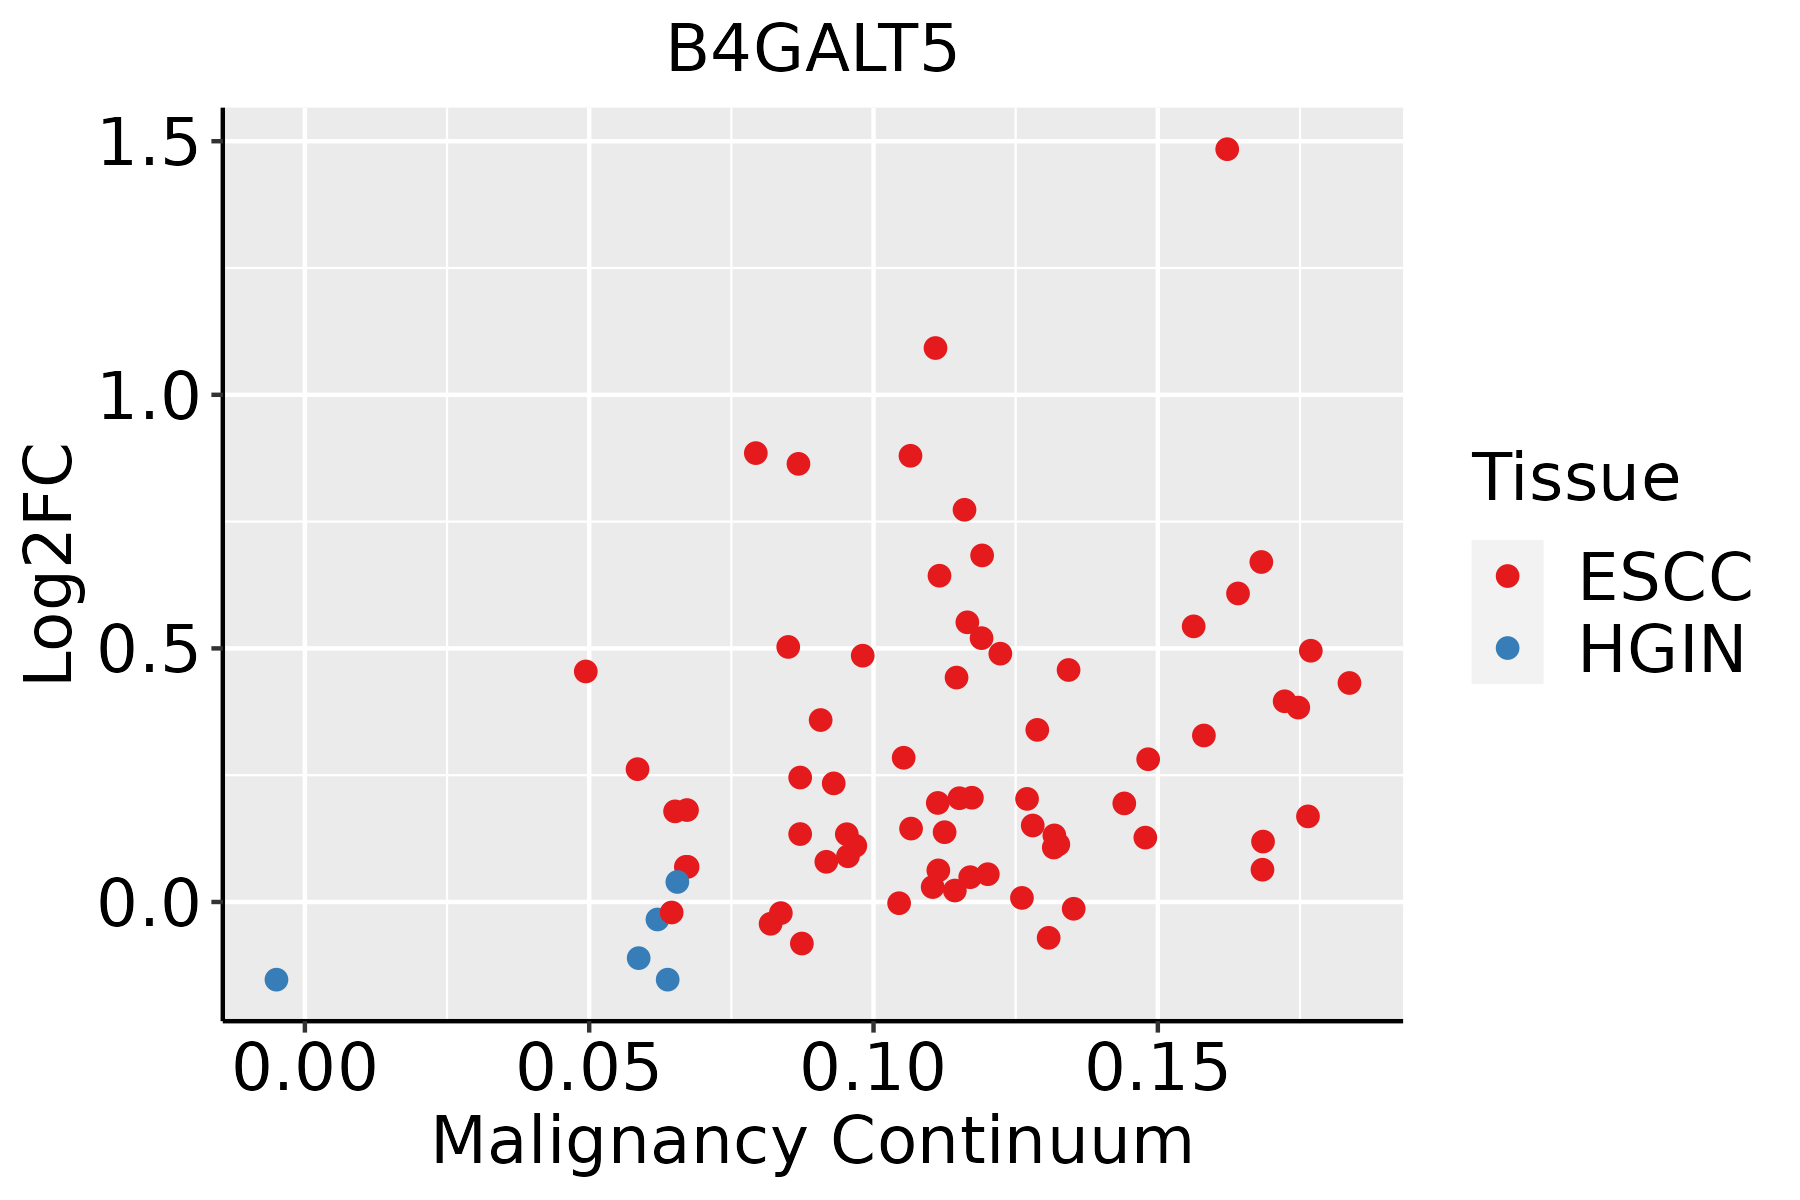 | ESCC: Esophageal squamous cell carcinoma |
| HGIN: High-grade intraepithelial neoplasias | ||
| LGIN: Low-grade intraepithelial neoplasias | ||
| GC | 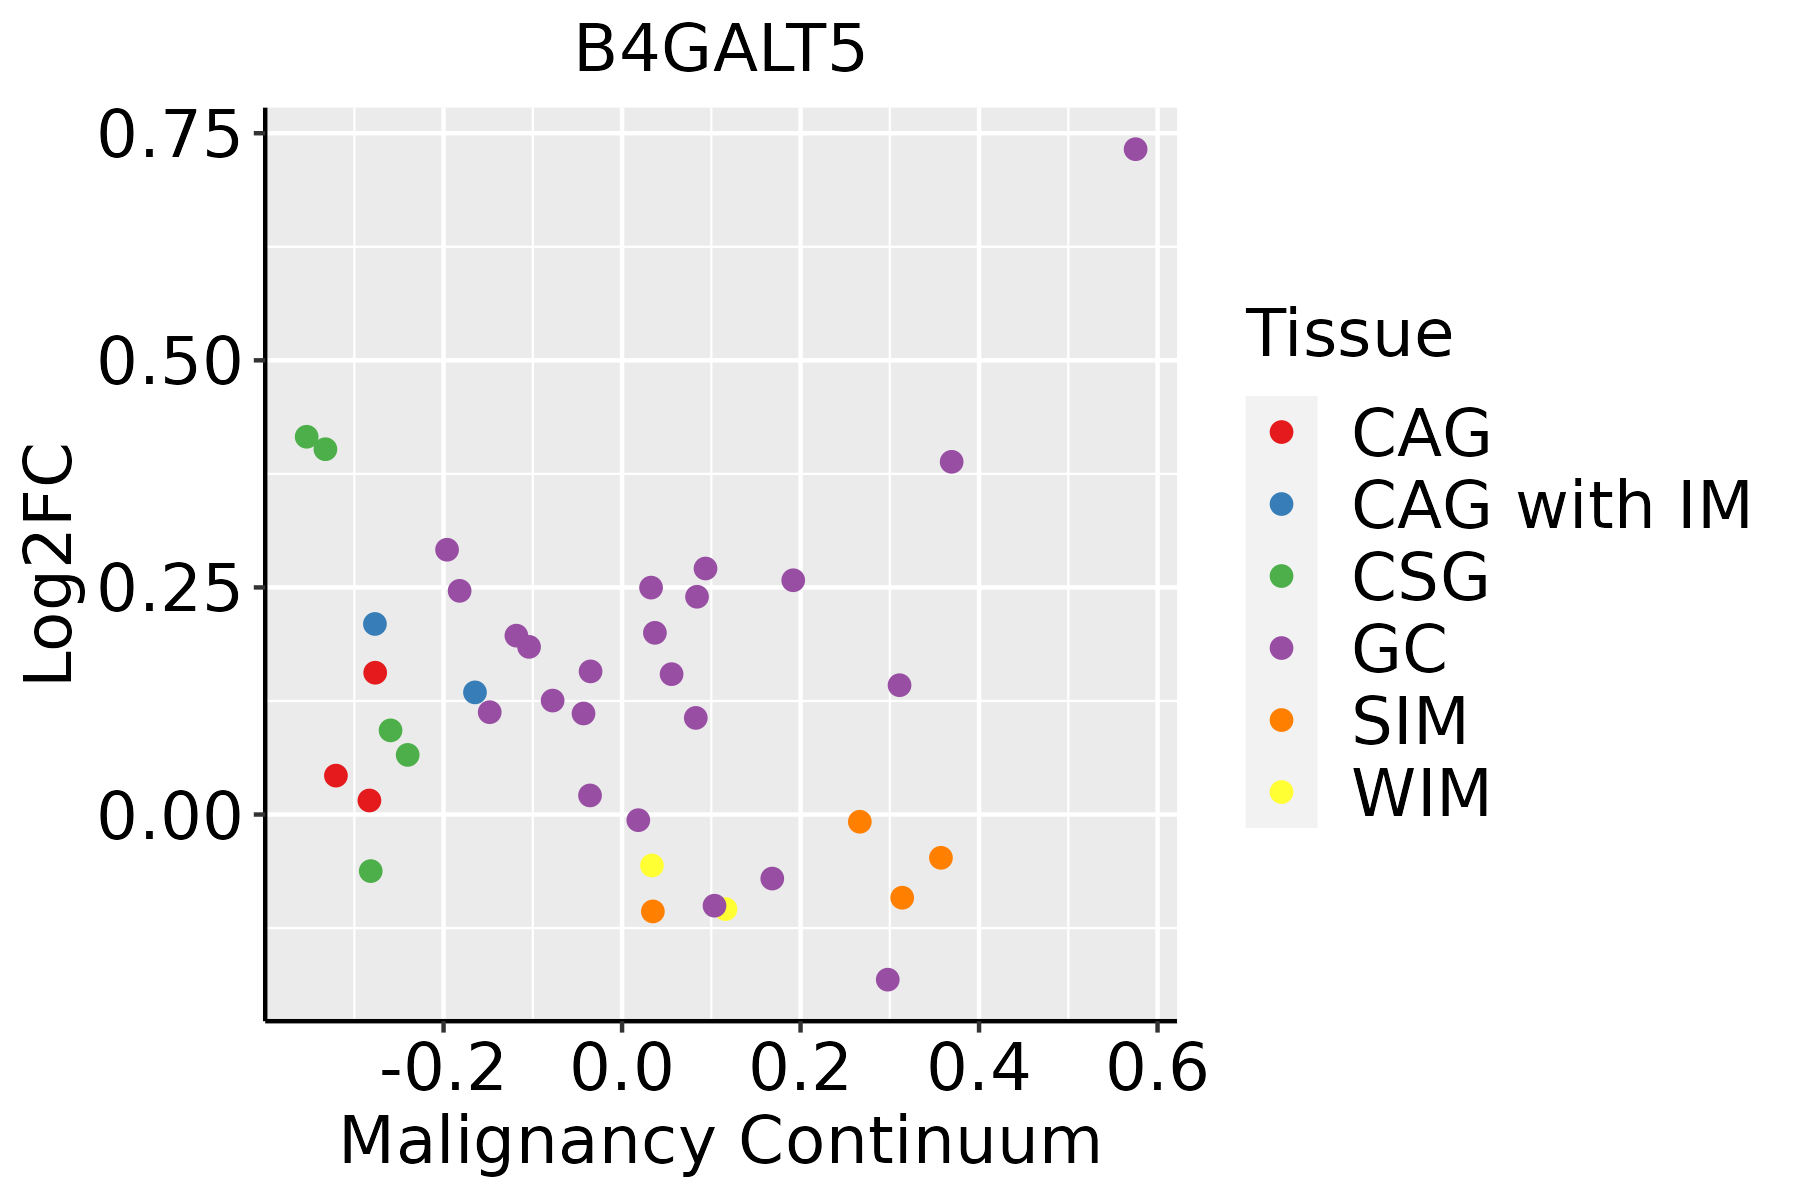 | CAG: Chronic atrophic gastritis |
| CAG with IM: Chronic atrophic gastritis with intestinal metaplasia | ||
| CSG: Chronic superficial gastritis | ||
| GC: Gastric cancer | ||
| SIM: Severe intestinal metaplasia | ||
| WIM: Wild intestinal metaplasia | ||
| Liver | 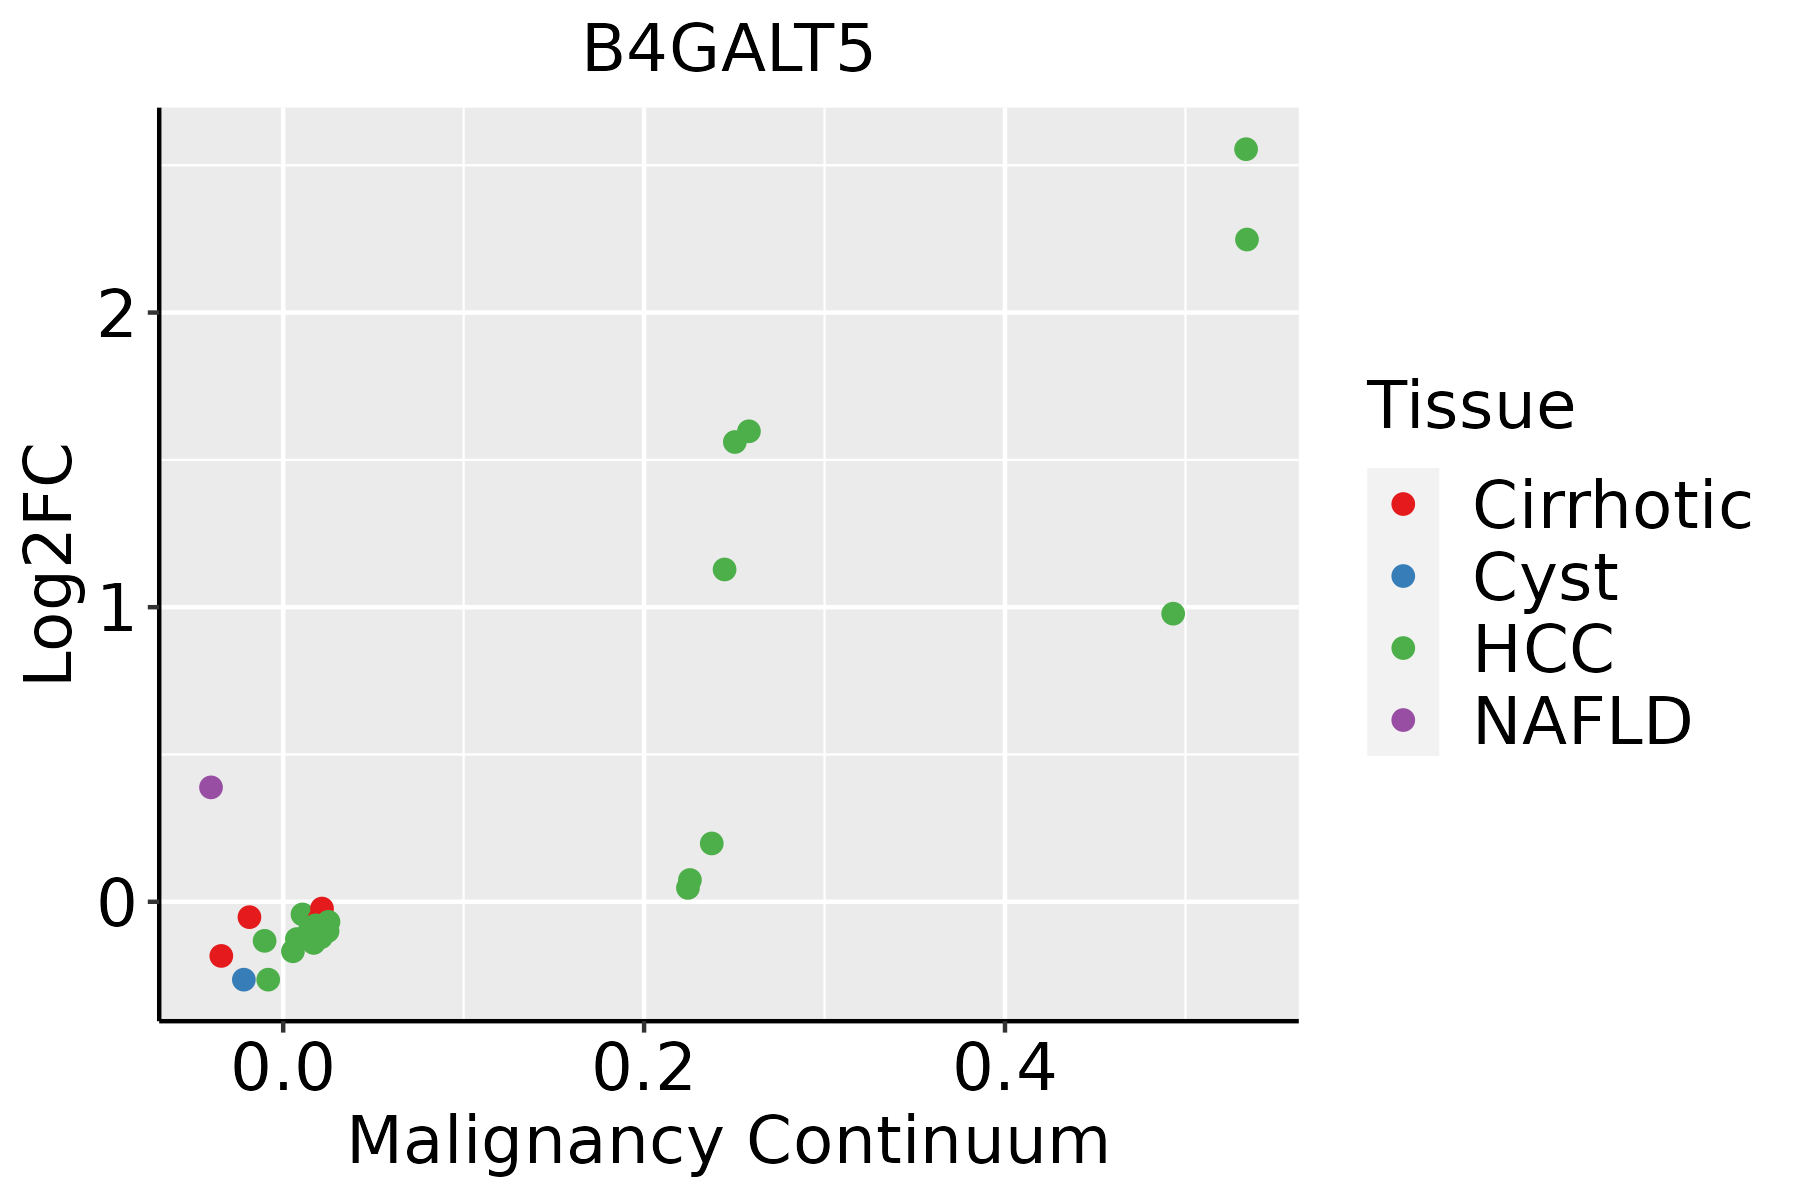 | HCC: Hepatocellular carcinoma |
| NAFLD: Non-alcoholic fatty liver disease | ||
| Lung |  | AAH: Atypical adenomatous hyperplasia |
| AIS: Adenocarcinoma in situ | ||
| IAC: Invasive lung adenocarcinoma | ||
| MIA: Minimally invasive adenocarcinoma | ||
| Oral Cavity | 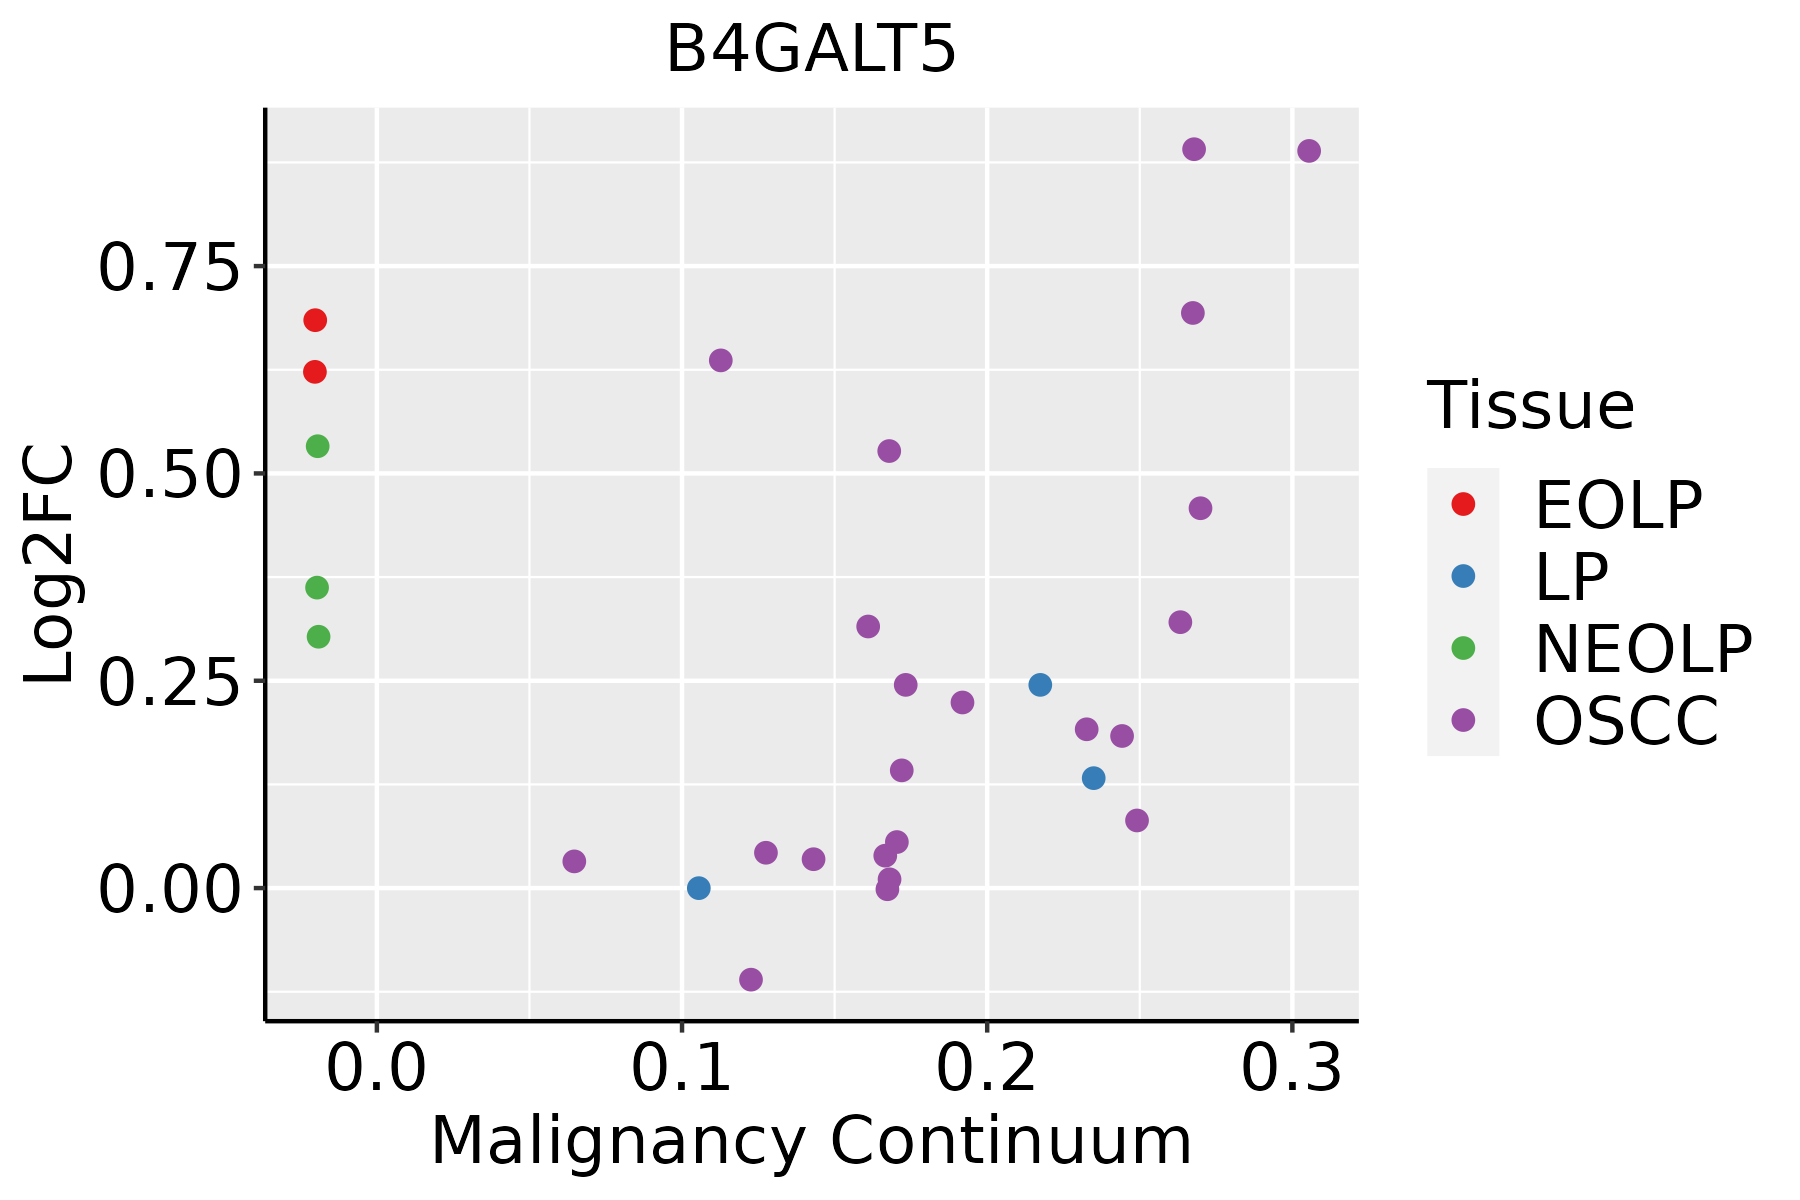 | EOLP: Erosive Oral lichen planus |
| LP: leukoplakia | ||
| NEOLP: Non-erosive oral lichen planus | ||
| OSCC: Oral squamous cell carcinoma | ||
| Prostate |  | BPH: Benign Prostatic Hyperplasia |
| Thyroid |  | ATC: Anaplastic thyroid cancer |
| HT: Hashimoto's thyroiditis | ||
| PTC: Papillary thyroid cancer |
| ∗log2FC in expression of this searched gene in stem-like cells from each diseased tissue sample relative to stem-like cells in normal samples in each tissue plotted against the malignancy continuum. Samples are colored based on if they are from different disease stage. |
Top |
Malignant transformation related pathway analysis |
| Find out the enriched GO biological processes and KEGG pathways involved in transition from healthy to precancer to cancer |
| Tissue | Disease Stage | Enriched GO biological Processes |
| Colorectum | AD |  |
| Colorectum | SER |  |
| Colorectum | MSS |  |
| Colorectum | MSI-H |  |
| Colorectum | FAP |  |
| ∗Top 15 enriched GO BP terms are showed in the bar plot of each disease state in each tissue. Each row represents a significant GO biological process which is colored according to the -log10(p.adjust). |
| Page: 1 2 3 4 5 6 7 8 9 |
| GO ID | Tissue | Disease Stage | Description | Gene Ratio | Bg Ratio | pvalue | p.adjust | Count |
| GO:0006023 | Esophagus | ESCC | aminoglycan biosynthetic process | 47/8552 | 79/18723 | 9.29e-03 | 3.23e-02 | 47 |
| GO:00487092 | Esophagus | ESCC | oligodendrocyte differentiation | 55/8552 | 95/18723 | 1.10e-02 | 3.72e-02 | 55 |
| GO:00346372 | Esophagus | ESCC | cellular carbohydrate biosynthetic process | 46/8552 | 78/18723 | 1.24e-02 | 4.13e-02 | 46 |
| GO:00316477 | Liver | NAFLD | regulation of protein stability | 61/1882 | 298/18723 | 5.00e-08 | 4.71e-06 | 61 |
| GO:00442623 | Liver | NAFLD | cellular carbohydrate metabolic process | 55/1882 | 283/18723 | 1.27e-06 | 6.01e-05 | 55 |
| GO:0016051 | Liver | NAFLD | carbohydrate biosynthetic process | 43/1882 | 202/18723 | 1.55e-06 | 6.96e-05 | 43 |
| GO:0034637 | Liver | NAFLD | cellular carbohydrate biosynthetic process | 20/1882 | 78/18723 | 6.46e-05 | 1.39e-03 | 20 |
| GO:0005976 | Liver | NAFLD | polysaccharide metabolic process | 24/1882 | 107/18723 | 1.28e-04 | 2.46e-03 | 24 |
| GO:0044264 | Liver | NAFLD | cellular polysaccharide metabolic process | 22/1882 | 96/18723 | 1.73e-04 | 3.08e-03 | 22 |
| GO:0000271 | Liver | NAFLD | polysaccharide biosynthetic process | 17/1882 | 72/18723 | 6.35e-04 | 8.27e-03 | 17 |
| GO:0033692 | Liver | NAFLD | cellular polysaccharide biosynthetic process | 15/1882 | 65/18723 | 1.66e-03 | 1.74e-02 | 15 |
| GO:00219551 | Liver | NAFLD | central nervous system neuron axonogenesis | 9/1882 | 35/18723 | 6.47e-03 | 4.69e-02 | 9 |
| GO:00615645 | Liver | NAFLD | axon development | 64/1882 | 467/18723 | 6.48e-03 | 4.69e-02 | 64 |
| GO:00074095 | Liver | NAFLD | axonogenesis | 58/1882 | 418/18723 | 7.16e-03 | 4.96e-02 | 58 |
| GO:003164712 | Liver | Cirrhotic | regulation of protein stability | 144/4634 | 298/18723 | 6.74e-19 | 1.28e-16 | 144 |
| GO:004426211 | Liver | Cirrhotic | cellular carbohydrate metabolic process | 97/4634 | 283/18723 | 1.89e-04 | 1.76e-03 | 97 |
| GO:00160511 | Liver | Cirrhotic | carbohydrate biosynthetic process | 73/4634 | 202/18723 | 1.91e-04 | 1.77e-03 | 73 |
| GO:0042063 | Liver | Cirrhotic | gliogenesis | 98/4634 | 301/18723 | 1.28e-03 | 8.60e-03 | 98 |
| GO:0006643 | Liver | Cirrhotic | membrane lipid metabolic process | 69/4634 | 203/18723 | 1.89e-03 | 1.19e-02 | 69 |
| GO:0010001 | Liver | Cirrhotic | glial cell differentiation | 75/4634 | 225/18723 | 2.24e-03 | 1.36e-02 | 75 |
| Page: 1 2 3 4 5 6 7 8 9 10 |
| Pathway ID | Tissue | Disease Stage | Description | Gene Ratio | Bg Ratio | pvalue | p.adjust | qvalue | Count |
| hsa006003 | Esophagus | ESCC | Sphingolipid metabolism | 36/4205 | 53/8465 | 5.41e-03 | 1.36e-02 | 6.99e-03 | 36 |
| hsa0060012 | Esophagus | ESCC | Sphingolipid metabolism | 36/4205 | 53/8465 | 5.41e-03 | 1.36e-02 | 6.99e-03 | 36 |
| hsa00600 | Liver | HCC | Sphingolipid metabolism | 34/4020 | 53/8465 | 1.06e-02 | 2.71e-02 | 1.51e-02 | 34 |
| hsa006001 | Liver | HCC | Sphingolipid metabolism | 34/4020 | 53/8465 | 1.06e-02 | 2.71e-02 | 1.51e-02 | 34 |
| hsa006002 | Oral cavity | OSCC | Sphingolipid metabolism | 33/3704 | 53/8465 | 5.00e-03 | 1.20e-02 | 6.13e-03 | 33 |
| hsa0060011 | Oral cavity | OSCC | Sphingolipid metabolism | 33/3704 | 53/8465 | 5.00e-03 | 1.20e-02 | 6.13e-03 | 33 |
| Page: 1 |
Top |
Cell-cell communication analysis |
| Identification of potential cell-cell interactions between two cell types and their ligand-receptor pairs for different disease states |
| Ligand | Receptor | LRpair | Pathway | Tissue | Disease Stage |
| Page: 1 |
Top |
Single-cell gene regulatory network inference analysis |
| Find out the significant the regulons (TFs) and the target genes of each regulon across cell types for different disease states |
| TF | Cell Type | Tissue | Disease Stage | Target Gene | RSS | Regulon Activity |
| ∗The dot plots of a searched regulon are shown for all cell subpopulations in each disease state of each tissue based on the regulon specific score inferred using pySCENIC and by calculating the average expression. |
| Page: 1 |
Top |
Somatic mutation of malignant transformation related genes |
| Annotation of somatic variants for genes involved in malignant transformation |
| Hugo Symbol | Variant Class | Variant Classification | dbSNP RS | HGVSc | HGVSp | HGVSp Short | SWISSPROT | BIOTYPE | SIFT | PolyPhen | Tumor Sample Barcode | Tissue | Histology | Sex | Age | Stage | Therapy Types | Drugs | Outcome |
| B4GALT5 | SNV | Missense_Mutation | c.415N>C | p.Glu139Gln | p.E139Q | O43286 | protein_coding | tolerated(1) | benign(0.009) | TCGA-A7-A26H-01 | Breast | breast invasive carcinoma | Female | >=65 | I/II | Hormone Therapy | anastrozole | PD | |
| B4GALT5 | SNV | Missense_Mutation | novel | c.68N>A | p.Ser23Tyr | p.S23Y | O43286 | protein_coding | deleterious(0.01) | benign(0.02) | TCGA-AN-A046-01 | Breast | breast invasive carcinoma | Female | >=65 | I/II | Unknown | Unknown | SD |
| B4GALT5 | SNV | Missense_Mutation | c.1045N>C | p.Glu349Gln | p.E349Q | O43286 | protein_coding | tolerated(0.11) | possibly_damaging(0.459) | TCGA-AR-A0TX-01 | Breast | breast invasive carcinoma | Female | <65 | I/II | Unknown | Unknown | SD | |
| B4GALT5 | SNV | Missense_Mutation | novel | c.790N>C | p.Tyr264His | p.Y264H | O43286 | protein_coding | deleterious(0) | probably_damaging(0.997) | TCGA-BH-A5IZ-01 | Breast | breast invasive carcinoma | Female | <65 | I/II | Chemotherapy | adriamycin | CR |
| B4GALT5 | SNV | Missense_Mutation | c.641N>C | p.Phe214Ser | p.F214S | O43286 | protein_coding | deleterious(0) | possibly_damaging(0.723) | TCGA-C8-A26Z-01 | Breast | breast invasive carcinoma | Female | <65 | I/II | Hormone Therapy | tamoxiphen | CR | |
| B4GALT5 | SNV | Missense_Mutation | c.901G>C | p.Asp301His | p.D301H | O43286 | protein_coding | deleterious(0) | probably_damaging(1) | TCGA-EW-A1J5-01 | Breast | breast invasive carcinoma | Female | <65 | I/II | Chemotherapy | adriamycin | SD | |
| B4GALT5 | insertion | Frame_Shift_Ins | novel | c.566_567insTGTGGCCTTGGAGTCAAGAGACC | p.Gln189HisfsTer42 | p.Q189Hfs*42 | O43286 | protein_coding | TCGA-A8-A06O-01 | Breast | breast invasive carcinoma | Female | <65 | I/II | Hormone Therapy | letrozole | SD | ||
| B4GALT5 | insertion | In_Frame_Ins | novel | c.945_946insTGTTGCATGTATTCTAACTCTGAGGCAGAA | p.Ser315_Arg316insCysCysMetTyrSerAsnSerGluAlaGlu | p.S315_R316insCCMYSNSEAE | O43286 | protein_coding | TCGA-A8-A07R-01 | Breast | breast invasive carcinoma | Female | >=65 | III/IV | Ancillary | zoledronic | SD | ||
| B4GALT5 | insertion | Frame_Shift_Ins | novel | c.941_942insTTTCCATAAAACATATTTATATATTGTGATGAGGAGTA | p.Ser315PhefsTer43 | p.S315Ffs*43 | O43286 | protein_coding | TCGA-A8-A09B-01 | Breast | breast invasive carcinoma | Female | <65 | III/IV | Chemotherapy | 5-fluorouracil | SD | ||
| B4GALT5 | insertion | Nonsense_Mutation | novel | c.1082_1083insGTGCAGGAACTCAGTTAAAATGCAGTTGAAGAATGTCATCTCCCGAATT | p.Tyr361Ter | p.Y361* | O43286 | protein_coding | TCGA-B6-A0RE-01 | Breast | breast invasive carcinoma | Female | <65 | I/II | Unknown | Unknown | SD |
| Page: 1 2 3 4 5 6 |
Top |
Related drugs of malignant transformation related genes |
| Identification of chemicals and drugs interact with genes involved in malignant transfromation |
| (DGIdb 4.0) |
| Entrez ID | Symbol | Category | Interaction Types | Drug Claim Name | Drug Name | PMIDs |
| Page: 1 |

Copyright 2023-Present -The University of Texas Health Science Center at Houston |