
|
|||||
|
 | |
| |
| |
| |
| |
| |
|
Gene: ATG7 |
Gene summary for ATG7 |
| Gene information | Species | Human | Gene symbol | ATG7 | Gene ID | 10533 |
| Gene name | autophagy related 7 | |
| Gene Alias | APG7-LIKE | |
| Cytomap | 3p25.3 | |
| Gene Type | protein-coding | GO ID | GO:0000045 | UniProtAcc | O95352 |
Top |
Malignant transformation analysis |
| Identification of the aberrant gene expression in precancerous and cancerous lesions by comparing the gene expression of stem-like cells in diseased tissues with normal stem cells |
| Entrez ID | Symbol | Replicates | Species | Organ | Tissue | Adj P-value | Log2FC | Malignancy |
| 10533 | ATG7 | CCI_1 | Human | Cervix | CC | 1.41e-05 | 7.90e-01 | 0.528 |
| 10533 | ATG7 | CCI_2 | Human | Cervix | CC | 1.80e-07 | 7.04e-01 | 0.5249 |
| 10533 | ATG7 | CCI_3 | Human | Cervix | CC | 1.43e-17 | 9.27e-01 | 0.516 |
| 10533 | ATG7 | CCII_1 | Human | Cervix | CC | 9.01e-03 | 2.36e-01 | 0.3249 |
| 10533 | ATG7 | HTA11_347_2000001011 | Human | Colorectum | AD | 1.43e-12 | 7.54e-01 | -0.1954 |
| 10533 | ATG7 | HTA11_1391_2000001011 | Human | Colorectum | AD | 4.73e-03 | 5.22e-01 | -0.059 |
| 10533 | ATG7 | A001-C-207 | Human | Colorectum | FAP | 4.06e-02 | -1.90e-01 | 0.1278 |
| 10533 | ATG7 | A015-C-203 | Human | Colorectum | FAP | 2.10e-31 | -5.47e-01 | -0.1294 |
| 10533 | ATG7 | A015-C-204 | Human | Colorectum | FAP | 3.87e-06 | -3.35e-01 | -0.0228 |
| 10533 | ATG7 | A014-C-040 | Human | Colorectum | FAP | 1.45e-04 | -4.51e-01 | -0.1184 |
| 10533 | ATG7 | A002-C-201 | Human | Colorectum | FAP | 2.08e-14 | -4.10e-01 | 0.0324 |
| 10533 | ATG7 | A002-C-203 | Human | Colorectum | FAP | 2.96e-03 | -9.38e-02 | 0.2786 |
| 10533 | ATG7 | A001-C-119 | Human | Colorectum | FAP | 3.80e-08 | -4.93e-01 | -0.1557 |
| 10533 | ATG7 | A001-C-108 | Human | Colorectum | FAP | 1.39e-18 | -4.09e-01 | -0.0272 |
| 10533 | ATG7 | A002-C-205 | Human | Colorectum | FAP | 4.24e-24 | -4.99e-01 | -0.1236 |
| 10533 | ATG7 | A001-C-104 | Human | Colorectum | FAP | 7.71e-04 | -2.89e-01 | 0.0184 |
| 10533 | ATG7 | A015-C-005 | Human | Colorectum | FAP | 1.34e-05 | -3.13e-01 | -0.0336 |
| 10533 | ATG7 | A015-C-006 | Human | Colorectum | FAP | 7.43e-22 | -5.81e-01 | -0.0994 |
| 10533 | ATG7 | A015-C-106 | Human | Colorectum | FAP | 1.13e-08 | -2.83e-01 | -0.0511 |
| 10533 | ATG7 | A002-C-114 | Human | Colorectum | FAP | 1.89e-25 | -6.04e-01 | -0.1561 |
| Page: 1 2 3 4 |
| Tissue | Expression Dynamics | Abbreviation |
| Cervix | 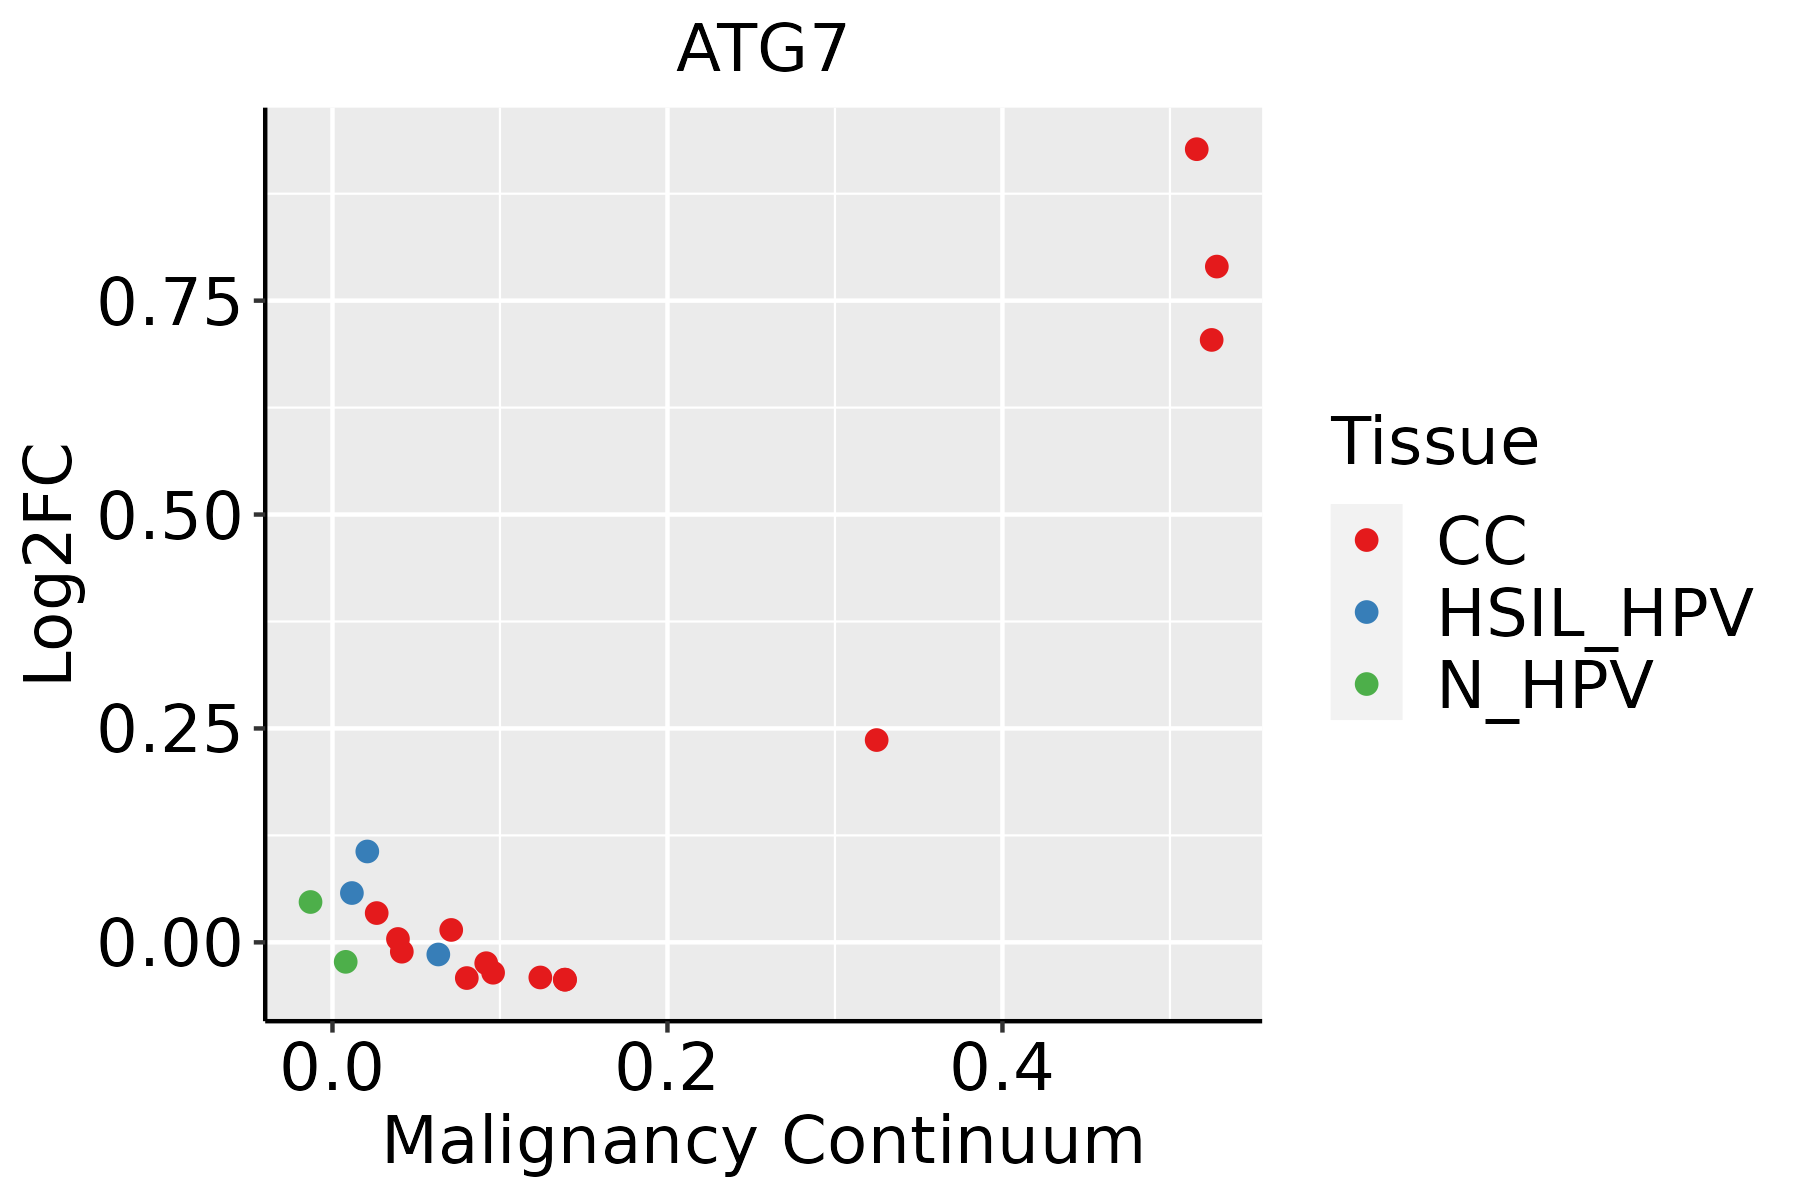 | CC: Cervix cancer |
| HSIL_HPV: HPV-infected high-grade squamous intraepithelial lesions | ||
| N_HPV: HPV-infected normal cervix | ||
| Colorectum (GSE201348) | 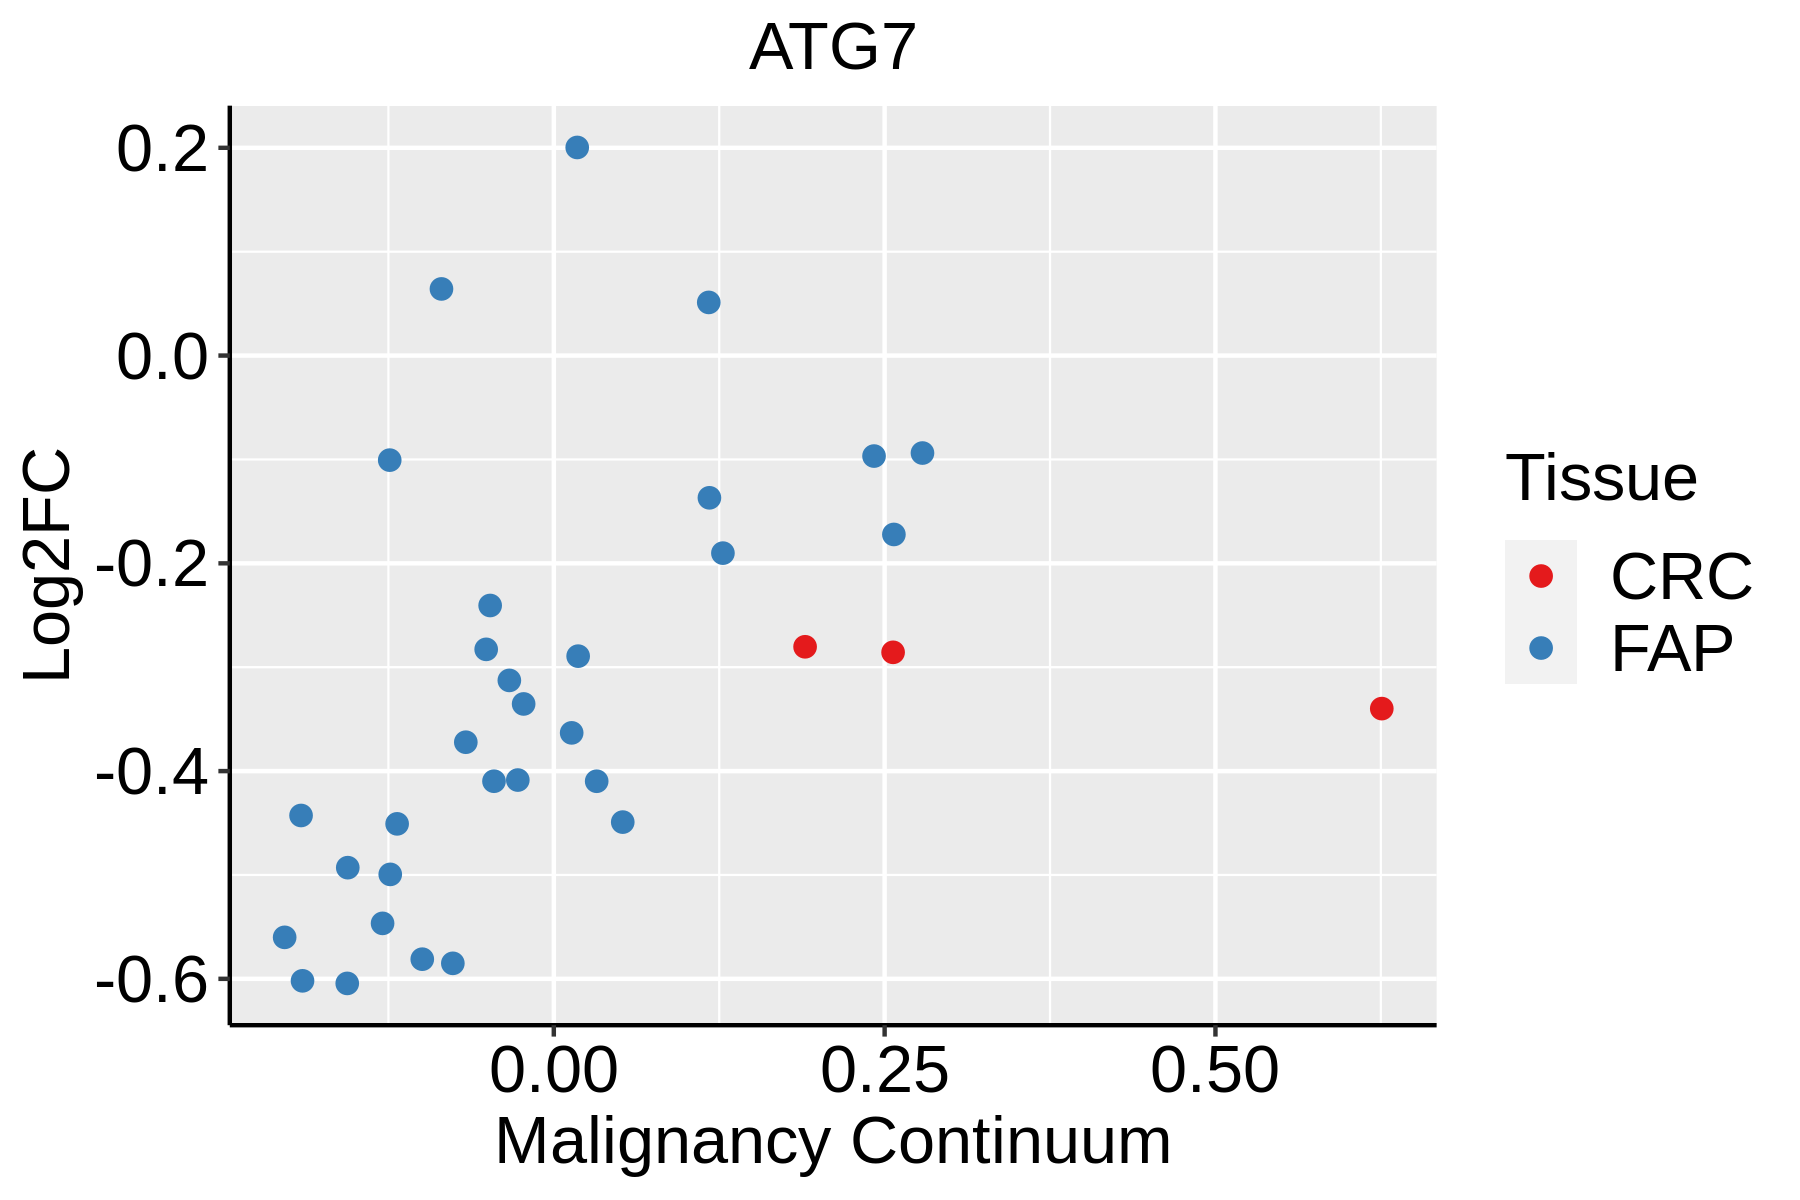 | FAP: Familial adenomatous polyposis |
| CRC: Colorectal cancer | ||
| Colorectum (HTA11) |  | AD: Adenomas |
| SER: Sessile serrated lesions | ||
| MSI-H: Microsatellite-high colorectal cancer | ||
| MSS: Microsatellite stable colorectal cancer | ||
| Endometrium |  | AEH: Atypical endometrial hyperplasia |
| EEC: Endometrioid Cancer | ||
| Lung | 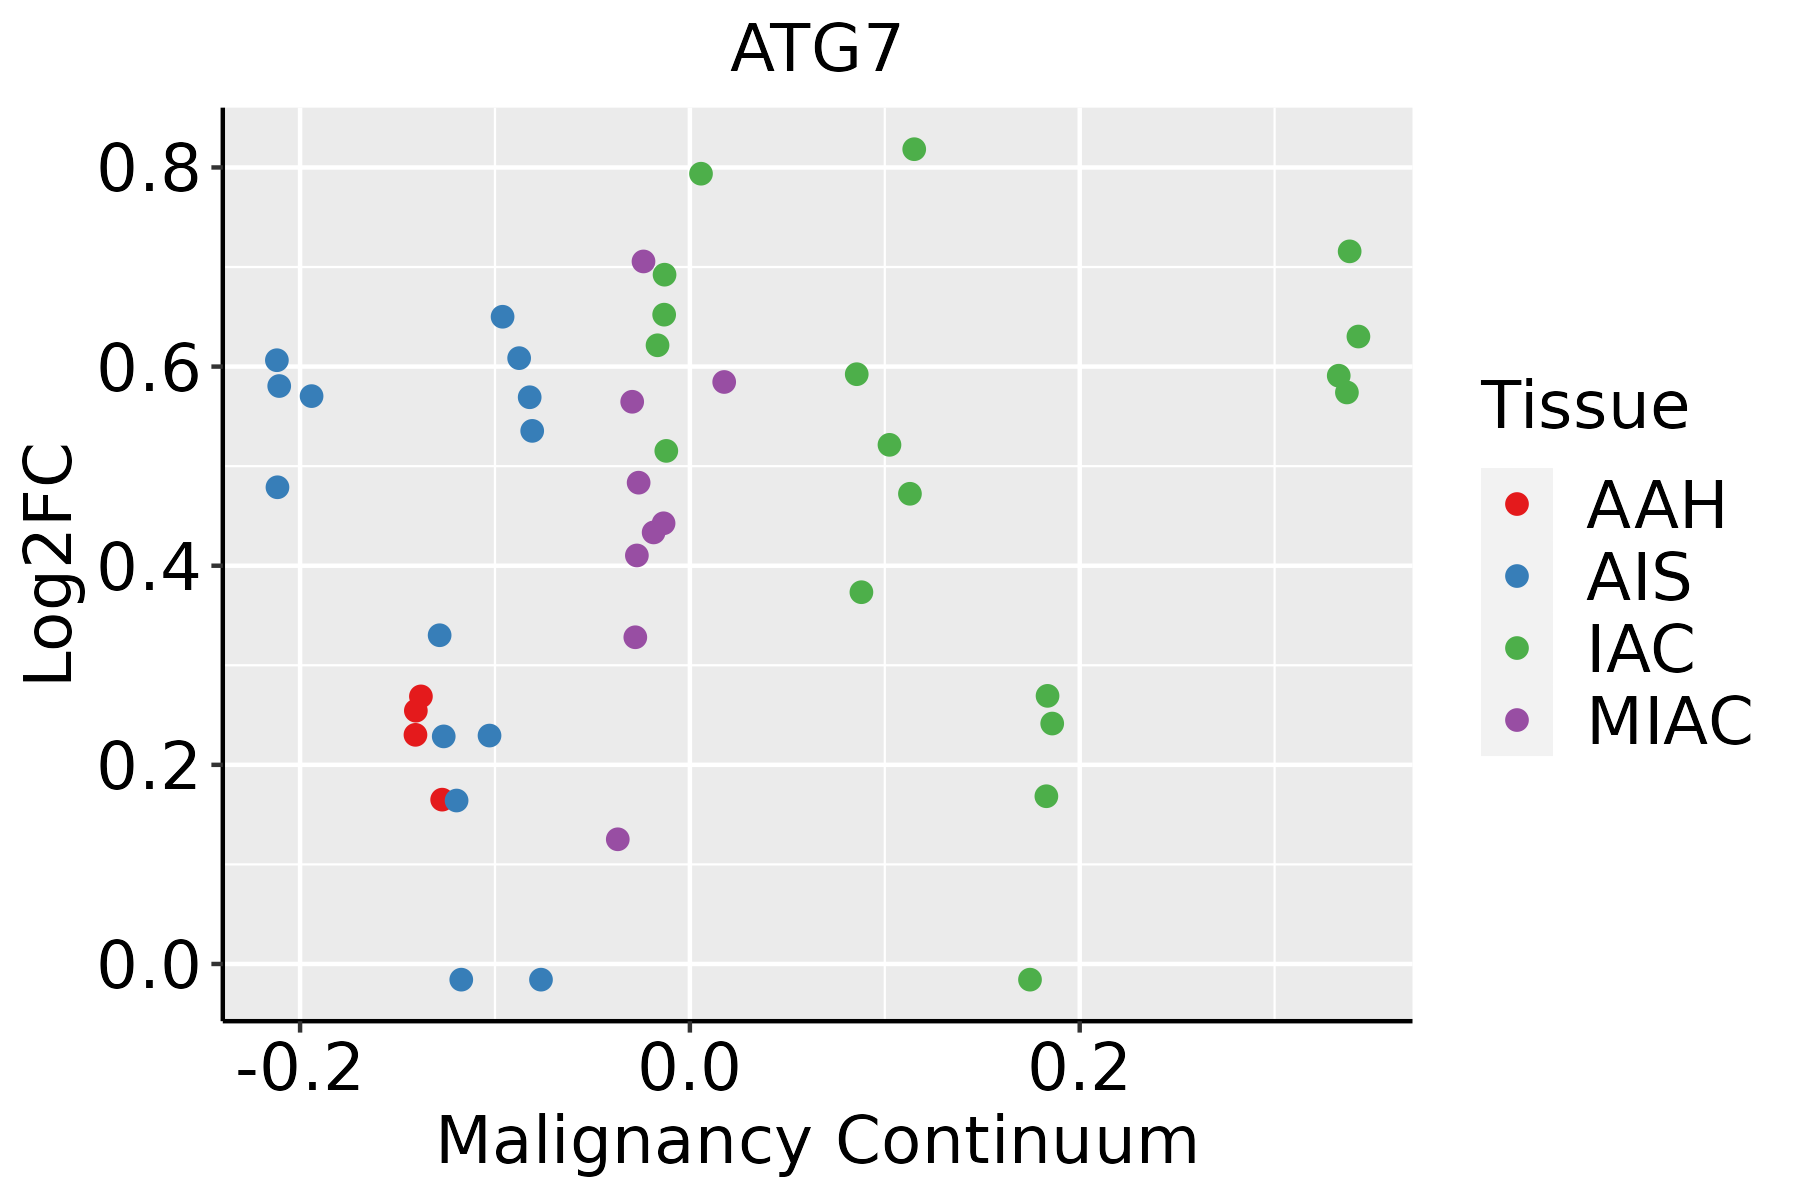 | AAH: Atypical adenomatous hyperplasia |
| AIS: Adenocarcinoma in situ | ||
| IAC: Invasive lung adenocarcinoma | ||
| MIA: Minimally invasive adenocarcinoma |
| ∗log2FC in expression of this searched gene in stem-like cells from each diseased tissue sample relative to stem-like cells in normal samples in each tissue plotted against the malignancy continuum. Samples are colored based on if they are from different disease stage. |
Top |
Malignant transformation related pathway analysis |
| Find out the enriched GO biological processes and KEGG pathways involved in transition from healthy to precancer to cancer |
| Tissue | Disease Stage | Enriched GO biological Processes |
| Colorectum | AD |  |
| Colorectum | SER |  |
| Colorectum | MSS |  |
| Colorectum | MSI-H |  |
| Colorectum | FAP |  |
| ∗Top 15 enriched GO BP terms are showed in the bar plot of each disease state in each tissue. Each row represents a significant GO biological process which is colored according to the -log10(p.adjust). |
| Page: 1 2 3 4 5 6 7 8 9 |
| GO ID | Tissue | Disease Stage | Description | Gene Ratio | Bg Ratio | pvalue | p.adjust | Count |
| GO:0034284 | Colorectum | AD | response to monosaccharide | 76/3918 | 225/18723 | 4.64e-06 | 1.23e-04 | 76 |
| GO:0000422 | Colorectum | AD | autophagy of mitochondrion | 35/3918 | 81/18723 | 4.94e-06 | 1.29e-04 | 35 |
| GO:0061726 | Colorectum | AD | mitochondrion disassembly | 35/3918 | 81/18723 | 4.94e-06 | 1.29e-04 | 35 |
| GO:0048511 | Colorectum | AD | rhythmic process | 94/3918 | 298/18723 | 1.00e-05 | 2.34e-04 | 94 |
| GO:0009746 | Colorectum | AD | response to hexose | 73/3918 | 219/18723 | 1.20e-05 | 2.65e-04 | 73 |
| GO:0031667 | Colorectum | AD | response to nutrient levels | 138/3918 | 474/18723 | 1.22e-05 | 2.68e-04 | 138 |
| GO:1901214 | Colorectum | AD | regulation of neuron death | 99/3918 | 319/18723 | 1.26e-05 | 2.76e-04 | 99 |
| GO:0009749 | Colorectum | AD | response to glucose | 71/3918 | 212/18723 | 1.31e-05 | 2.85e-04 | 71 |
| GO:1901215 | Colorectum | AD | negative regulation of neuron death | 67/3918 | 208/18723 | 8.81e-05 | 1.35e-03 | 67 |
| GO:0042594 | Colorectum | AD | response to starvation | 63/3918 | 197/18723 | 1.77e-04 | 2.38e-03 | 63 |
| GO:0071496 | Colorectum | AD | cellular response to external stimulus | 94/3918 | 320/18723 | 1.98e-04 | 2.64e-03 | 94 |
| GO:0036473 | Colorectum | AD | cell death in response to oxidative stress | 35/3918 | 95/18723 | 2.58e-04 | 3.24e-03 | 35 |
| GO:0010508 | Colorectum | AD | positive regulation of autophagy | 43/3918 | 124/18723 | 2.64e-04 | 3.27e-03 | 43 |
| GO:0007568 | Colorectum | AD | aging | 98/3918 | 339/18723 | 2.77e-04 | 3.39e-03 | 98 |
| GO:1903203 | Colorectum | AD | regulation of oxidative stress-induced neuron death | 14/3918 | 27/18723 | 3.72e-04 | 4.29e-03 | 14 |
| GO:0009267 | Colorectum | AD | cellular response to starvation | 51/3918 | 156/18723 | 3.90e-04 | 4.44e-03 | 51 |
| GO:0070482 | Colorectum | AD | response to oxygen levels | 99/3918 | 347/18723 | 4.29e-04 | 4.82e-03 | 99 |
| GO:1903204 | Colorectum | AD | negative regulation of oxidative stress-induced neuron death | 11/3918 | 19/18723 | 4.66e-04 | 5.15e-03 | 11 |
| GO:0036295 | Colorectum | AD | cellular response to increased oxygen levels | 9/3918 | 14/18723 | 5.43e-04 | 5.79e-03 | 9 |
| GO:0036475 | Colorectum | AD | neuron death in response to oxidative stress | 15/3918 | 31/18723 | 6.02e-04 | 6.33e-03 | 15 |
| Page: 1 2 3 4 5 6 7 8 9 10 11 12 13 14 15 16 17 18 |
| Pathway ID | Tissue | Disease Stage | Description | Gene Ratio | Bg Ratio | pvalue | p.adjust | qvalue | Count |
| hsa0421614 | Cervix | CC | Ferroptosis | 14/1267 | 41/8465 | 1.75e-03 | 7.21e-03 | 4.26e-03 | 14 |
| hsa0421615 | Cervix | CC | Ferroptosis | 14/1267 | 41/8465 | 1.75e-03 | 7.21e-03 | 4.26e-03 | 14 |
| hsa04216 | Colorectum | AD | Ferroptosis | 21/2092 | 41/8465 | 2.23e-04 | 1.78e-03 | 1.13e-03 | 21 |
| hsa04140 | Colorectum | AD | Autophagy - animal | 49/2092 | 141/8465 | 4.58e-03 | 2.20e-02 | 1.40e-02 | 49 |
| hsa042161 | Colorectum | AD | Ferroptosis | 21/2092 | 41/8465 | 2.23e-04 | 1.78e-03 | 1.13e-03 | 21 |
| hsa041401 | Colorectum | AD | Autophagy - animal | 49/2092 | 141/8465 | 4.58e-03 | 2.20e-02 | 1.40e-02 | 49 |
| hsa042164 | Colorectum | FAP | Ferroptosis | 18/1404 | 41/8465 | 3.49e-05 | 3.65e-04 | 2.22e-04 | 18 |
| hsa042165 | Colorectum | FAP | Ferroptosis | 18/1404 | 41/8465 | 3.49e-05 | 3.65e-04 | 2.22e-04 | 18 |
| hsa042166 | Colorectum | CRC | Ferroptosis | 13/1091 | 41/8465 | 1.36e-03 | 1.08e-02 | 7.33e-03 | 13 |
| hsa042167 | Colorectum | CRC | Ferroptosis | 13/1091 | 41/8465 | 1.36e-03 | 1.08e-02 | 7.33e-03 | 13 |
| hsa041407 | Lung | IAC | Autophagy - animal | 28/1053 | 141/8465 | 7.64e-03 | 3.03e-02 | 2.01e-02 | 28 |
| hsa042169 | Lung | IAC | Ferroptosis | 11/1053 | 41/8465 | 9.62e-03 | 3.68e-02 | 2.44e-02 | 11 |
| hsa0414012 | Lung | IAC | Autophagy - animal | 28/1053 | 141/8465 | 7.64e-03 | 3.03e-02 | 2.01e-02 | 28 |
| hsa0421612 | Lung | IAC | Ferroptosis | 11/1053 | 41/8465 | 9.62e-03 | 3.68e-02 | 2.44e-02 | 11 |
| hsa0421622 | Lung | AIS | Ferroptosis | 11/961 | 41/8465 | 4.84e-03 | 2.45e-02 | 1.57e-02 | 11 |
| hsa0414022 | Lung | AIS | Autophagy - animal | 26/961 | 141/8465 | 8.23e-03 | 3.71e-02 | 2.37e-02 | 26 |
| hsa0421632 | Lung | AIS | Ferroptosis | 11/961 | 41/8465 | 4.84e-03 | 2.45e-02 | 1.57e-02 | 11 |
| hsa0414032 | Lung | AIS | Autophagy - animal | 26/961 | 141/8465 | 8.23e-03 | 3.71e-02 | 2.37e-02 | 26 |
| Page: 1 |
Top |
Cell-cell communication analysis |
| Identification of potential cell-cell interactions between two cell types and their ligand-receptor pairs for different disease states |
| Ligand | Receptor | LRpair | Pathway | Tissue | Disease Stage |
| Page: 1 |
Top |
Single-cell gene regulatory network inference analysis |
| Find out the significant the regulons (TFs) and the target genes of each regulon across cell types for different disease states |
| TF | Cell Type | Tissue | Disease Stage | Target Gene | RSS | Regulon Activity |
| ∗The dot plots of a searched regulon are shown for all cell subpopulations in each disease state of each tissue based on the regulon specific score inferred using pySCENIC and by calculating the average expression. |
| Page: 1 |
Top |
Somatic mutation of malignant transformation related genes |
| Annotation of somatic variants for genes involved in malignant transformation |
| Hugo Symbol | Variant Class | Variant Classification | dbSNP RS | HGVSc | HGVSp | HGVSp Short | SWISSPROT | BIOTYPE | SIFT | PolyPhen | Tumor Sample Barcode | Tissue | Histology | Sex | Age | Stage | Therapy Types | Drugs | Outcome |
| ATG7 | SNV | Missense_Mutation | c.589N>T | p.Pro197Ser | p.P197S | O95352 | protein_coding | tolerated(0.12) | benign(0.255) | TCGA-AC-A23H-01 | Breast | breast invasive carcinoma | Female | >=65 | I/II | Unknown | Unknown | PD | |
| ATG7 | SNV | Missense_Mutation | c.2086N>A | p.Asp696Asn | p.D696N | O95352 | protein_coding | deleterious(0.02) | benign(0.03) | TCGA-BH-A0EE-01 | Breast | breast invasive carcinoma | Female | >=65 | I/II | Chemotherapy | docetaxel | SD | |
| ATG7 | SNV | Missense_Mutation | novel | c.469G>A | p.Glu157Lys | p.E157K | O95352 | protein_coding | tolerated(0.16) | benign(0.021) | TCGA-BH-A2L8-01 | Breast | breast invasive carcinoma | Female | <65 | I/II | Chemotherapy | cytoxan | CR |
| ATG7 | SNV | Missense_Mutation | c.1900N>C | p.Asp634His | p.D634H | O95352 | protein_coding | tolerated(0.2) | benign(0.01) | TCGA-C8-A275-01 | Breast | breast invasive carcinoma | Female | <65 | I/II | Unknown | Unknown | SD | |
| ATG7 | SNV | Missense_Mutation | c.1073N>A | p.Cys358Tyr | p.C358Y | O95352 | protein_coding | deleterious(0) | probably_damaging(0.999) | TCGA-D8-A1XQ-01 | Breast | breast invasive carcinoma | Female | >=65 | I/II | Unknown | Unknown | SD | |
| ATG7 | SNV | Missense_Mutation | rs371208293 | c.1070N>G | p.Lys357Arg | p.K357R | O95352 | protein_coding | tolerated(0.83) | benign(0.366) | TCGA-E2-A14N-01 | Breast | breast invasive carcinoma | Female | <65 | I/II | Chemotherapy | cyclophosphamide | SD |
| ATG7 | SNV | Missense_Mutation | c.167C>T | p.Ser56Phe | p.S56F | O95352 | protein_coding | tolerated(0.09) | benign(0.169) | TCGA-GM-A2D9-01 | Breast | breast invasive carcinoma | Female | >=65 | I/II | Hormone Therapy | arimidex | SD | |
| ATG7 | insertion | In_Frame_Ins | novel | c.1214_1215insAAGAAGACACTCATTTTCCTACCGCTT | p.Asp405delinsGluArgArgHisSerPheSerTyrArgPhe | p.D405delinsERRHSFSYRF | O95352 | protein_coding | TCGA-AN-A0FN-01 | Breast | breast invasive carcinoma | Female | <65 | I/II | Unknown | Unknown | SD | ||
| ATG7 | SNV | Missense_Mutation | novel | c.34A>G | p.Lys12Glu | p.K12E | O95352 | protein_coding | tolerated(0.53) | benign(0.046) | TCGA-2W-A8YY-01 | Cervix | cervical & endocervical cancer | Female | <65 | I/II | Chemotherapy | cisplatin | CR |
| ATG7 | SNV | Missense_Mutation | novel | c.794T>G | p.Val265Gly | p.V265G | O95352 | protein_coding | deleterious(0) | probably_damaging(0.968) | TCGA-2W-A8YY-01 | Cervix | cervical & endocervical cancer | Female | <65 | I/II | Chemotherapy | cisplatin | CR |
| Page: 1 2 3 4 5 6 |
Top |
Related drugs of malignant transformation related genes |
| Identification of chemicals and drugs interact with genes involved in malignant transfromation |
| (DGIdb 4.0) |
| Entrez ID | Symbol | Category | Interaction Types | Drug Claim Name | Drug Name | PMIDs |
| Page: 1 |

Copyright 2023-Present -The University of Texas Health Science Center at Houston |