
|
|||||
|
 | |
| |
| |
| |
| |
| |
|
Gene: ASAH1 |
Gene summary for ASAH1 |
| Gene information | Species | Human | Gene symbol | ASAH1 | Gene ID | 427 |
| Gene name | N-acylsphingosine amidohydrolase 1 | |
| Gene Alias | AC | |
| Cytomap | 8p22 | |
| Gene Type | protein-coding | GO ID | GO:0006066 | UniProtAcc | A8K0B6 |
Top |
Malignant transformation analysis |
| Identification of the aberrant gene expression in precancerous and cancerous lesions by comparing the gene expression of stem-like cells in diseased tissues with normal stem cells |
| Entrez ID | Symbol | Replicates | Species | Organ | Tissue | Adj P-value | Log2FC | Malignancy |
| 427 | ASAH1 | GSM4909281 | Human | Breast | IDC | 2.63e-24 | 6.20e-01 | 0.21 |
| 427 | ASAH1 | GSM4909293 | Human | Breast | IDC | 2.09e-17 | 4.86e-01 | 0.1581 |
| 427 | ASAH1 | GSM4909296 | Human | Breast | IDC | 4.66e-06 | 1.66e-01 | 0.1524 |
| 427 | ASAH1 | GSM4909297 | Human | Breast | IDC | 1.14e-04 | -8.20e-02 | 0.1517 |
| 427 | ASAH1 | GSM4909301 | Human | Breast | IDC | 6.83e-39 | 8.25e-01 | 0.1577 |
| 427 | ASAH1 | GSM4909302 | Human | Breast | IDC | 2.90e-08 | 3.82e-01 | 0.1545 |
| 427 | ASAH1 | GSM4909303 | Human | Breast | IDC | 4.33e-02 | 3.63e-01 | 0.0438 |
| 427 | ASAH1 | GSM4909307 | Human | Breast | IDC | 1.68e-27 | 6.90e-01 | 0.1569 |
| 427 | ASAH1 | GSM4909308 | Human | Breast | IDC | 2.54e-57 | 9.44e-01 | 0.158 |
| 427 | ASAH1 | GSM4909309 | Human | Breast | IDC | 6.07e-05 | 2.94e-01 | 0.0483 |
| 427 | ASAH1 | GSM4909311 | Human | Breast | IDC | 3.98e-21 | 5.26e-02 | 0.1534 |
| 427 | ASAH1 | GSM4909312 | Human | Breast | IDC | 1.24e-04 | 2.02e-01 | 0.1552 |
| 427 | ASAH1 | GSM4909313 | Human | Breast | IDC | 2.58e-03 | 2.19e-01 | 0.0391 |
| 427 | ASAH1 | GSM4909317 | Human | Breast | IDC | 9.76e-03 | 2.36e-01 | 0.1355 |
| 427 | ASAH1 | GSM4909319 | Human | Breast | IDC | 6.27e-18 | -2.87e-01 | 0.1563 |
| 427 | ASAH1 | GSM4909321 | Human | Breast | IDC | 1.74e-06 | 4.36e-02 | 0.1559 |
| 427 | ASAH1 | brca2 | Human | Breast | Precancer | 5.62e-08 | 3.39e-01 | -0.024 |
| 427 | ASAH1 | NCCBC11 | Human | Breast | DCIS | 2.97e-02 | 2.68e-01 | 0.1232 |
| 427 | ASAH1 | NCCBC14 | Human | Breast | DCIS | 5.89e-11 | 2.66e-01 | 0.2021 |
| 427 | ASAH1 | NCCBC2 | Human | Breast | DCIS | 5.32e-05 | 1.65e-01 | 0.1554 |
| Page: 1 2 3 4 5 6 7 8 9 10 11 12 |
| Tissue | Expression Dynamics | Abbreviation |
| Breast | 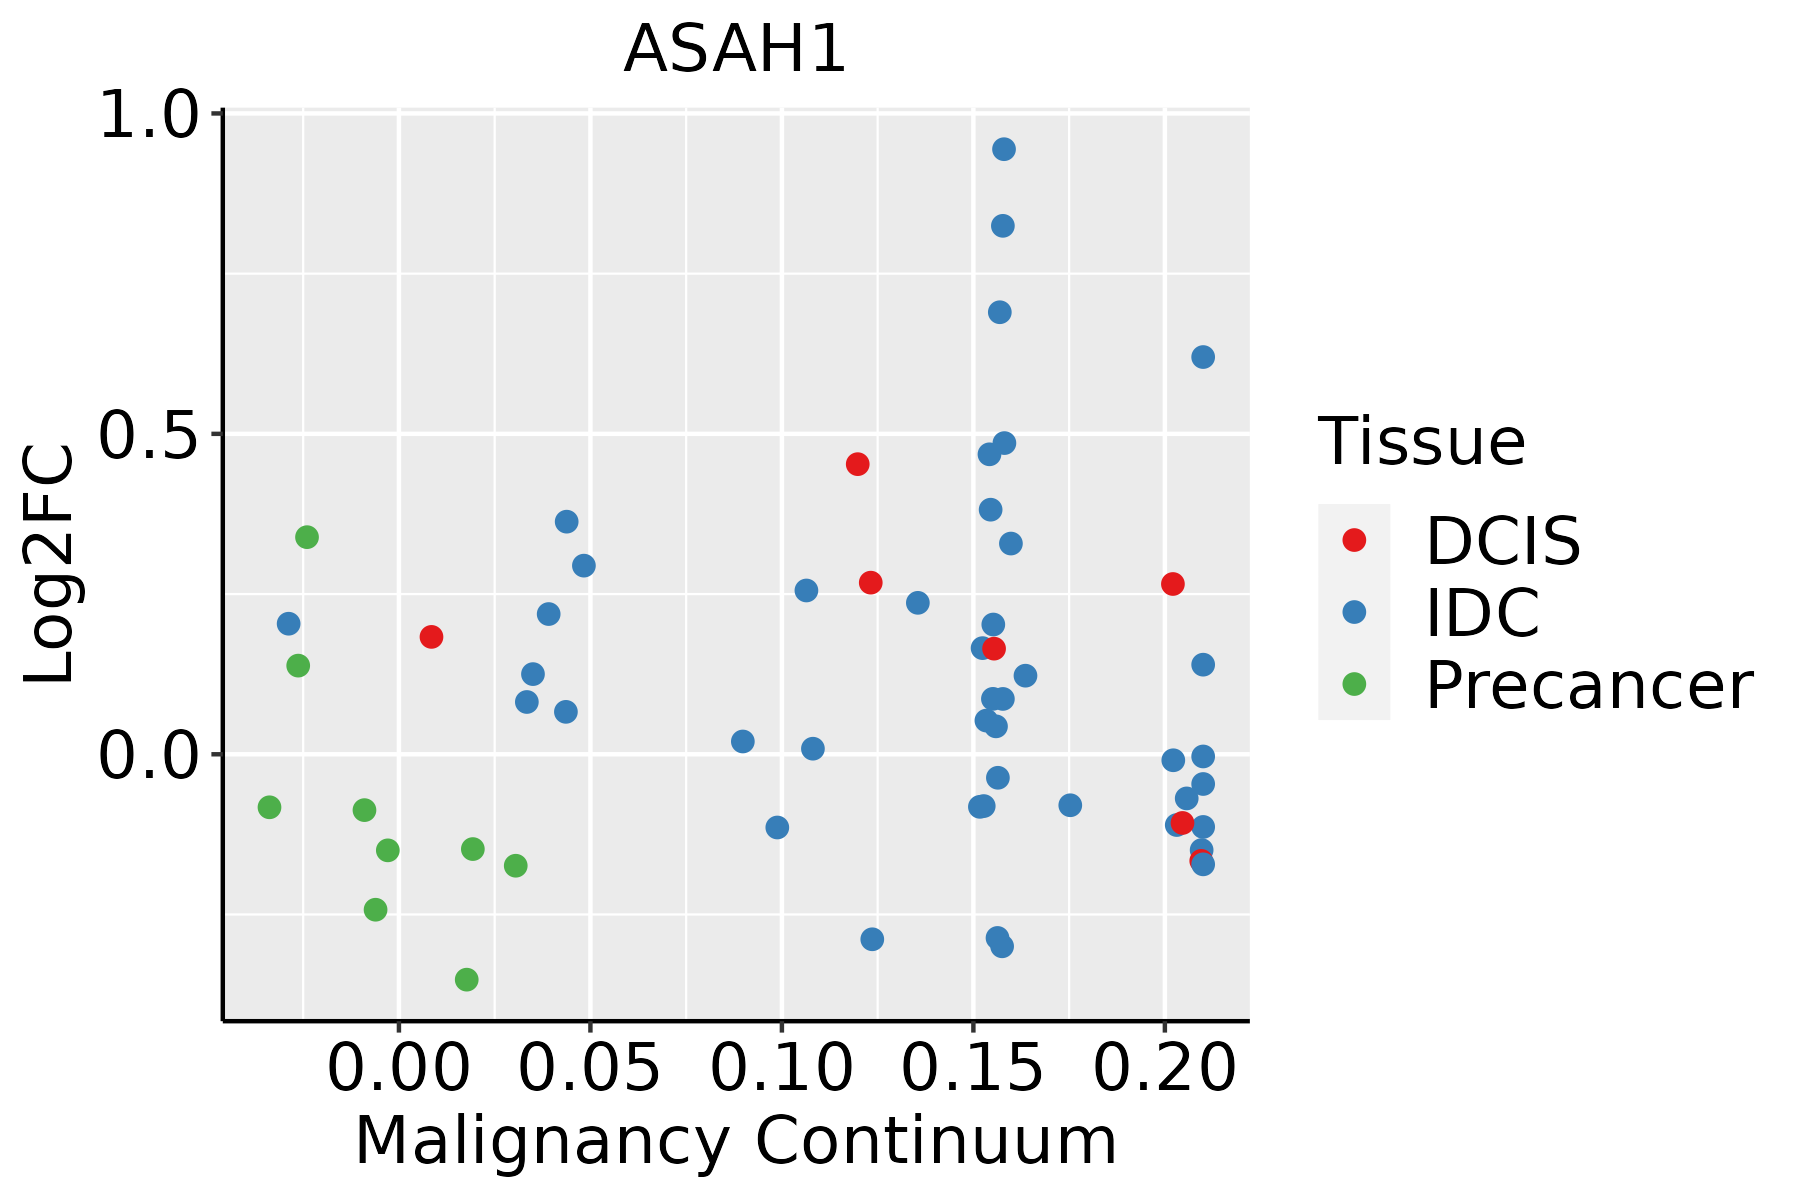 | IDC: Invasive ductal carcinoma |
| DCIS: Ductal carcinoma in situ | ||
| Precancer(BRCA1-mut): Precancerous lesion from BRCA1 mutation carriers | ||
| Cervix | 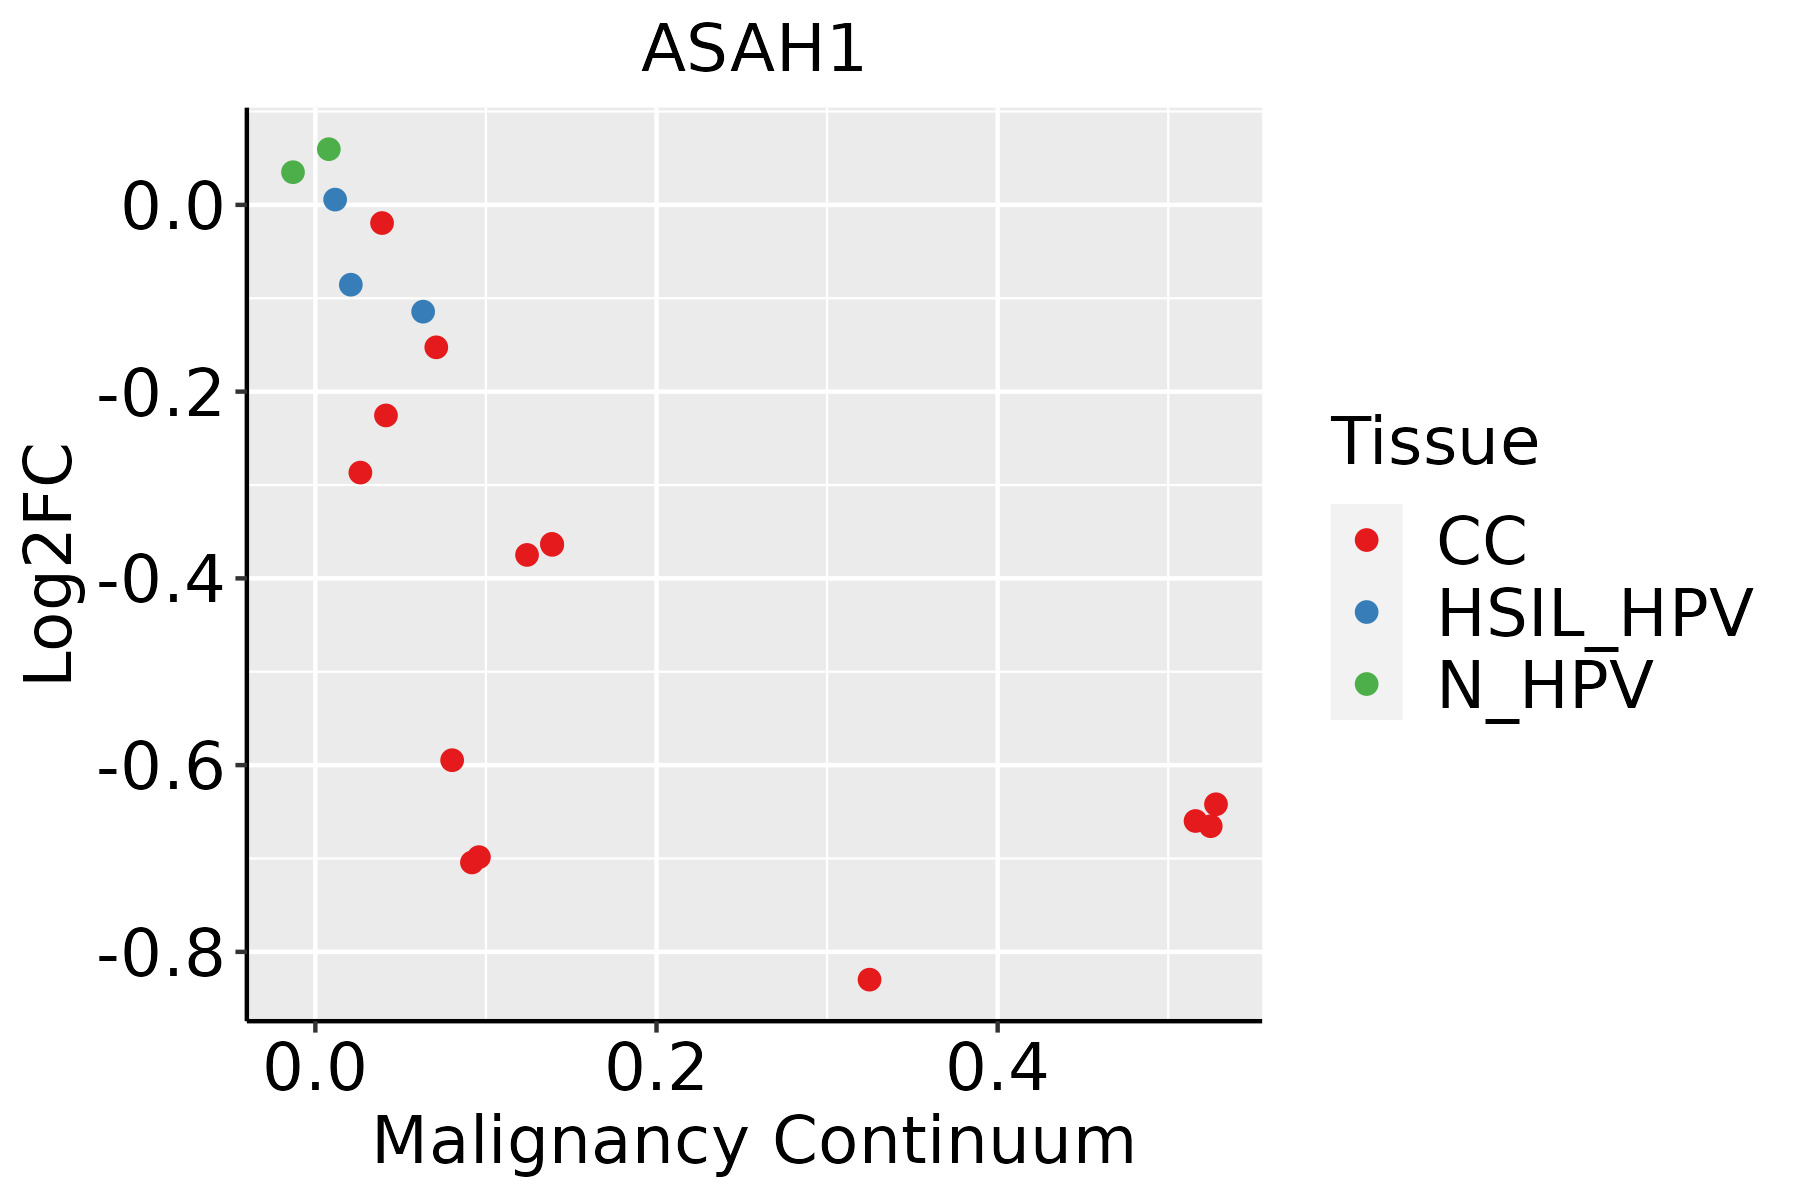 | CC: Cervix cancer |
| HSIL_HPV: HPV-infected high-grade squamous intraepithelial lesions | ||
| N_HPV: HPV-infected normal cervix | ||
| Colorectum (GSE201348) |  | FAP: Familial adenomatous polyposis |
| CRC: Colorectal cancer | ||
| Colorectum (HTA11) |  | AD: Adenomas |
| SER: Sessile serrated lesions | ||
| MSI-H: Microsatellite-high colorectal cancer | ||
| MSS: Microsatellite stable colorectal cancer | ||
| Endometrium |  | AEH: Atypical endometrial hyperplasia |
| EEC: Endometrioid Cancer | ||
| Esophagus | 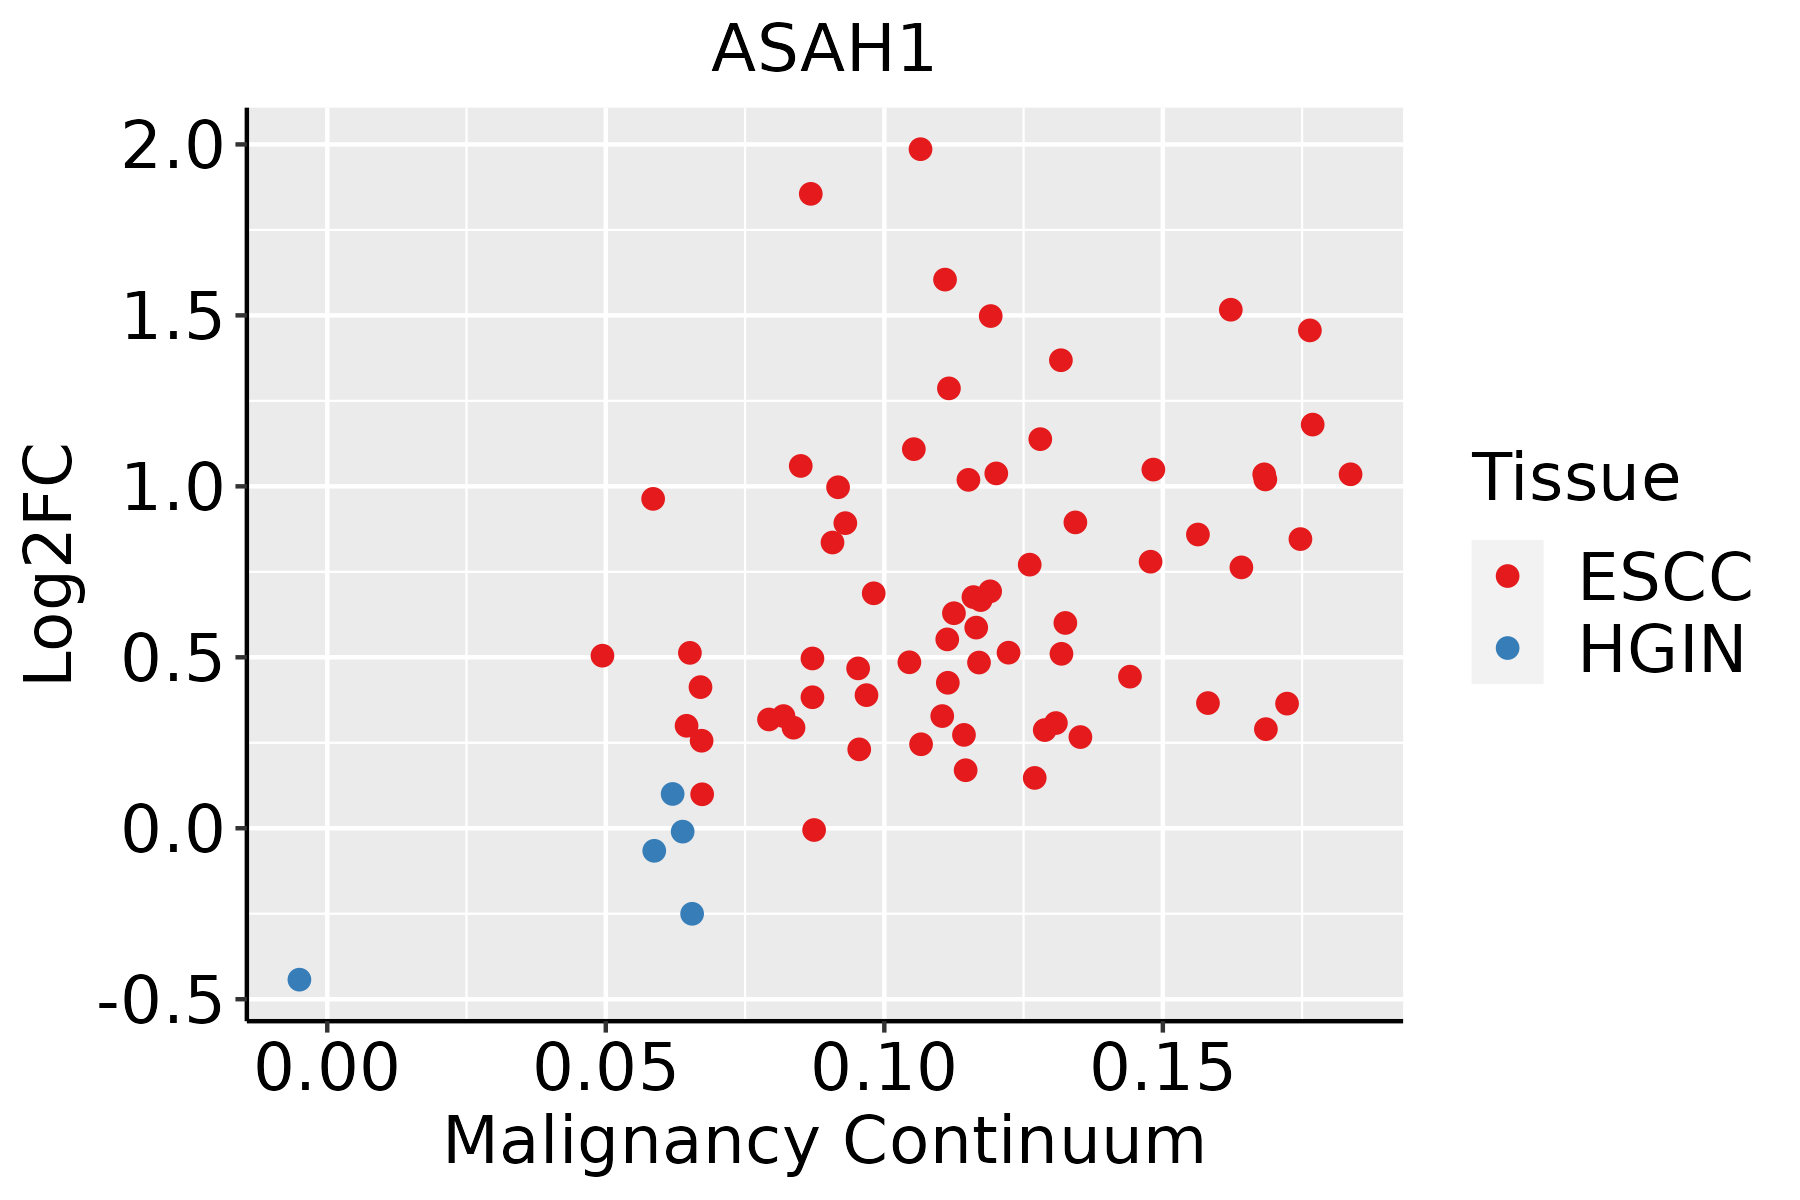 | ESCC: Esophageal squamous cell carcinoma |
| HGIN: High-grade intraepithelial neoplasias | ||
| LGIN: Low-grade intraepithelial neoplasias | ||
| Liver | 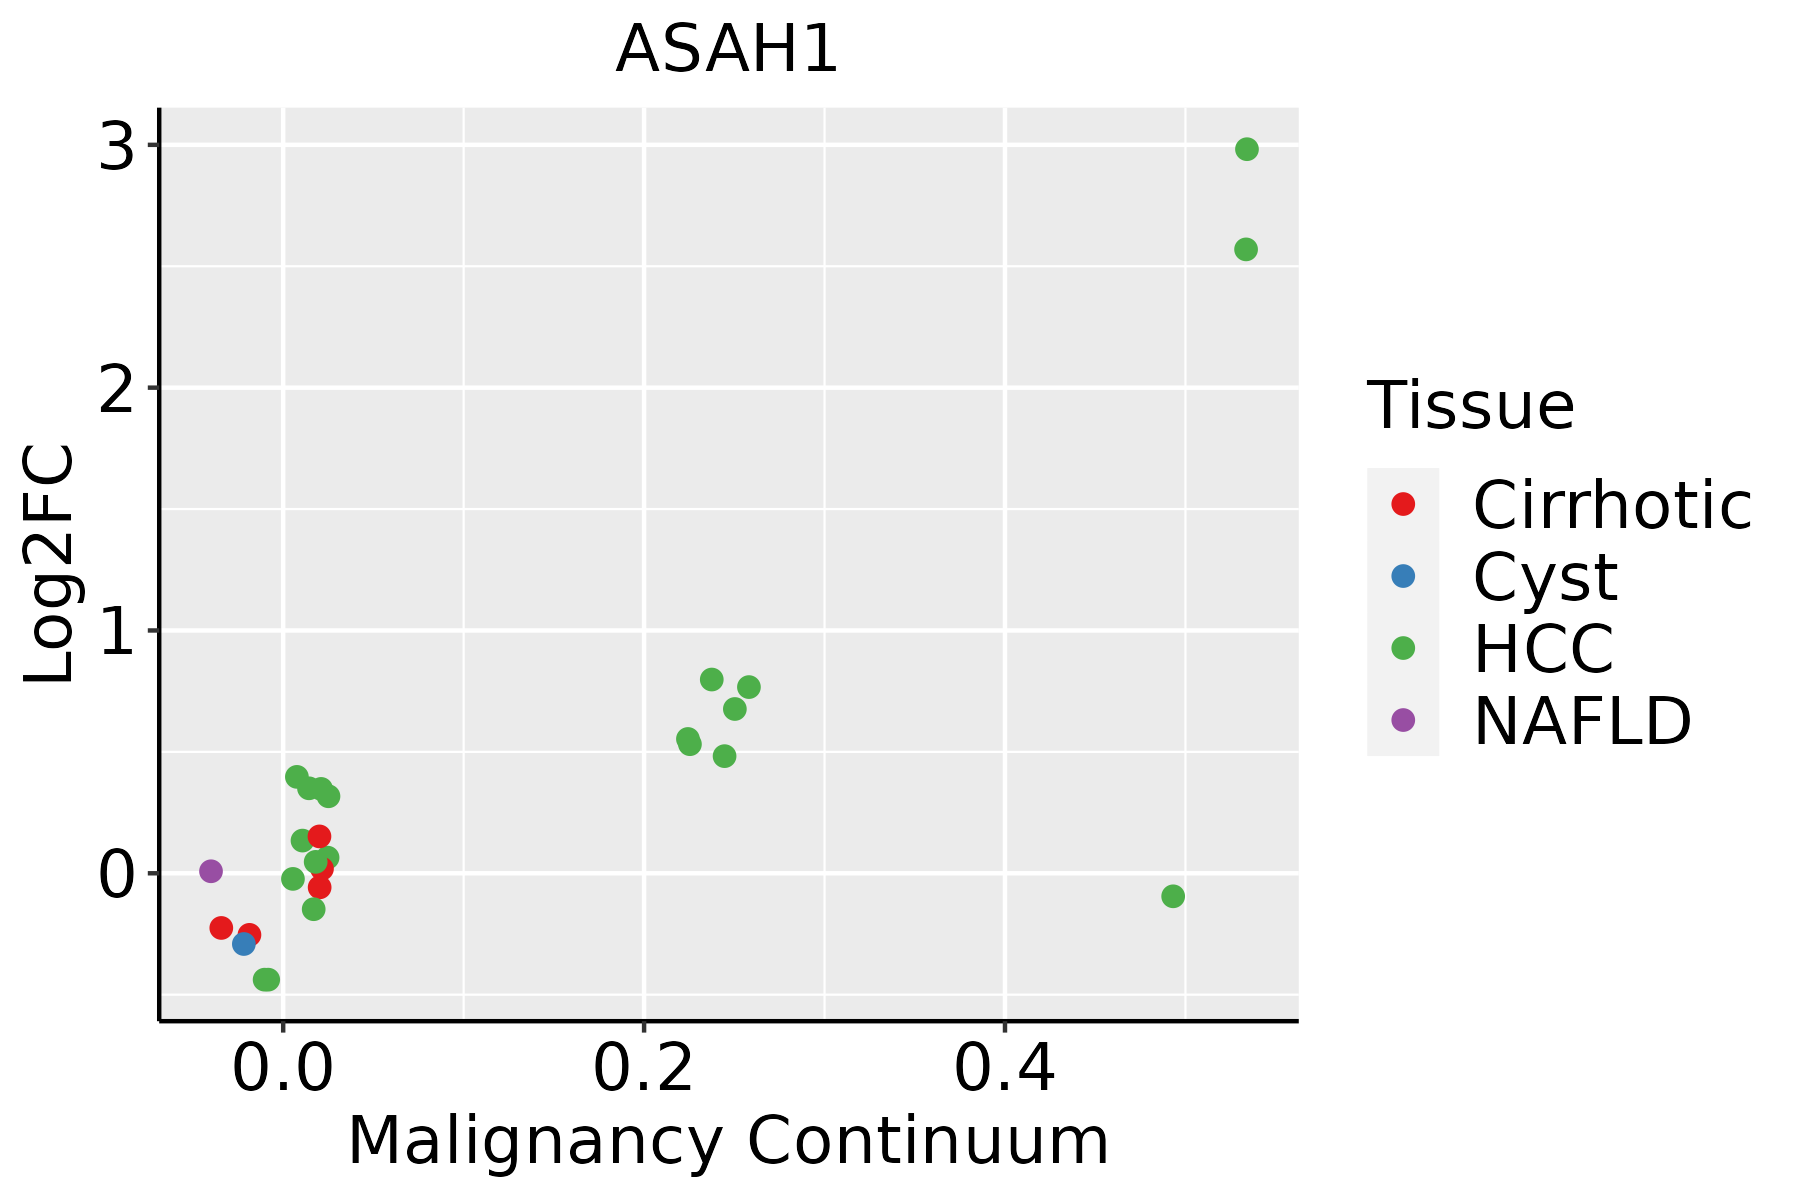 | HCC: Hepatocellular carcinoma |
| NAFLD: Non-alcoholic fatty liver disease | ||
| Lung | 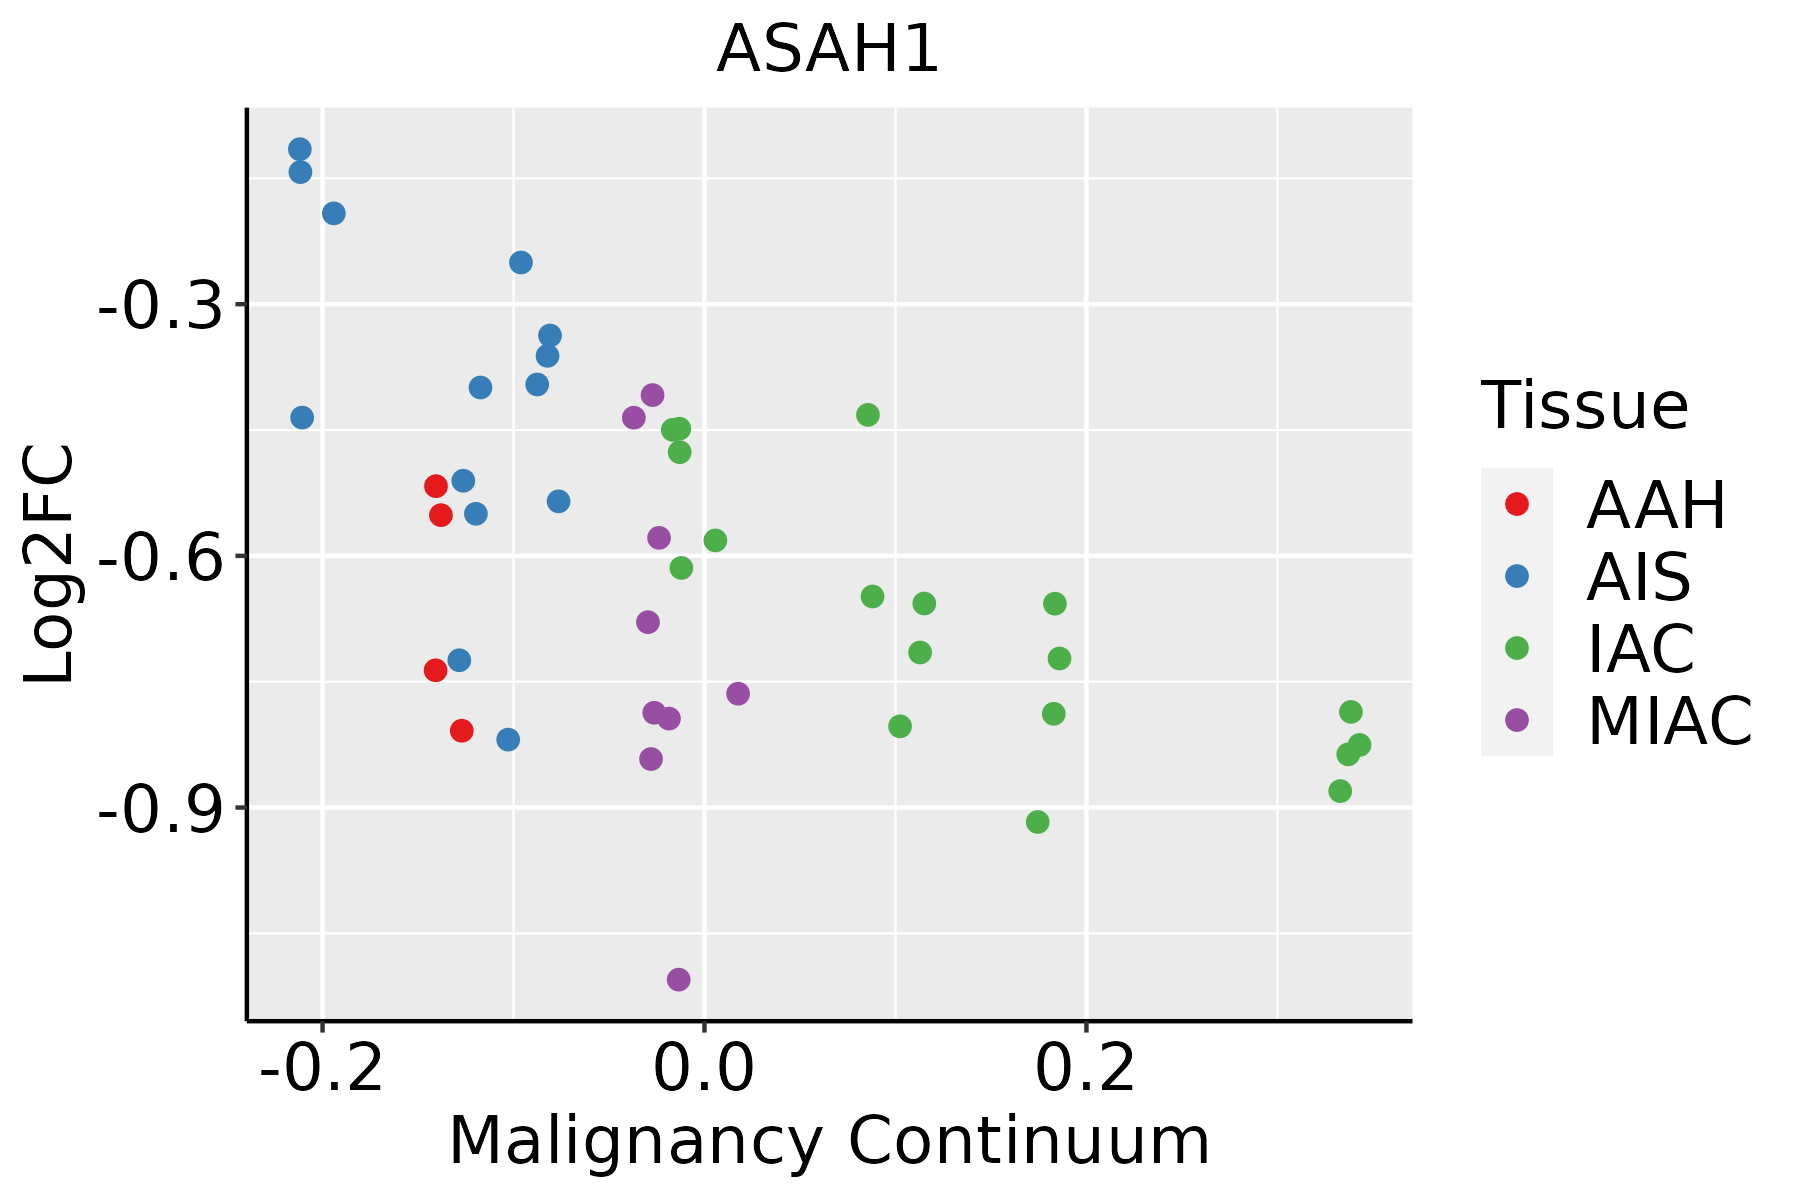 | AAH: Atypical adenomatous hyperplasia |
| AIS: Adenocarcinoma in situ | ||
| IAC: Invasive lung adenocarcinoma | ||
| MIA: Minimally invasive adenocarcinoma | ||
| Oral Cavity | 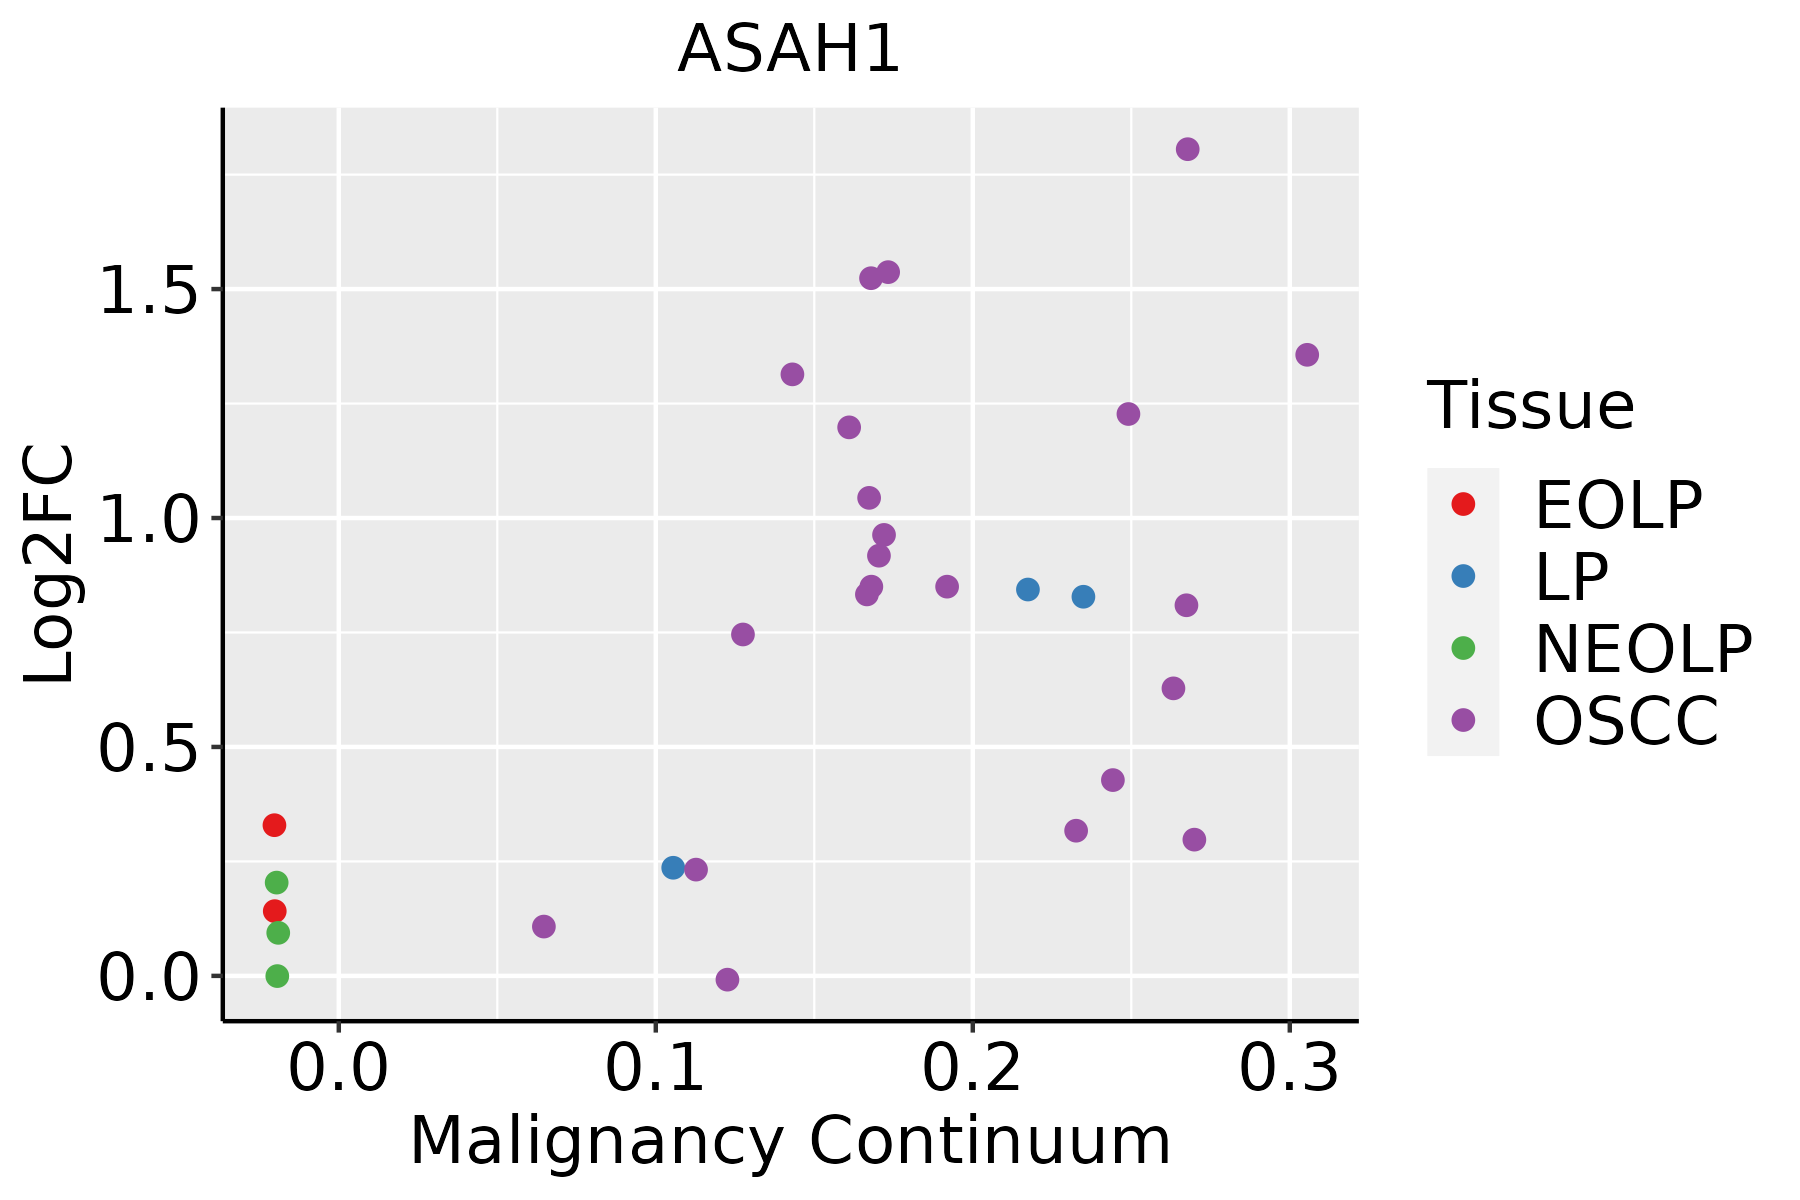 | EOLP: Erosive Oral lichen planus |
| LP: leukoplakia | ||
| NEOLP: Non-erosive oral lichen planus | ||
| OSCC: Oral squamous cell carcinoma | ||
| Prostate | 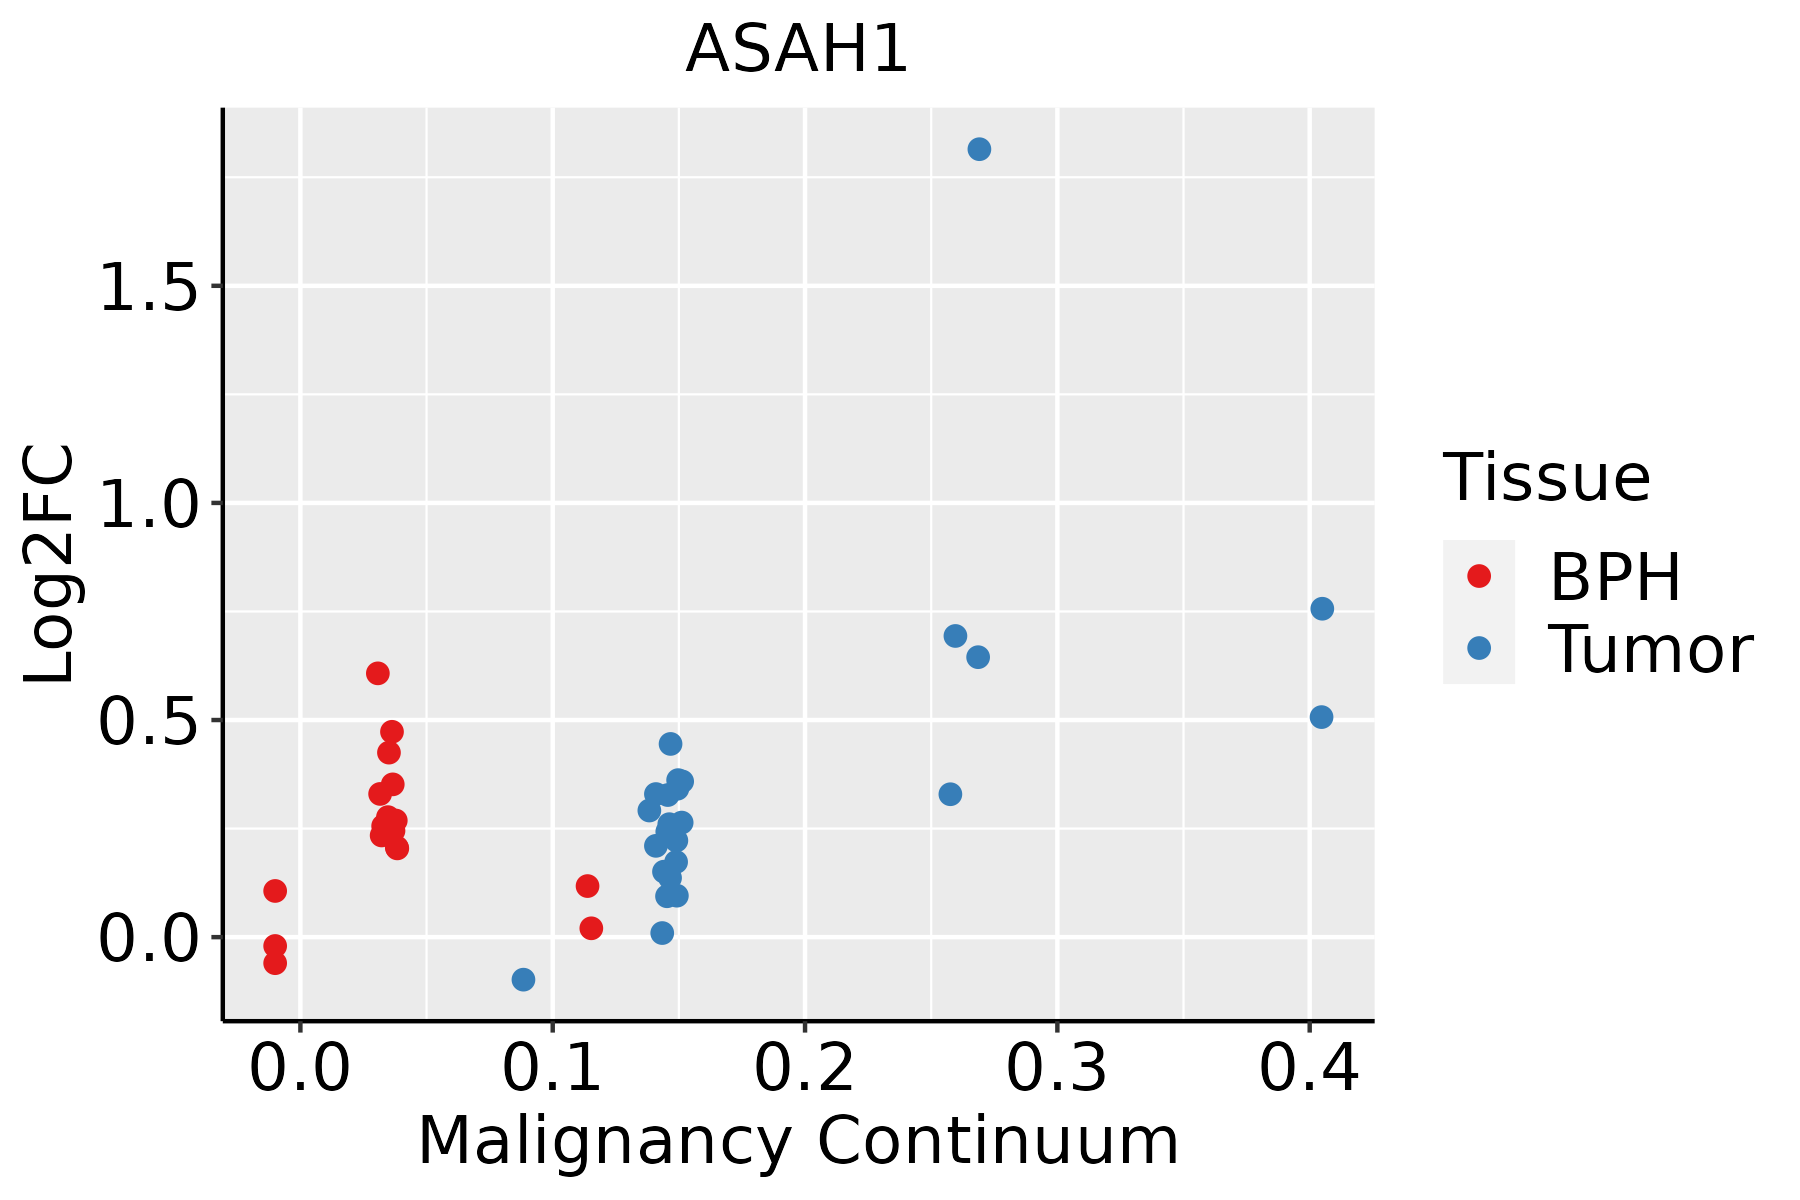 | BPH: Benign Prostatic Hyperplasia |
| Skin | 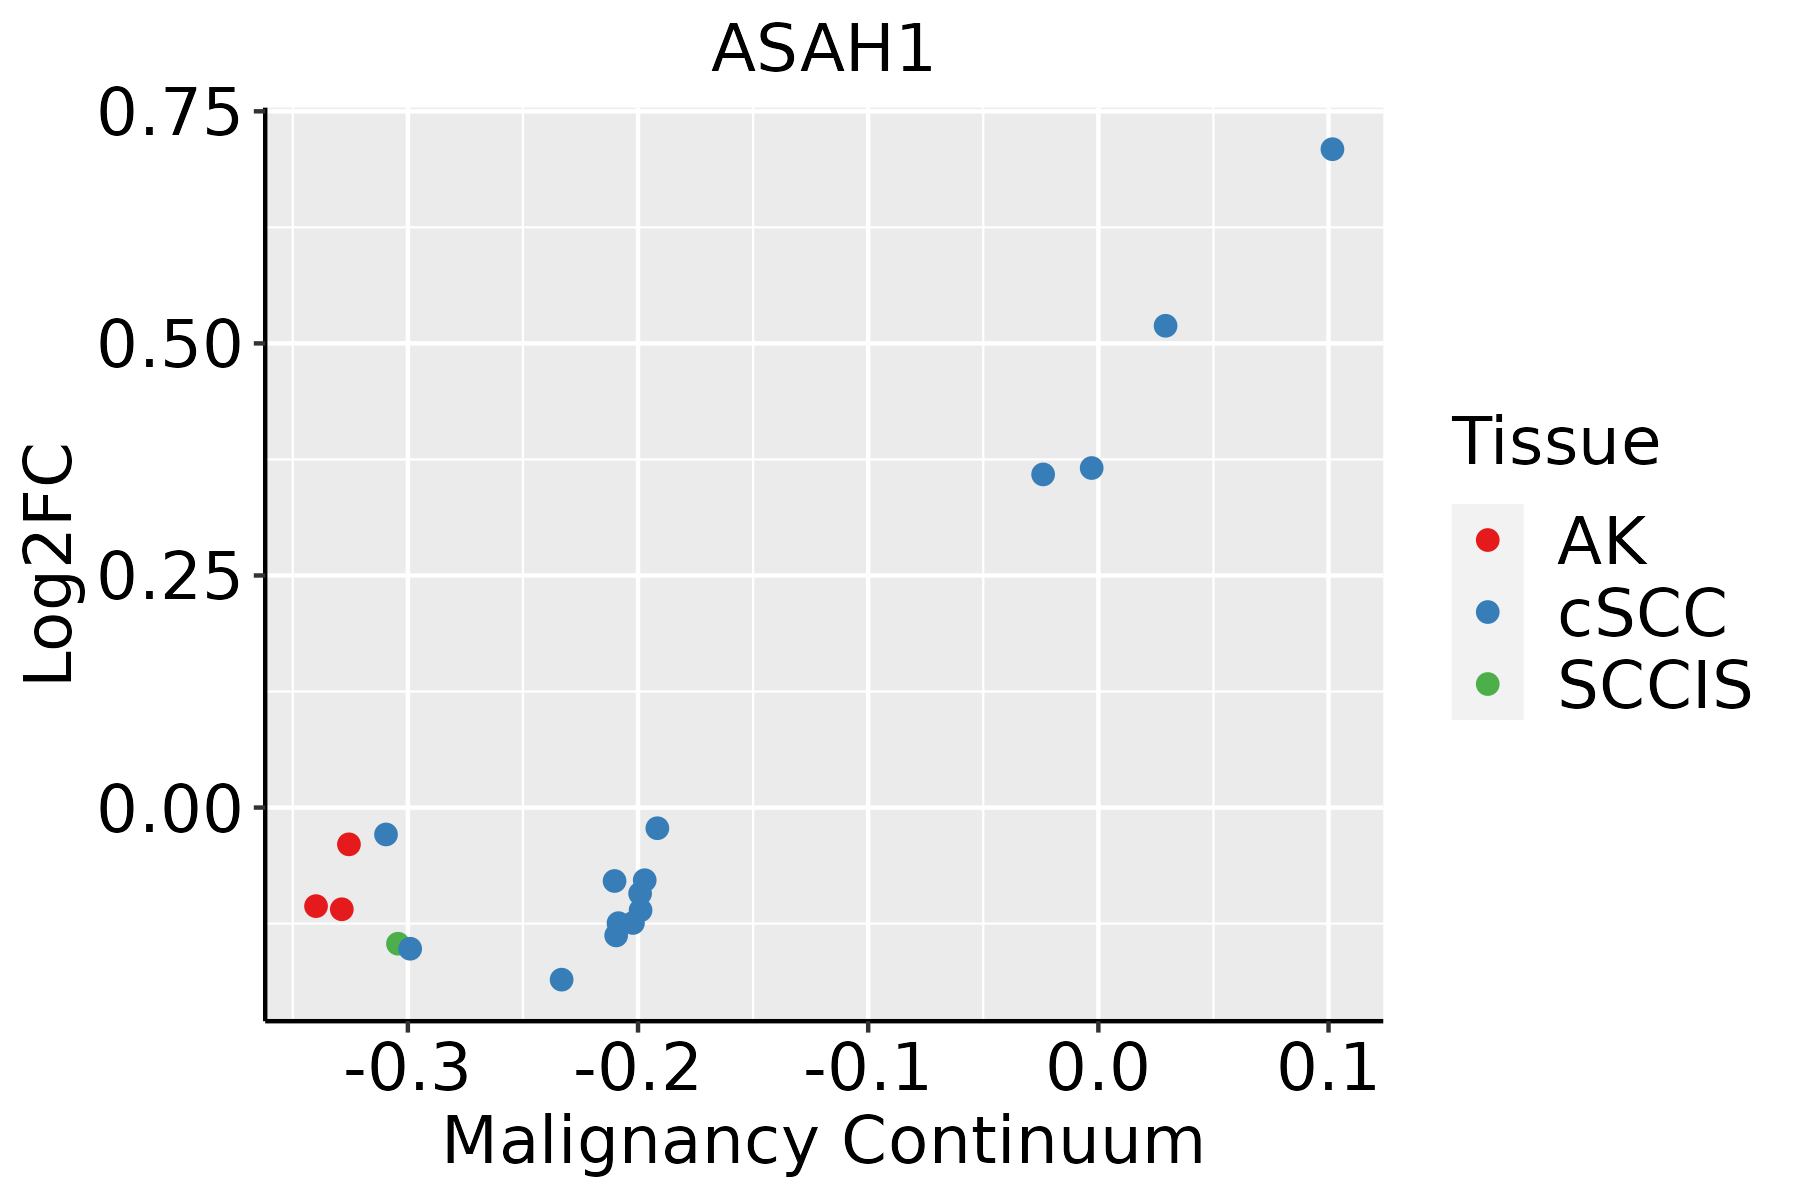 | AK: Actinic keratosis |
| cSCC: Cutaneous squamous cell carcinoma | ||
| SCCIS:squamous cell carcinoma in situ | ||
| Thyroid |  | ATC: Anaplastic thyroid cancer |
| HT: Hashimoto's thyroiditis | ||
| PTC: Papillary thyroid cancer |
| ∗log2FC in expression of this searched gene in stem-like cells from each diseased tissue sample relative to stem-like cells in normal samples in each tissue plotted against the malignancy continuum. Samples are colored based on if they are from different disease stage. |
Top |
Malignant transformation related pathway analysis |
| Find out the enriched GO biological processes and KEGG pathways involved in transition from healthy to precancer to cancer |
| Tissue | Disease Stage | Enriched GO biological Processes |
| Colorectum | AD |  |
| Colorectum | SER |  |
| Colorectum | MSS |  |
| Colorectum | MSI-H |  |
| Colorectum | FAP |  |
| ∗Top 15 enriched GO BP terms are showed in the bar plot of each disease state in each tissue. Each row represents a significant GO biological process which is colored according to the -log10(p.adjust). |
| Page: 1 2 3 4 5 6 7 8 9 |
| GO ID | Tissue | Disease Stage | Description | Gene Ratio | Bg Ratio | pvalue | p.adjust | Count |
| GO:00066314 | Colorectum | CRC | fatty acid metabolic process | 65/2078 | 390/18723 | 5.30e-04 | 7.42e-03 | 65 |
| GO:00435881 | Colorectum | CRC | skin development | 47/2078 | 263/18723 | 6.63e-04 | 8.74e-03 | 47 |
| GO:00099133 | Colorectum | CRC | epidermal cell differentiation | 37/2078 | 202/18723 | 1.50e-03 | 1.59e-02 | 37 |
| GO:00160424 | Colorectum | CRC | lipid catabolic process | 53/2078 | 320/18723 | 1.89e-03 | 1.93e-02 | 53 |
| GO:00060664 | Colorectum | CRC | alcohol metabolic process | 57/2078 | 353/18723 | 2.37e-03 | 2.27e-02 | 57 |
| GO:00442423 | Colorectum | CRC | cellular lipid catabolic process | 37/2078 | 214/18723 | 4.16e-03 | 3.40e-02 | 37 |
| GO:00465191 | Colorectum | CRC | sphingoid metabolic process | 7/2078 | 21/18723 | 5.85e-03 | 4.32e-02 | 7 |
| GO:0019751 | Colorectum | CRC | polyol metabolic process | 22/2078 | 114/18723 | 6.73e-03 | 4.77e-02 | 22 |
| GO:007135610 | Endometrium | AEH | cellular response to tumor necrosis factor | 41/2100 | 229/18723 | 1.66e-03 | 1.36e-02 | 41 |
| GO:003461210 | Endometrium | AEH | response to tumor necrosis factor | 44/2100 | 253/18723 | 2.08e-03 | 1.61e-02 | 44 |
| GO:00435885 | Endometrium | AEH | skin development | 45/2100 | 263/18723 | 2.58e-03 | 1.90e-02 | 45 |
| GO:00192165 | Endometrium | AEH | regulation of lipid metabolic process | 53/2100 | 331/18723 | 4.86e-03 | 3.07e-02 | 53 |
| GO:00085447 | Endometrium | AEH | epidermis development | 52/2100 | 324/18723 | 5.00e-03 | 3.14e-02 | 52 |
| GO:007135615 | Endometrium | EEC | cellular response to tumor necrosis factor | 45/2168 | 229/18723 | 2.54e-04 | 2.94e-03 | 45 |
| GO:003461215 | Endometrium | EEC | response to tumor necrosis factor | 48/2168 | 253/18723 | 3.77e-04 | 4.03e-03 | 48 |
| GO:004358814 | Endometrium | EEC | skin development | 45/2168 | 263/18723 | 4.69e-03 | 2.99e-02 | 45 |
| GO:001921613 | Endometrium | EEC | regulation of lipid metabolic process | 54/2168 | 331/18723 | 5.82e-03 | 3.49e-02 | 54 |
| GO:000854414 | Endometrium | EEC | epidermis development | 53/2168 | 324/18723 | 5.92e-03 | 3.54e-02 | 53 |
| GO:00109393 | Endometrium | EEC | regulation of necrotic cell death | 11/2168 | 42/18723 | 6.93e-03 | 3.98e-02 | 11 |
| GO:00435888 | Esophagus | ESCC | skin development | 163/8552 | 263/18723 | 6.48e-08 | 1.14e-06 | 163 |
| Page: 1 2 3 4 5 6 7 8 9 10 11 12 |
| Pathway ID | Tissue | Disease Stage | Description | Gene Ratio | Bg Ratio | pvalue | p.adjust | qvalue | Count |
| hsa04071 | Colorectum | AD | Sphingolipid signaling pathway | 43/2092 | 121/8465 | 4.83e-03 | 2.28e-02 | 1.45e-02 | 43 |
| hsa040711 | Colorectum | AD | Sphingolipid signaling pathway | 43/2092 | 121/8465 | 4.83e-03 | 2.28e-02 | 1.45e-02 | 43 |
| hsa040712 | Colorectum | MSS | Sphingolipid signaling pathway | 40/1875 | 121/8465 | 3.56e-03 | 1.64e-02 | 1.01e-02 | 40 |
| hsa040713 | Colorectum | MSS | Sphingolipid signaling pathway | 40/1875 | 121/8465 | 3.56e-03 | 1.64e-02 | 1.01e-02 | 40 |
| hsa040714 | Colorectum | FAP | Sphingolipid signaling pathway | 34/1404 | 121/8465 | 9.53e-04 | 5.22e-03 | 3.17e-03 | 34 |
| hsa040715 | Colorectum | FAP | Sphingolipid signaling pathway | 34/1404 | 121/8465 | 9.53e-04 | 5.22e-03 | 3.17e-03 | 34 |
| hsa040716 | Colorectum | CRC | Sphingolipid signaling pathway | 30/1091 | 121/8465 | 2.49e-04 | 3.09e-03 | 2.09e-03 | 30 |
| hsa040717 | Colorectum | CRC | Sphingolipid signaling pathway | 30/1091 | 121/8465 | 2.49e-04 | 3.09e-03 | 2.09e-03 | 30 |
| hsa0414222 | Esophagus | ESCC | Lysosome | 102/4205 | 132/8465 | 5.11e-11 | 7.13e-10 | 3.65e-10 | 102 |
| hsa0407116 | Esophagus | ESCC | Sphingolipid signaling pathway | 85/4205 | 121/8465 | 3.04e-06 | 1.73e-05 | 8.84e-06 | 85 |
| hsa006003 | Esophagus | ESCC | Sphingolipid metabolism | 36/4205 | 53/8465 | 5.41e-03 | 1.36e-02 | 6.99e-03 | 36 |
| hsa0414232 | Esophagus | ESCC | Lysosome | 102/4205 | 132/8465 | 5.11e-11 | 7.13e-10 | 3.65e-10 | 102 |
| hsa0407117 | Esophagus | ESCC | Sphingolipid signaling pathway | 85/4205 | 121/8465 | 3.04e-06 | 1.73e-05 | 8.84e-06 | 85 |
| hsa0060012 | Esophagus | ESCC | Sphingolipid metabolism | 36/4205 | 53/8465 | 5.41e-03 | 1.36e-02 | 6.99e-03 | 36 |
| hsa041424 | Liver | Cirrhotic | Lysosome | 68/2530 | 132/8465 | 1.34e-07 | 1.97e-06 | 1.21e-06 | 68 |
| hsa0414211 | Liver | Cirrhotic | Lysosome | 68/2530 | 132/8465 | 1.34e-07 | 1.97e-06 | 1.21e-06 | 68 |
| hsa041422 | Liver | HCC | Lysosome | 100/4020 | 132/8465 | 2.32e-11 | 4.31e-10 | 2.40e-10 | 100 |
| hsa040718 | Liver | HCC | Sphingolipid signaling pathway | 72/4020 | 121/8465 | 5.01e-03 | 1.47e-02 | 8.18e-03 | 72 |
| hsa00600 | Liver | HCC | Sphingolipid metabolism | 34/4020 | 53/8465 | 1.06e-02 | 2.71e-02 | 1.51e-02 | 34 |
| hsa041423 | Liver | HCC | Lysosome | 100/4020 | 132/8465 | 2.32e-11 | 4.31e-10 | 2.40e-10 | 100 |
| Page: 1 2 |
Top |
Cell-cell communication analysis |
| Identification of potential cell-cell interactions between two cell types and their ligand-receptor pairs for different disease states |
| Ligand | Receptor | LRpair | Pathway | Tissue | Disease Stage |
| Page: 1 |
Top |
Single-cell gene regulatory network inference analysis |
| Find out the significant the regulons (TFs) and the target genes of each regulon across cell types for different disease states |
| TF | Cell Type | Tissue | Disease Stage | Target Gene | RSS | Regulon Activity |
| ∗The dot plots of a searched regulon are shown for all cell subpopulations in each disease state of each tissue based on the regulon specific score inferred using pySCENIC and by calculating the average expression. |
| Page: 1 |
Top |
Somatic mutation of malignant transformation related genes |
| Annotation of somatic variants for genes involved in malignant transformation |
| Hugo Symbol | Variant Class | Variant Classification | dbSNP RS | HGVSc | HGVSp | HGVSp Short | SWISSPROT | BIOTYPE | SIFT | PolyPhen | Tumor Sample Barcode | Tissue | Histology | Sex | Age | Stage | Therapy Types | Drugs | Outcome |
| ASAH1 | SNV | Missense_Mutation | c.1199N>G | p.Tyr400Cys | p.Y400C | Q13510 | protein_coding | deleterious(0) | probably_damaging(0.959) | TCGA-2W-A8YY-01 | Cervix | cervical & endocervical cancer | Female | <65 | I/II | Chemotherapy | cisplatin | CR | |
| ASAH1 | SNV | Missense_Mutation | c.1087N>A | p.Glu363Lys | p.E363K | Q13510 | protein_coding | tolerated(0.65) | benign(0.011) | TCGA-EA-A50E-01 | Cervix | cervical & endocervical cancer | Female | <65 | I/II | Unknown | Unknown | PD | |
| ASAH1 | SNV | Missense_Mutation | c.143N>A | p.Arg48Lys | p.R48K | Q13510 | protein_coding | tolerated(0.25) | benign(0.07) | TCGA-EK-A3GK-01 | Cervix | cervical & endocervical cancer | Female | <65 | I/II | Unknown | Unknown | SD | |
| ASAH1 | SNV | Missense_Mutation | c.284N>A | p.Ser95Tyr | p.S95Y | Q13510 | protein_coding | tolerated(0.53) | benign(0.007) | TCGA-A6-5666-01 | Colorectum | colon adenocarcinoma | Male | >=65 | I/II | Unknown | Unknown | PD | |
| ASAH1 | SNV | Missense_Mutation | c.341N>G | p.Asp114Gly | p.D114G | Q13510 | protein_coding | deleterious(0) | possibly_damaging(0.723) | TCGA-A6-6780-01 | Colorectum | colon adenocarcinoma | Male | >=65 | I/II | Unknown | Unknown | SD | |
| ASAH1 | SNV | Missense_Mutation | rs373012279 | c.1217N>G | p.Asp406Gly | p.D406G | Q13510 | protein_coding | tolerated(0.27) | benign(0.03) | TCGA-AA-3715-01 | Colorectum | colon adenocarcinoma | Male | >=65 | I/II | Unknown | Unknown | PD |
| ASAH1 | SNV | Missense_Mutation | novel | c.849G>T | p.Lys283Asn | p.K283N | Q13510 | protein_coding | deleterious(0.03) | possibly_damaging(0.726) | TCGA-AA-A010-01 | Colorectum | colon adenocarcinoma | Female | <65 | I/II | Chemotherapy | folinic | CR |
| ASAH1 | SNV | Missense_Mutation | novel | c.547N>A | p.Leu183Ile | p.L183I | Q13510 | protein_coding | tolerated(0.09) | benign(0.347) | TCGA-F5-6814-01 | Colorectum | rectum adenocarcinoma | Male | <65 | I/II | Unknown | Unknown | SD |
| ASAH1 | SNV | Missense_Mutation | rs551102859 | c.182N>A | p.Gly61Asp | p.G61D | Q13510 | protein_coding | tolerated(0.34) | benign(0.091) | TCGA-A5-A0G1-01 | Endometrium | uterine corpus endometrioid carcinoma | Female | >=65 | I/II | Unknown | Unknown | SD |
| ASAH1 | SNV | Missense_Mutation | novel | c.399G>T | p.Lys133Asn | p.K133N | Q13510 | protein_coding | deleterious(0.02) | possibly_damaging(0.802) | TCGA-A5-A0G2-01 | Endometrium | uterine corpus endometrioid carcinoma | Female | <65 | III/IV | Unknown | Unknown | SD |
| Page: 1 2 3 |
Top |
Related drugs of malignant transformation related genes |
| Identification of chemicals and drugs interact with genes involved in malignant transfromation |
| (DGIdb 4.0) |
| Entrez ID | Symbol | Category | Interaction Types | Drug Claim Name | Drug Name | PMIDs |
| Page: 1 |

Copyright 2023-Present -The University of Texas Health Science Center at Houston |