
|
|||||
|
 | |
| |
| |
| |
| |
| |
|
Gene: ARID4A |
Gene summary for ARID4A |
| Gene information | Species | Human | Gene symbol | ARID4A | Gene ID | 5926 |
| Gene name | AT-rich interaction domain 4A | |
| Gene Alias | RBBP-1 | |
| Cytomap | 14q23.1 | |
| Gene Type | protein-coding | GO ID | GO:0000003 | UniProtAcc | A0A024R657 |
Top |
Malignant transformation analysis |
| Identification of the aberrant gene expression in precancerous and cancerous lesions by comparing the gene expression of stem-like cells in diseased tissues with normal stem cells |
| Entrez ID | Symbol | Replicates | Species | Organ | Tissue | Adj P-value | Log2FC | Malignancy |
| 5926 | ARID4A | LZE4T | Human | Esophagus | ESCC | 1.71e-15 | 6.02e-01 | 0.0811 |
| 5926 | ARID4A | LZE8T | Human | Esophagus | ESCC | 4.84e-02 | 1.54e-01 | 0.067 |
| 5926 | ARID4A | LZE20T | Human | Esophagus | ESCC | 1.35e-10 | 5.50e-01 | 0.0662 |
| 5926 | ARID4A | LZE22T | Human | Esophagus | ESCC | 5.91e-03 | 4.38e-01 | 0.068 |
| 5926 | ARID4A | LZE24T | Human | Esophagus | ESCC | 4.92e-13 | 3.15e-01 | 0.0596 |
| 5926 | ARID4A | LZE21T | Human | Esophagus | ESCC | 4.11e-02 | 2.66e-01 | 0.0655 |
| 5926 | ARID4A | P1T-E | Human | Esophagus | ESCC | 2.27e-11 | 5.97e-01 | 0.0875 |
| 5926 | ARID4A | P2T-E | Human | Esophagus | ESCC | 3.64e-27 | 5.13e-01 | 0.1177 |
| 5926 | ARID4A | P4T-E | Human | Esophagus | ESCC | 1.65e-29 | 7.03e-01 | 0.1323 |
| 5926 | ARID4A | P5T-E | Human | Esophagus | ESCC | 2.73e-22 | 4.23e-01 | 0.1327 |
| 5926 | ARID4A | P8T-E | Human | Esophagus | ESCC | 1.35e-33 | 6.74e-01 | 0.0889 |
| 5926 | ARID4A | P9T-E | Human | Esophagus | ESCC | 1.50e-12 | 3.24e-01 | 0.1131 |
| 5926 | ARID4A | P10T-E | Human | Esophagus | ESCC | 1.43e-38 | 6.76e-01 | 0.116 |
| 5926 | ARID4A | P11T-E | Human | Esophagus | ESCC | 3.68e-13 | 7.27e-01 | 0.1426 |
| 5926 | ARID4A | P12T-E | Human | Esophagus | ESCC | 1.18e-44 | 8.05e-01 | 0.1122 |
| 5926 | ARID4A | P15T-E | Human | Esophagus | ESCC | 2.36e-55 | 1.23e+00 | 0.1149 |
| 5926 | ARID4A | P16T-E | Human | Esophagus | ESCC | 5.89e-37 | 6.95e-01 | 0.1153 |
| 5926 | ARID4A | P17T-E | Human | Esophagus | ESCC | 7.58e-03 | 1.99e-01 | 0.1278 |
| 5926 | ARID4A | P20T-E | Human | Esophagus | ESCC | 1.58e-22 | 6.19e-01 | 0.1124 |
| 5926 | ARID4A | P21T-E | Human | Esophagus | ESCC | 3.71e-13 | 2.10e-01 | 0.1617 |
| Page: 1 2 3 4 5 6 7 |
| Tissue | Expression Dynamics | Abbreviation |
| Esophagus |  | ESCC: Esophageal squamous cell carcinoma |
| HGIN: High-grade intraepithelial neoplasias | ||
| LGIN: Low-grade intraepithelial neoplasias | ||
| Liver | 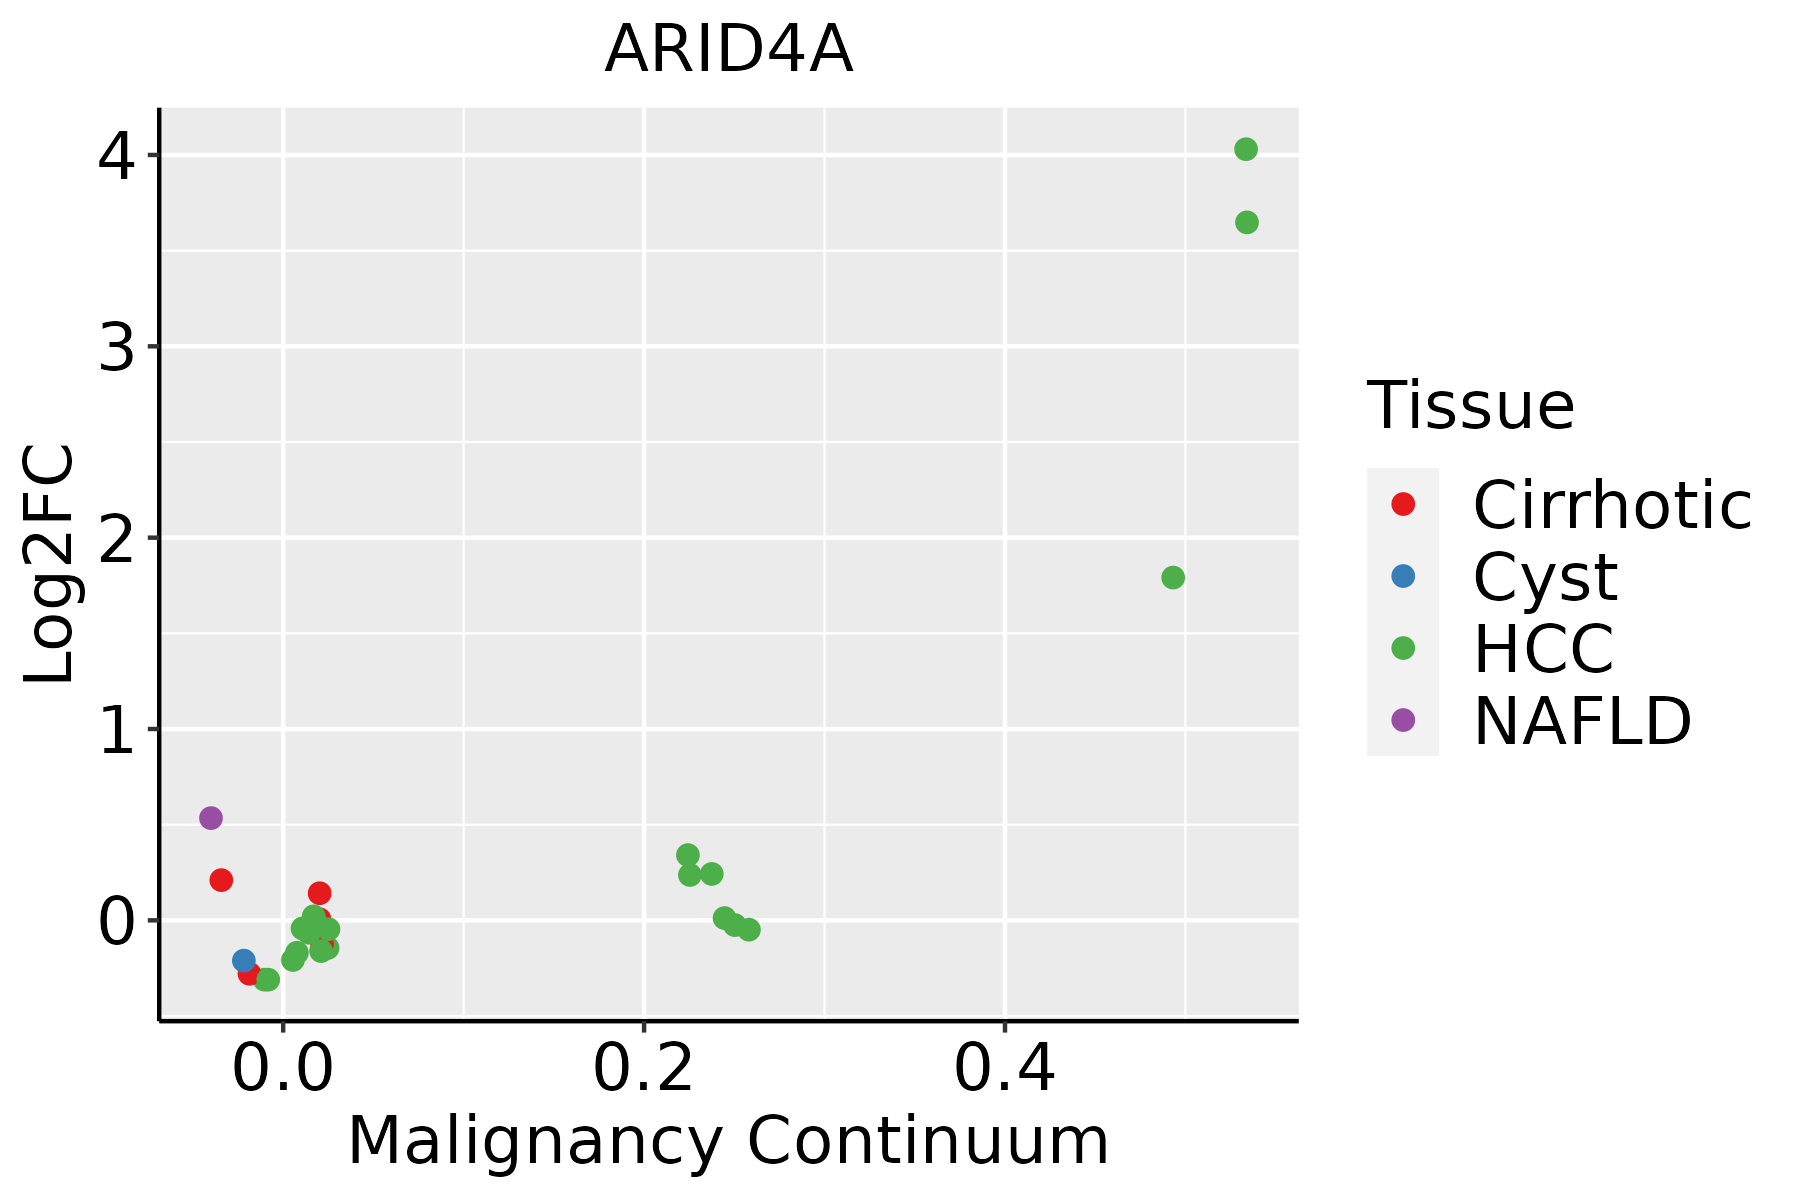 | HCC: Hepatocellular carcinoma |
| NAFLD: Non-alcoholic fatty liver disease | ||
| Lung |  | AAH: Atypical adenomatous hyperplasia |
| AIS: Adenocarcinoma in situ | ||
| IAC: Invasive lung adenocarcinoma | ||
| MIA: Minimally invasive adenocarcinoma | ||
| Oral Cavity |  | EOLP: Erosive Oral lichen planus |
| LP: leukoplakia | ||
| NEOLP: Non-erosive oral lichen planus | ||
| OSCC: Oral squamous cell carcinoma | ||
| Prostate | 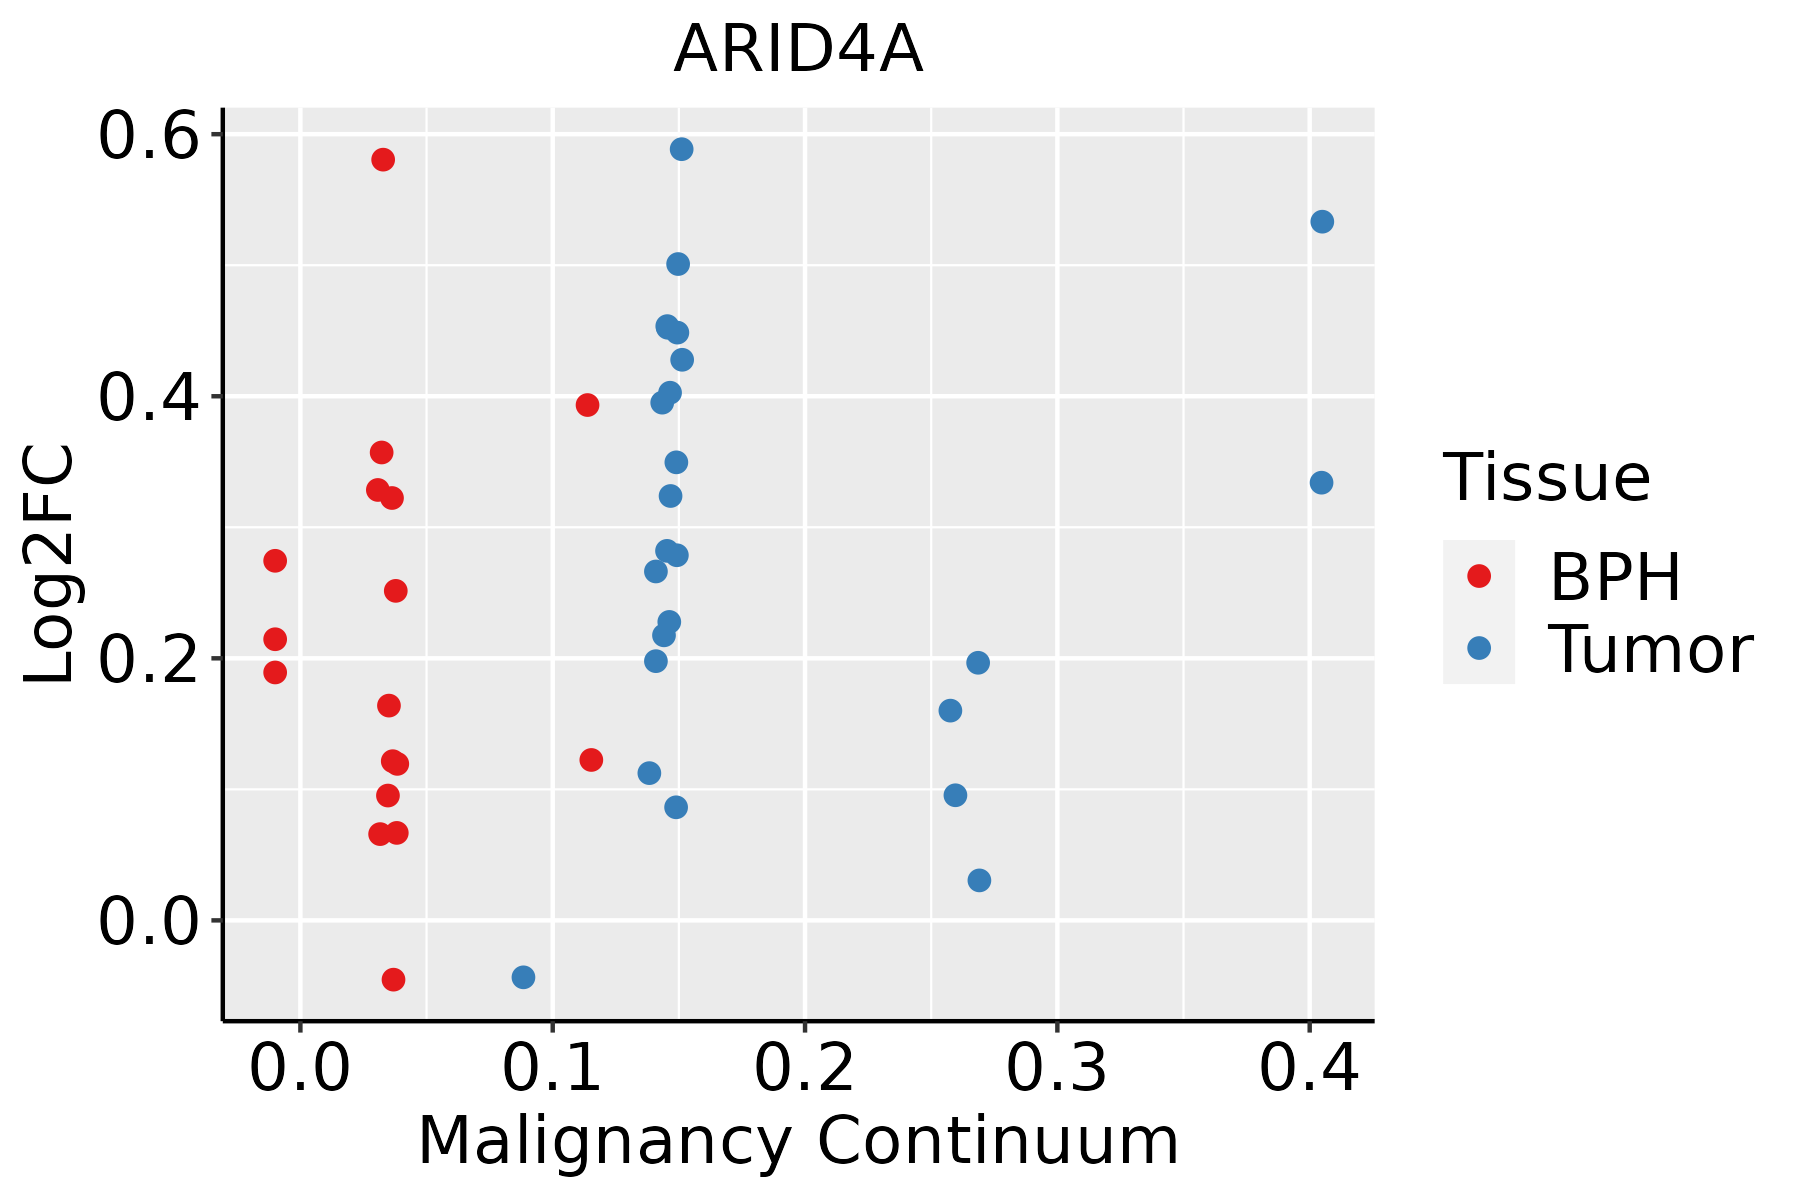 | BPH: Benign Prostatic Hyperplasia |
| Thyroid |  | ATC: Anaplastic thyroid cancer |
| HT: Hashimoto's thyroiditis | ||
| PTC: Papillary thyroid cancer |
| ∗log2FC in expression of this searched gene in stem-like cells from each diseased tissue sample relative to stem-like cells in normal samples in each tissue plotted against the malignancy continuum. Samples are colored based on if they are from different disease stage. |
Top |
Malignant transformation related pathway analysis |
| Find out the enriched GO biological processes and KEGG pathways involved in transition from healthy to precancer to cancer |
| Tissue | Disease Stage | Enriched GO biological Processes |
| Colorectum | AD |  |
| Colorectum | SER |  |
| Colorectum | MSS |  |
| Colorectum | MSI-H |  |
| Colorectum | FAP |  |
| ∗Top 15 enriched GO BP terms are showed in the bar plot of each disease state in each tissue. Each row represents a significant GO biological process which is colored according to the -log10(p.adjust). |
| Page: 1 2 3 4 5 6 7 8 9 |
| GO ID | Tissue | Disease Stage | Description | Gene Ratio | Bg Ratio | pvalue | p.adjust | Count |
| GO:00349681 | Liver | HCC | histone lysine methylation | 70/7958 | 115/18723 | 5.32e-05 | 5.04e-04 | 70 |
| GO:004887222 | Liver | HCC | homeostasis of number of cells | 147/7958 | 272/18723 | 7.48e-05 | 6.70e-04 | 147 |
| GO:00180221 | Liver | HCC | peptidyl-lysine methylation | 74/7958 | 131/18723 | 8.46e-04 | 5.06e-03 | 74 |
| GO:0040029 | Liver | HCC | regulation of gene expression, epigenetic | 61/7958 | 105/18723 | 9.02e-04 | 5.31e-03 | 61 |
| GO:0051568 | Liver | HCC | histone H3-K4 methylation | 36/7958 | 59/18723 | 3.15e-03 | 1.46e-02 | 36 |
| GO:000206422 | Liver | HCC | epithelial cell development | 114/7958 | 220/18723 | 3.19e-03 | 1.47e-02 | 114 |
| GO:006145811 | Liver | HCC | reproductive system development | 205/7958 | 427/18723 | 1.16e-02 | 4.27e-02 | 205 |
| GO:00165704 | Lung | IAC | histone modification | 93/2061 | 463/18723 | 5.41e-09 | 8.03e-07 | 93 |
| GO:00020648 | Lung | IAC | epithelial cell development | 52/2061 | 220/18723 | 6.75e-08 | 6.91e-06 | 52 |
| GO:00341018 | Lung | IAC | erythrocyte homeostasis | 34/2061 | 129/18723 | 8.85e-07 | 4.95e-05 | 34 |
| GO:00302188 | Lung | IAC | erythrocyte differentiation | 32/2061 | 120/18723 | 1.39e-06 | 7.05e-05 | 32 |
| GO:00614586 | Lung | IAC | reproductive system development | 79/2061 | 427/18723 | 2.39e-06 | 1.06e-04 | 79 |
| GO:00486086 | Lung | IAC | reproductive structure development | 78/2061 | 424/18723 | 3.44e-06 | 1.44e-04 | 78 |
| GO:00022628 | Lung | IAC | myeloid cell homeostasis | 37/2061 | 157/18723 | 5.42e-06 | 2.09e-04 | 37 |
| GO:00300998 | Lung | IAC | myeloid cell differentiation | 70/2061 | 381/18723 | 1.12e-05 | 3.45e-04 | 70 |
| GO:00488728 | Lung | IAC | homeostasis of number of cells | 54/2061 | 272/18723 | 1.20e-05 | 3.64e-04 | 54 |
| GO:00349684 | Lung | IAC | histone lysine methylation | 25/2061 | 115/18723 | 6.35e-04 | 8.68e-03 | 25 |
| GO:00182053 | Lung | IAC | peptidyl-lysine modification | 62/2061 | 376/18723 | 7.55e-04 | 9.82e-03 | 62 |
| GO:00180223 | Lung | IAC | peptidyl-lysine methylation | 27/2061 | 131/18723 | 9.41e-04 | 1.14e-02 | 27 |
| GO:00064794 | Lung | IAC | protein methylation | 34/2061 | 181/18723 | 1.28e-03 | 1.45e-02 | 34 |
| Page: 1 2 3 4 5 6 7 8 9 10 11 12 |
| Pathway ID | Tissue | Disease Stage | Description | Gene Ratio | Bg Ratio | pvalue | p.adjust | qvalue | Count |
| Page: 1 |
Top |
Cell-cell communication analysis |
| Identification of potential cell-cell interactions between two cell types and their ligand-receptor pairs for different disease states |
| Ligand | Receptor | LRpair | Pathway | Tissue | Disease Stage |
| Page: 1 |
Top |
Single-cell gene regulatory network inference analysis |
| Find out the significant the regulons (TFs) and the target genes of each regulon across cell types for different disease states |
| TF | Cell Type | Tissue | Disease Stage | Target Gene | RSS | Regulon Activity |
| ∗The dot plots of a searched regulon are shown for all cell subpopulations in each disease state of each tissue based on the regulon specific score inferred using pySCENIC and by calculating the average expression. |
| Page: 1 |
Top |
Somatic mutation of malignant transformation related genes |
| Annotation of somatic variants for genes involved in malignant transformation |
| Hugo Symbol | Variant Class | Variant Classification | dbSNP RS | HGVSc | HGVSp | HGVSp Short | SWISSPROT | BIOTYPE | SIFT | PolyPhen | Tumor Sample Barcode | Tissue | Histology | Sex | Age | Stage | Therapy Types | Drugs | Outcome |
| ARID4A | SNV | Missense_Mutation | c.962A>G | p.Lys321Arg | p.K321R | P29374 | protein_coding | deleterious(0.02) | probably_damaging(0.998) | TCGA-AR-A0TV-01 | Breast | breast invasive carcinoma | Female | >=65 | I/II | Unknown | Unknown | SD | |
| ARID4A | SNV | Missense_Mutation | c.3109C>G | p.Gln1037Glu | p.Q1037E | P29374 | protein_coding | tolerated(0.11) | benign(0.107) | TCGA-B6-A0RE-01 | Breast | breast invasive carcinoma | Female | <65 | I/II | Unknown | Unknown | SD | |
| ARID4A | SNV | Missense_Mutation | c.2476N>T | p.His826Tyr | p.H826Y | P29374 | protein_coding | deleterious_low_confidence(0.01) | benign(0.013) | TCGA-C8-A26Y-01 | Breast | breast invasive carcinoma | Female | >=65 | I/II | Unknown | Unknown | SD | |
| ARID4A | SNV | Missense_Mutation | novel | c.375N>T | p.Leu125Phe | p.L125F | P29374 | protein_coding | deleterious(0) | probably_damaging(0.999) | TCGA-E2-A2P6-01 | Breast | breast invasive carcinoma | Female | >=65 | I/II | Hormone Therapy | anastrozole | SD |
| ARID4A | deletion | In_Frame_Del | c.1948_1962delNNNNNNNNNNNNNNN | p.Asp650_Asp654del | p.D650_D654del | P29374 | protein_coding | TCGA-B6-A0RS-01 | Breast | breast invasive carcinoma | Female | <65 | I/II | Unknown | Unknown | PD | |||
| ARID4A | insertion | Frame_Shift_Ins | novel | c.1920dupA | p.Gln641ThrfsTer6 | p.Q641Tfs*6 | P29374 | protein_coding | TCGA-D8-A1J8-01 | Breast | breast invasive carcinoma | Female | >=65 | I/II | Hormone Therapy | nolvadex | SD | ||
| ARID4A | deletion | Frame_Shift_Del | novel | c.1915delN | p.Lys640AsnfsTer32 | p.K640Nfs*32 | P29374 | protein_coding | TCGA-EW-A2FV-01 | Breast | breast invasive carcinoma | Female | <65 | III/IV | Chemotherapy | docetaxel | SD | ||
| ARID4A | SNV | Missense_Mutation | novel | c.3665N>T | p.Arg1222Met | p.R1222M | P29374 | protein_coding | deleterious(0) | probably_damaging(0.993) | TCGA-2W-A8YY-01 | Cervix | cervical & endocervical cancer | Female | <65 | I/II | Chemotherapy | cisplatin | CR |
| ARID4A | SNV | Missense_Mutation | c.1525A>G | p.Thr509Ala | p.T509A | P29374 | protein_coding | tolerated(0.26) | benign(0) | TCGA-BI-A0VR-01 | Cervix | cervical & endocervical cancer | Female | <65 | III/IV | Unknown | Unknown | SD | |
| ARID4A | SNV | Missense_Mutation | rs760395662 | c.2281G>C | p.Glu761Gln | p.E761Q | P29374 | protein_coding | deleterious_low_confidence(0.01) | benign(0.003) | TCGA-FU-A23L-01 | Cervix | cervical & endocervical cancer | Female | <65 | I/II | Chemotherapy | cisplatin | CR |
| Page: 1 2 3 4 5 6 7 8 9 10 11 12 13 14 |
Top |
Related drugs of malignant transformation related genes |
| Identification of chemicals and drugs interact with genes involved in malignant transfromation |
| (DGIdb 4.0) |
| Entrez ID | Symbol | Category | Interaction Types | Drug Claim Name | Drug Name | PMIDs |
| Page: 1 |

Copyright 2023-Present -The University of Texas Health Science Center at Houston |